Central free–free-dominated 880 emission in II Zw 40
Abstract
The central star-forming region in a blue compact dwarf galaxy, II Zw 40, was observed in the 340 GHz () band at arcsec (250 pc) resolution with the Submillimetre Array (SMA). A source associated with the central star-forming complex was detected with a flux of mJy. The structure is more extended than the beam in the east–west direction. The SMA 880 flux is analyzed by using theoretical models of radio spectral energy distribution along with centimetre interferometric measurements in the literature. We find (i) that the SMA 880 flux is dominated ( per cent) by free–free emission from the central compact star-forming region, and (ii) that the contribution from dust emission to the SMA 880 flux is at most mJy. We also utilize our models to derive the radio–FIR relation of the II Zw 40 centre, suggesting that free–free absorption at low frequencies ( several GHz; several cm) and spatial extent of dust affect the radio–FIR relation.
keywords:
dust, extinction — galaxies: dwarf — galaxies: evolution —galaxies: individual (II Zw 40) — H ii regions — submillimetre: galaxies1 Introduction
Blue compact dwarf galaxies (BCDs) generally host compact and ongoing star formation activities in metal-poor and gas-rich environments (Sargent & Searle, 1970; van Zee, Skillman, & Salzer, 1998). Because both low metallicity and rich gas content indicate an early evolutionary stage, BCDs can be used as nearby laboratories of primeval galaxies which should exist at high redshift. In some BCDs, the most active class of star formation is taking place in super star clusters (SSCs) (Turner, Ho, & Beck, 1998; Kobulnicky & Johnson, 1999; Johnson & Kobulnicky, 2003), which are expected to ‘mimic’ the starburst in high-redshift primeval galaxies.
II Zw 40 is a well studied BCD with a low oxygen abundance, (Thuan & Izotov, 2005). This galaxy hosts a high star formation activity associated with the SSCs in the centre. At centimetre wavelengths, the central star-forming region in II Zw 40 is compact and optically thick for free–free absorption, and is categorized as a ‘supernebula’ or ‘ultradense H ii region’ (Turner, Ho, & Beck, 1998; Kobulnicky & Johnson, 1999). Such a dense and compact star formation activity is called ‘active’ mode in Hunt et al. (2003) and Hirashita & Hunt (2004). II Zw 40 is also classified as a Wolf-Rayet galaxy: the Wolf-Rayet feature indicates that the typical age of the current starburst is a few Myr (Vacca & Conti, 1992). Buckalew, Kobulnicky, & Dufour (2005) derived an age of 2.6 Myr from the H and H equivalent widths. The Br equivalent width also shows age Myr (Vanzi et al., 2008). Stellar spectral synthetic models support young ages Myr, although there is an underlying old stellar population (Westera et al., 2004).
In order to trace dense ‘embedded’ star-formation activities, optically thin star formation indicators are useful, such as far-infrared (FIR) dust luminosity (e.g. Kennicutt, 1998; Inoue, Hirashita, & Kamaya, 2000) and radio (thermal plus non-thermal) luminosity (Condon, 1992). Indeed, there is a correlation between FIR and radio luminosities in nearby star-forming galaxies (e.g., de Jong et al., 1985; Helou, Soifer, & Rowan-Robinson, 1985), which is naturally explained if both luminosities are strongly connected with star formation activities (Völk, 1989). However, the studies of radio–FIR relation are biased to objects with FIR detection (e.g. Condon, 1992), which means that a significant dust enrichment has already occurred. Therefore, the evolution of radio–FIR relation in young primeval galaxies is not yet clear. The gas density, the magnetic field strength, and the energy density of cosmic ray electrons affect the evolution of radio emission on various time-scales (Helou & Bicay, 1993; Niklas & Beck, 1997; Murphy, 2009; Lacki & Thompson, 2010), while the dust enrichment plays a role to increase the FIR luminosity (Hirashita & Hunt, 2008).
There have been some observational studies on the evolution of radio–FIR relation along the cosmic age. The radio–FIR relation at moderate and high redshifts () is broadly similar to that at the local Universe (e.g. Garrett, 2002; Gruppioni et al., 2003; Ibar et al., 2008; Murphy, 2009; Michałowski, Watson, & Hjorth, 2010), although there is also a slight indication of evolution (Vlahakis, Eales, & Dunne, 2007; Seymour et al., 2009; Michałowski et al., 2010). The disadvantage of high- observations is the difficulty in deriving quantities related to galaxy evolution (age, metallicity, etc.) with high accuracy. On the other hand, studies of nearby metal-poor dwarf galaxies as ‘laboratories’ of primeval galaxies provide an alternative way to approach the properties of primeval galaxies. Hopkins, Schulte-Ladbeck, & Drozdovsky (2002) and Wu et al. (2008) conclude that the radio–FIR relation of star-forming dwarf galaxies is similar to that of normal galaxies in spite of the difference in metallicity (see also Klein, Weiland, & Brinks, 1991), although Cannon et al. (2005, 2006) find a significant deviation from the canonical radio–FIR relation for some individual dwarf galaxies.
In this paper, we do not take a statistical way, but investigate a single object in details. II Zw 40 is suitable for studying radio–FIR emission in a metal-poor young object, since as mentioned above it hosts an extremely young ( Myr) active star formation with a metallicity of 1/4 Z☉ (for the solar metallicity, we adopt ; Lodders 2003). In order to spot the young star-forming component, a high resolution is necessary. The star-forming region is resolved well at centimetre wavelengths, while there is no information on FIR–submillimetre (submm) dust emission on such a small scale. A submm interferometric observation is desired for the purpose of resolving the dust emission in the star-forming region. Therefore, we observed II Zw 40 by the Submillimetre Array (SMA; Ho, Moran, & Lo 2004), and we report on this observation in this paper. This observation, combined with centimetre radio interferometric data in the literature, will enable us to obtain the radio–FIR emission properties (or radio–FIR relation) in the very young star-forming region with a low metallicity.
This paper is organized as follows. We explain the observations and the data reduction in Section 2, and describe observational results in Section 3. In Section 4, we interpret the results along with the radio data in the literature by using theoretical models. In Section 5, we analyze the contribution from dust emission to the SMA flux. We discuss the radio–FIR relation based on the SMA observation in Section 6. Finally, we conclude in Section 7. The distance to II Zw 40 is assumed to be Mpc ( km s-1 with km s-1 Mpc-1). At this distance, 1 arcsec corresponds to 50.9 pc.
2 Observations and data
The SMA observation of II Zw 40 was carried out in the 340 GHz (880 ) band on 2010 March 30 in the subcompact configuration. Six antennas were used with projected antenna separations between 9.5 and 25 m. The receivers have two sidebands, the lower and upper sidebands, which covered the frequency ranges from 331.0 to 335.0 GHz, and from 342.9 to 346.9 GHz, respectively. The visibility data were calibrated with the MIR package, with Mars as a flux calibrator (with an adopted flux of 1194 Jy), quasars J0423013 and J0730116 as amplitude and phase calibrators, and quasar 3C273 as a band pass calibrator. The calibrated visibility data were imaged and CLEANed with the MIRIAD package. The synthesized beam has a size of FWHM () with a major axis position angle of . The beam roughly matches the size of the region of active star formation in the Hubble Space Telescope image (Calzetti et al., 2007) and the Very Large Array (VLA) image (Ulvestad, Johnson, & Neff, 2007). The largest angular scale sampled by this observation is .
| Flux | Image b | Fit c | Ref. d | ||
|---|---|---|---|---|---|
| (GHz) | (arcsec) | (mJy) | |||
| 1.4 | — | S | 1 | ||
| 1.5 | — | S | 2 | ||
| 1.5 | — | S | 3 | ||
| 4.8 | — | S | 4 | ||
| 5.0 | — | S | 1 | ||
| 5.0 | 10 | I | 5 | ||
| 5.0 | 4 | M | 5 | ||
| 5.0 | — | S | 2 | ||
| 8.3 | 7 | I | 5 | ||
| 8.3 | 4 | M | 5 | ||
| 15 | 4 | I | 5 | ||
| 25 | — | S | 4 |
a The maximum size scale that is well sampled by the interferometric observation.
b ‘S’, ‘I’, and ‘M’ represent single dish flux, interferometric flux, and matched beam flux, respectively.
c If the data is used to fit the radio emission models in Section 4, this column is marked with .
| Flux | Image a | Ref. b | |
|---|---|---|---|
| () | (mJy) | ||
| 60 | S | 1 | |
| 65 | S | 2 | |
| 70 | S | 3 | |
| 90 | S | 2 | |
| 100 | S | 1 | |
| 140 | S | 2 | |
| 160 | S | 2 | |
| 160 | S | 3 | |
| 450 | S | 1 | |
| 450 | S | 4 | |
| 850 | S | 1 | |
| 850 | S | 4 | |
| 880 | I | 5 |
a ‘S’ and ‘I’ represent single dish flux and interferometric flux, respectively.
In order to estimate the contribution of free–free emission to the 880 SMA flux, we use radio data in the literature (Table 1). The single-dish observations measure the fluxes from the entire galaxy, while the interferometric data are sensitive to angular sizes smaller than . We also adopt the ‘matched beam’ VLA fluxes obtained with data restricted to baselines greater than 20k (i.e. sensitive to structures smaller than 4 arcsec) (Beck et al., 2002). These matched fluxes are used to constrain the properties of the central active star formation. The discrepancy between the matched data and the single-dish data is larger at lower frequencies, which implies that the spectral slope is steeper in the diffuse medium than in the central star-forming region.
For the information on dust emission, we also use FIR data in the literature as listed in Table 2, where the fluxes except for our SMA data are all measured by single-dish observations and represent those of the entire galaxy. We only consider the ‘large grain’ component which is in radiative equilibrium with the ambient interstellar radiation field (see Section 5.1). Thus, we do not use the data at mid-infrared and shorter wavelengths, where very small grains and PAHs dominate dust emission (e.g. Draine & Li, 2001; Dopita et al., 2006) and the spectral energy distribution (SED) is sensitive to grain size distribution.
3 Results
Figure 1 shows the obtained image. The source is clearly detected with a peak intensity of 7.4 (1 mJy beam-1) and a total flux of mJy. There is an extended feature in the east–west direction with FWHM = 7.1 arcsec (the width of the 2 contour is arcsec).
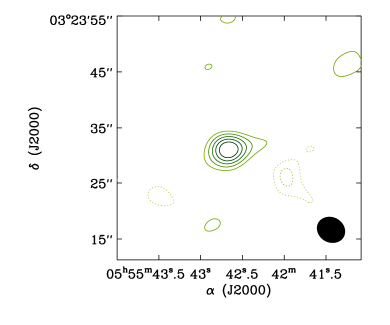
Submm emission in galaxies is usually dominated by dust thermal radiation and contaminated by free–free emission. In order to estimate the contribution from free–free emission, we use the VLA 2 cm continuum data, which is sensitive to spatial scales up to 4 arcsec (Beck et al., 2002). We adopt the emission on this scale as the contribution from the central star-forming region associated with the SSCs. At this wavelength, the single-dish flux is 18.5 mJy, while the VLA flux is mJy (Table 1; Beck et al. 2002); thus, 76 per cent of the total radiation comes from the central star-forming region at 2 cm. Since the emission at 2 cm ( mJy) is dominated by free–free emission (Beck et al., 2002), we extrapolate the flux to 880 by assuming a frequency dependence of (Osterbrock, 1989) and estimate the contribution of free–free emission to the 880 flux to be mJy. Thus, per cent of the flux detected at 880 by SMA is free-free emission from the central star-forming region. The contribution from free–free emission is further investigated by theoretical models in Section 4. The residual ( mJy) is possibly dust emission or diffuse (more extended than but less than ) free–free emission.
4 Theoretical Models
In order to characterize the radio continuum radiation from a star-forming region, thermal free–free radiation from H ii regions, non-thermal synchrotron emission from supernova remnants (SNRs), and dust thermal emission should generally be taken into account. Here, we adopt theoretical models for thermal free–free and non-thermal synchrotron components from Hirashita & Hunt (2006) to interpret the emission from the central star-forming region in II Zw 40. Below we briefly summarize their models. We adopt the same values for the physical parameters as those in Hirashita & Hunt (2006) unless otherwise stated. We also add a simple calculation for dust emission in Section 5.
4.1 Basic setups for the star formation
The star formation is assumed to occur in a uniform star-forming region, whose initial number density of hydrogen nuclei is . The mass finally converted into stars, , is also given. The star formation rate (SFR) as a function of time, , is written as , where is the time measured from the onset of the star formation (thus, we assume for ), and is the free-fall time-scale estimated by (i.e. the SFR is regulated by the dynamical time-scale; e.g. Elmegreen 2000). We simply introduce an efficiency factor , which means that the gas is converted into stars on a time-scale of yr. We treat and as independent parameters. Throughout this paper, we assume a Salpeter initial mass function (IMF) with a stellar mass range of 0.1–100 .
Since star formation does not proceed on a single free-fall time-scale because of some regulation factors such as magnetic fields, turbulence, radiation, etc. (e.g. Price & Bate, 2009), we tentatively adopt (e.g. Lada, Lombardi, & Alves, 2010).111The efficiency factor is different from the star formation efficiency, which is usually defined as the fraction of the finally formed stellar mass to the total initial gas mass. In Lada et al. (2010)’s notation, corresponds to . Although may be uncertain, the quantities actually constrained by the observational data are the gas mass converted into stars and the gas density (see Section 4.3). As long as these quantities are focused on, the results are insensitive to . Moreover, is shorter than the lifetimes of massive stars for most of the parameter range in this paper; in this case, the star formation is regarded as instantaneous as long as we consider the evolution at . If the star formation is instantaneous, total stellar mass , not the detailed star formation history, determines the total luminosity. Special remarks will be made when we discuss ages too young ( Myr) to regard the star formation as instantaneous.
4.2 Radio SED
Thermal free–free radiation is modeled by considering the evolution of the size and density of H ii region. In this paper, the recombination coefficient excluding captures to the ground level is assumed to be (e.g. Spitzer, 1978). We assume the density in the H ii region to be uniform, and neglect the effects of dust in the H ii region. For details on the assumptions, we refer to Hirashita & Hunt (2006).
We consider the time evolution of the hydrogen number density in the H ii region, , and the radius of the ionized region, , according to the evolution of the number of ionizing photons emitted per unit time, . We consider the decrease of by pressure-driven expansion, which is assumed to continue until starts to decrease by the death of massive stars. In calculating the SED of thermal free–free component, the gas temperature in the H ii region is assumed to be K (Thuan & Izotov, 2005). We also take free–free absorption into account. In particular, for an H ii region in such a dense region as the II Zw 40 centre, free–free absorption is important. The free–free optical depth is estimated by using the emission measure EM as (Hunt et al., 2004)
| (1) |
where EM is estimated in terms of the electron number density and the radius of ionized region as . We assume that the absorbing medium is intermixed with the emitting material; that is, the escape fraction is assumed to be .
The non-thermal radio luminosity of SNRs is estimated as , where is the rate of core-collapse supernovae (SNe)222In this paper, we only consider core-collapse SNe originating from massive stars. estimated by assuming that stars more massive than 8 M☉ become SNe, and is the radio energy emitted by a SNR over its entire lifetime (fluence) at 5 GHz. The fluence possibly depends on the ambient density (Arbutina & Urošević, 2005). We adopt W Hz-1 yr, since this value fits the radio SED of SBS 0335052, which also hosts dense and compact H ii regions (Hirashita & Hunt, 2006). Free–free absorption is also applied for all the non-thermal component by a screen geometry: i.e. the observed non-thermal luminosity is . This minimizes the contribution from the non-thermal component especially at low frequencies. If the non-thermal component is not absorbed efficiently, the existence of the non-thermal component is more severely excluded for the II Zw 40 centre (see Section 4.3). Synchrotron self-absorption is not important for SNRs in the frequency range of interest (e.g. Condon, 1992).
We also define the cumulative number of SNe, , as
| (2) |
is used as an indicator of the dust production in SNe (Section 5.3).
4.3 Theoretical results for the radio SED
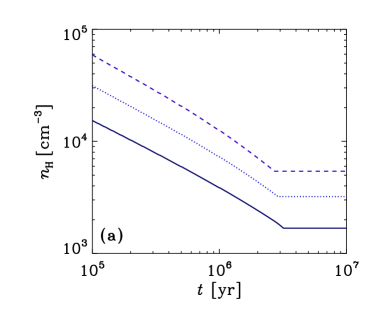
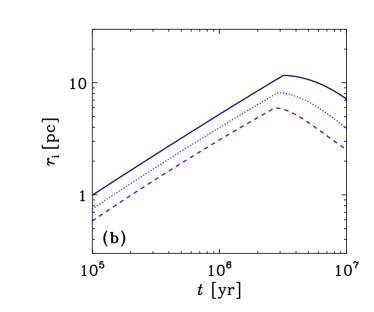
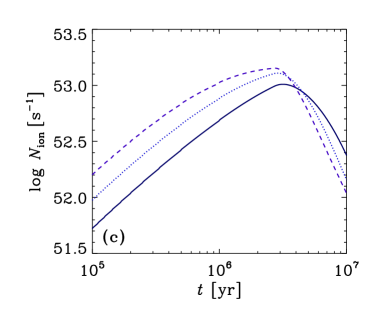
We present the results calculated by the framework described above. We concentrate on the parameter ranges relevant for the central star formation in II Zw 40. As shown later, cm-3 and M☉ fit the radio SED if such a young age Myr as indicated by the optical observations (see Introduction) is adopted. The radio luminosity is almost proportional to , so the constraint on is rather severe. Thus, we mainly investigate the case of . For the density, we examine , , and cm-3.
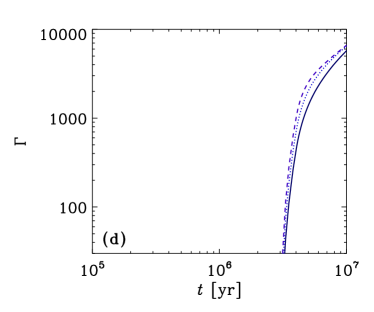
In Fig. 2, we show the key quantities (, , , and ) as functions of time. The ionized region radius monotonically increases and the density decreases until Myr because of the pressure-driven expansion and the increase of . After that, the expansion stops because decreases. The initial SFR is . The SFR measured by the H luminosity is roughly yr-1 (van Zee et al., 1998; Vanzi et al., 2008). Since the SFR exponentially decays on a time-scale of Myr in our models, we obtain the SFR averaged for 3 Myr as yr-1 ( cm-3 is assumed), which is near to the value obtained from the H line. As shown later, the SFR assumed also reproduces the interferometric radio continuum flux. For the stellar mass, Buckalew, Kobulnicky, & Dufour (2005) derived from a stellar spectral synthesis model (Starburst 99; Leitherer et al., 1999) with a Salpeter IMF of stellar mass range 1–120 and a metallicity of 1/5 solar. Vanzi et al. (2008) derived with the same spectral synthesis model but with a Kroupa IMF. Our stellar mass () is bracketed by those two results, which means that our stellar mass is consistent with those in the literature within the uncertainty in the IMF. The evolution of is used for the discussion of dust production by SNe in Section 5.3. rapidly increases after Myr, when the first SNe occur.
In Figure 3a, we show the radio SEDs at , 3, and 5 Myr with cm-3 and . As the age becomes older, the peak shifts to lower frequencies, because the free-free optical depth becomes smaller as the H ii region expands. At and 3 Myr, the emission is completely dominated by free–free emission, and at , the synchrotron component begins to contribute to the emission and the spectrum slope changes. For comparison, the VLA ‘matched’ data whose coverage is restricted to baselines greater than 20k (i.e. sensitive to structures smaller than 4 arcsec) are adopted (three triangles in Fig. 3) as representative fluxes from the central star-forming region.
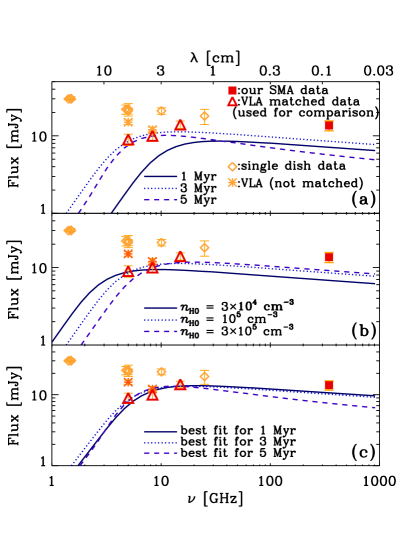
The density strongly affects the frequency at which the flux peaks because free–free absorption is sensitive to the density. In Fig. 3b, we show the SEDs at Myr for various initial densities () with . We observe that the peak position of the SED is indeed sensitive to the density. The rising spectrum of the matched data (triangles) is consistent with free–free absorption.
It is possible to search for the best-fit values of and for each age. The matched VLA data are adopted (three triangles in Fig. 3) for the fitting (one degree of freedom), since our models are applicable to the central star-forming region. The best-fit solutions are shown in Table 3 and Fig. 3c. In the case of Myr, a large is required since only 29 per cent of is converted into stars at Myr. As seen in Fig. 3c, the spectral slope at for Myr is different from that at Myr because of the contribution from the non-thermal component. However, the spectral slope at GHz in the central part of II Zw 40 is not well constrained because of the lack of the high-resolution data at millimetre wavelengths. For all the three ages, a stellar mass of –333At Myr, only 29 per cent of (i.e. M☉) is converted into stars, while at Myr, most of is converted into stars (Table 3). and a current number density in the H ii region of – cm-3 are obtained for the best-fit values.
| Age | ||||
|---|---|---|---|---|
| (Myr) | () | (cm-3) | (cm-3) | |
| 1 | 2.6 | |||
| 3 | 2.0 | |||
| 5 | 2.9 |
a Only 29% of (i.e. M☉) is converted into stars at Myr.
If the age is about 3 Myr as suggested from the optical and near-infrared observations (Introduction; Vanzi et al. 2008), 75 per cent of the flux obtained in our observation is explained by free–free emission according to the best-fit SED at 3 Myr (the flux at is 10.2 mJy in the model, while the observed flux is 13.6 mJy). The difference ( mJy) is likely to be due to the dust and/or diffuse (i.e. not associated with the compact H ii region) free–free emission. The dust emission in the central star-forming region is modeled and examined in the next section.
5 Contribution from dust in the centre
5.1 Dust emission associated with the central star-forming region
Here we model the dust emission associated with the central star-forming region in II Zw 40. We do not model the entire system, so that the following FIR luminosity and dust temperature are valid for the central part of II Zw 40, and are not representative for the global quantities. We consider the wavelength range where large grains, which achieve radiative equilibrium with the ambient stellar radiation field, govern the emission (), since the large grains dominate the total dust mass (e.g. Galliano et al., 2005). We do not treat very small grains contributing to mid-infrared emission.
For simplicity, we adopt a shell-like geometry for the dust distribution. This simplification, which is also assumed in Takeuchi et al. (2003, 2005) and Galliano et al. (2005), helps to decrease the number of physical parameters that affect the emergent dust emission SED in relatively minor ways. If the dust is distributed in a thin shell at a distance from the centre, the dust optical depth, , for the radiation from stars is estimated as
| (3) |
where is the total dust mass in the shell, is the grain radius (uniform spherical grains are assumed), and is the grain material density. Note that will typically be larger than since the dust associated with surrounding neutral or molecular gas contributes significantly to the FIR luminosity (Xu et al., 1992). In this paper, we adopt and g cm-3 (e.g. Draine & Lee, 1984). We estimated the absorption cross section of a grain with the geometrical one because the major heating source is ultraviolet (UV) radiation from OB stars (e.g. Buat & Xu, 1996) (i.e. the grain radius is comparable to the wavelength).
We assume that the UV luminosity is equal to the bolometric luminosity of the OB stars. The OB star luminosity is estimated as a function of time:
| (4) |
where is the main sequence luminosity of a star with mass and is the IMF. For , we adopt the zero metallicity case in Schaerer (2002) to consider a low-metallicity evolutionary stage, and may be 2 times smaller if we assume solar metallicity. We assume that the OB stars are located at the centre. This assumption is valid when we consider the central SSCs as the source of UV radiation in II Zw 40. Since the absorbed UV light is reprocessed into FIR wavelengths, the dust FIR luminosity is estimated by
| (5) |
For simplicity, we adopt a single-temperature approximation for the dust emission, so that the monochromatic luminosity is expressed as
| (6) |
where is the Planck function, is the mass absorption coefficient of the dust, and is the dust temperature. We assume that cm2 g-1 (James et al., 2002). The dust temperature is determined so that it satisfies the total luminosity constraint:
| (7) |
By combining Equations (5)–(7), we obtain
| (8) |
The dust emission SED, , is determined as follows. is given. Then, a certain test value of is assumed. By using Equation (3), is obtained. Consequently is derived from Equation (8). Note that the age has to be assumed to evaluate (Equation 4). Finally, the dust SED is obtained by Equation (6). If the predicted flux overproduces (underproduces) the observed flux, we decrease (increase) and repeat the above procedure.
5.2 Comparison with observational data
As mentioned in Section 4.3, the difference between the predicted flux and the measured one by SMA at 880 should be dust emission or diffuse free–free emission. To simplify the discussion, we interpret that all the difference is dust emission, which means that the following values for and should be taken as upper limits. In the SMA image (Fig. 1), the extension of the 880 emission is arcsec. That is, pc. Any more extended dust component contributes to the difference between the SMA flux and the SCUBA flux. Also, is rejected because the dust temperature is so high that the 60 flux exceeds the IRAS flux. Thus, we investigate and 250 pc as representative cases. For the free–free component, we adopt the best-fit model for (Table 3), i.e. and (the dotted line in Figure 3c). For the dust emission, we adopt the dust SED model in Section 5.1, and we adjust so that it reproduces the SMA observational data according to the formulation in Section 5.1: we obtain and , for and 250 pc, respectively. We present the SEDs in Figure 4. As upper limits for the flux from the central part, we also show the data taken by IRAS (Vader et al., 1993), AKARI (Hirashita et al., 2008), Spitzer (Engelbracht et al., 2008) and SCUBA (Galliano et al., 2005; Hunt, Bianchi, & Maiolino, 2005) for the fluxes from the entire system. Although mid-infrared Spitzer data are available with resolutions comparable to our SMA data, mid-infrared emission comes from a different dust component, very small grains, as mentioned in Section 5.1. Thus, we only concentrate on FIR and submm wavelengths where large grains dominate the dust emission.
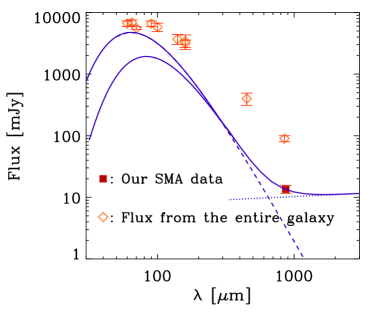
Fig. 4 shows that a significant fraction of the 60–100 flux (71 per cent of the IRAS 60 flux and 54 per cent of the IRAS 100 flux) is explained by the emission from the central star-forming region for pc. If we adopt pc, the contribution from the central star-forming region is smaller (22 per cent of the IRAS 60 flux and 31 per cent of the IRAS 100 flux) because of a lower dust temperature. In any case, an additional emission from a diffuse dust component is necessary to explain the FIR fluxes of the entire system, especially, at wavelengths longer than 100 .
5.3 The origin of dust in the centre
Now we consider the origin of dust in the II Zw 40 centre. One of the natural explanations for the dust mass derived above (–) is production in previous episodes of star formation (i.e. preexisting). First, before investigating the possibility of preexisting dust, we examine how much dust can be produced in the current star formation activity. Because the age is young, SNe are the only source of dust grains and evolved low-mass stars such as asymptotic giant branch (AGB) stars are negligible (Valiante et al., 2009; Gall, Andersen, & Hjorth, 2011). Theoretical studies suggest that –1 of dust grains condense in a SN (Kozasa, Hasegawa, & Nomoto, 1989; Todini & Ferrara, 2001; Nozawa et al., 2003; Bianchi & Schneider, 2007; Nozawa et al., 2007, 2010). Infrared and submm observations of SNRs also detected –1 of dust (e.g., Rho et al., 2009; Dunne et al., 2009; Gomez et al., 2009; Matsuura et al., 2011), although quantitative significance of SNe to the dust enrichment in the early galaxy evolution is still debated (Nozawa et al., 2010, and references therein). If we adopt 1 as the ‘maximum’ dust yield per SN, the total dust mass 1– M☉ is explained only if at least SNe occur. (If we consider dust destruction in SNe, more SNe are necessary to explain the total dust amount.) According to Fig. 2, does not reach this number even at yr. Thus, we conclude that the excess at 880 observed in the centre of II Zw 40, if the emission comes from dust, should be contributed from preexisting dust.
As for the possibility of preexisting dust, we may be observing the preexisting dust itself, or dust grains after the growth by the accretion of metals. Hirashita & Kuo (2011) derive the dust growth time-scale for silicate (a similar time-scale is obtained for carbonaceous dust):
| (9) | |||||
where and are the averages of and ( is the grain radius) for grain size distribution, is the metallicity, is the hydrogen number density, is the gas temperature, and is the sticking efficiency of the relevant metal species onto the dust surface. We assume , Z☉ (see Introduction), (Table 3), K (Wilson, Walker, & Thornley, 1997), and (Leitch-Devlin & Williams, 1985; Grassi et al., 2011). Then, we obtain yr, which is comparable to the star formation time-scale. Therefore, if the preexisting grains survive before the current star formation episode, they can grow by the accretion of gas-phase metals.
6 Radio–FIR relation
The 880 emission in the II Zw 40 centre is dominated by free-free emission. At this wavelength, the emission is usually dominated by dust on a galactic scale. Thus, we expect that the properties of FIR dust emission and radio free–free emission in the II Zw 40 centre are different from global galaxy properties. In this section, we examine this expectation quantitatively by using the results in the above sections. Hereafter, we use the term “FIR luminosity” for the dust emission luminosity integrated over 8–1000 .
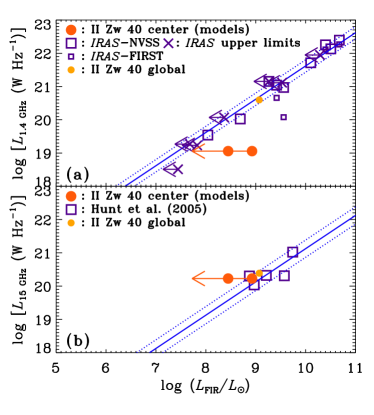
In Fig. 5, we show the relation between the monochromatic luminosity at 1.4 GHz () and the FIR luminosity for the central star-forming region in II Zw 40. The radio luminosity at 1.4 GHz is adopted from the best-fit model for (Figure 3c), while the FIR luminosity is evaluated for and 250 pc (Section 5.2; Fig. 4). Since all the difference between the model free–free flux and the observed 880 flux is assumed to come from dust, the FIR luminosities estimated from the models should be taken as upper limits.
For comparison, we also plot the observational data of BCDs in Fig. 5. The sample is taken from Hopkins et al. (2002) for the FIR and 1.4 GHz luminosities of the entire system (i.e. global luminosities). We only adopt the objects with detections by the NRAO VLA Sky Survey (NVSS) at GHz (Condon et al., 1998) and by the IRAS at m (large open squares). We also adopt the radio flux measured by the Faint Images of the Radio Sky at Twenty cm (FIRST; Becker, White, Helfand, 1995) (small open squares). The FIRST flux is systematically smaller than the NVSS flux. The probable reason which Hopkins et al. (2002) suggest is the difference in their sensitivity to extended emission: FIRST images tend to miss extended emission whose angular size is larger than about 2 arcmin. The FIR luminosity of the BCD sample is estimated based on the IRAS 60 m and 100 m fluxes obtained from NASA/IPAC Extragalactic Database (NED). As an observational estimate of the FIR luminosity , we adopt an empirically derived formula by Nagata et al. (2002), who estimate the total dust luminosity at by using the IRAS 60 and 100 fluxes. Nagata et al. (2002) take into account the contribution from wavelengths longer than the IRAS bands by integrating the modified blackbody spectrum, but they do not consider the contribution from . Therefore, the FIR fluxes may be underestimated by per cent. However, Nagata et al. (2002)’s method can avoid a significant underestimate in a simple IRAS luminosity by Helou et al. (1988), who only considered the contribution from the luminosity in the IRAS FIR bands.444For II Zw 40, the global FIR luminosity estimated by Nagata et al. (2002)’s method is L☉, while that estimated by Helou et al. (1988)’s method is L☉. If a sample BCD is not detected at , we utilize the upper limit at to estimate an upper limit of . The data with upper limits are shown by crosses in Figure 5 ( is taken from the NVSS data). We also show the global luminosities of II Zw 40, whose 1.4 GHz and FIR data are taken from Jaffe et al. (1978) and Vader et al. (1993), respectively.
In order to quantitatively discuss the possible deviation from the standard radio–FIR relation for BCDs, we adopt the radio-to-FIR ratio as usually used (e.g. Condon, 1992). Here we define and as
| (10) | |||||
| (11) |
The average and the standard deviation of are calculated for the sample detected by both IRAS (60 and 100 ) and NVSS, while those of are determined for the sample in Hunt et al. (2005). The averages of and are 2.39 and 2.89, respectively, and the standard deviations are 0.19 and 0.26, respectively. We also show the lines with and to show how much the radio–FIR relation in the central part of II Zw 40 is deviated from the reference radio–FIR relation for the BCDs.
From Fig. 5, we observe that the central region of II Zw 40 has a suppressed 1.4 GHz luminosity and is located below the radio–FIR relation of global BCDs, if the FIR luminosity of II Zw 40 has a value near to the upper limit. This is interpreted to be due to free–free absorption in our models (Fig. 3). Our SMA observation is not sensitive to the possible diffuse synchrotron radiation that would not be affected by free–free absorption. Indeed, the relatively high 1.4 GHz flux from the entire galaxy (Fig. 3) indicates the presence of diffuse nonthermal emission in this galaxy. The trend that compact sources have lower radio-to-FIR ratios is also found for luminous infrared galaxies by Condon et al. (1991), who also attribute the lower ratios to free–free absorption.
To avoid free–free absorption, we use the 15 GHz luminosity. The best-fit model for Myr is used for the 15 GHz luminosity of the II Zw 40 centre (Section 5.2). This luminosity fits the observational data at 15 GHz by Beck et al. (2002). For comparison, we show the global luminosities of BCDs compiled by Hunt et al. (2005) ( is estimated by the method of Nagata et al. 2002; see above). As we observe in Fig. 5b, there is a possibility that the radio–FIR relation is consistent with the global relation if the dust distribution is as compact as pc (but note that the FIR luminosity is upper limit). If the dust distribution is as extended as , the FIR luminosity is significantly suppressed (or the radio luminosity is enhanced) in the centre of II Zw 40.
The deviation of the II Zw 40 centre in the radio–FIR relation is actually expected, rather than peculiar. Indeed, Cannon et al. (2005) find a spatial variation of FIR-to-radio ratio by an order of magnitude within a metal poor dwarf galaxy, IC 2574. Dumas et al. (2011) also show different radio–FIR relations between spiral arms and interarm regions in M51. However, some results show that the radio–FIR correlation holds on 100 pc to sub-kpc scales (Beck & Golla, 1988; Xu et al., 1992; Hughes et al., 2006). There are some physical mechanisms that can contribute to the local variation of the radio–FIR relation such as dust processing by SN shocks (Cannon et al., 2005), dust enrichment by the current star formation activity (Hirashita & Hunt, 2008), amplification of magnetic fields (Beck & Golla, 1988; Dumas et al., 2011), diffusion and escape of cosmic ray electrons (Murphy et al., 2006; Hughes et al., 2006; Murphy et al., 2008), etc. In particular, the diffusion of cosmic ray electrons would predict a large FIR-to-radio ratio on small spatial scales (Hughes et al., 2006). This is not likely to be the reason for the II Zw 40 centre though, as long as its stellar age is too young ( Myr) for SNRs to generate cosmic ray electrons.
If young active star-forming regions generally have similar radio–FIR emission properties to the central part of II Zw 40, free–free dominated submm emission and strong free–free absorption at centimetre and longer wavelengths will be a useful guide to find young active star formation in dense medium. This issue will be further investigated by collecting a sample of active star-forming BCDs with submm interferometry in the future.
7 Conclusion
In order to reveal the radiative properties of young active starburst, the central star-forming region in II Zw 40 was observed in the 340 GHz (880 ) band at resolution with SMA. A source associated with the central star-forming complex was detected with a flux of mJy and a 10-arcsec elongation in the east–west direction. The flux in the central part of II Zw 40 has been analyzed by using the theoretical radio SED model developed by Hirashita & Hunt (2006), and interpreted along with interferometric measurements at centimetre wavelengths in the literature. Then, we have found
-
1.
that the SMA 880 flux is dominated by free-free emission, and
-
2.
that possible contribution from dust emission to the SMA flux is less than mJy.
Our models have been used to derive the radio–FIR relation of the II Zw 40 centre. We have discussed free–free absorption at low frequencies ( several GHz; several cm) and spatial distribution of dust () as possible factors affecting the radio–FIR relation.
Acknowledgments
We thank Kazushi Sakamoto for his continuous help for the SMA observation and the data analysis and his helpful comments on this paper. We thank the SMA staff for their efforts in running and maintaining the array. We are grateful to the anonymous referee, Takashi Onaka, and the member of our star formation group for useful comments that improved this paper very much. This research has made use of the NASA/IPAC Extragalactic Database (NED), which is operated by the Jet Propulsion Laboratory, California Institute of Technology, under contract with the National Aeronautics and Space Administration. This research is supported through NSC grant 99-2112-M-001-006-MY3.
References
- Arbutina & Urošević (2005) Arbutina, B., & Urošević, D. 2005, MNRAS, 360, 76
- Beck & Golla (1988) Beck, R., & Golla, G. 1988, A&A, 191, L9
- Beck et al. (2002) Beck, S. C., Turner, J. L., Langland-Shula, L. E., Meier, D. S., Crosthwaite, L. P., & Gorjian, V. 2002, AJ, 124, 2516
- Becker, White, Helfand (1995) Becker, R. H., White, R. L., & Helfand, D. J. 1995, ApJ, 450, 559
- Bianchi & Schneider (2007) Bianchi, S., & Schneider, R. 2007, MNRAS, 378, 973
- Buat & Xu (1996) Buat, V., & Xu, C. 1996, A&A, 306, 61
- Buckalew, Kobulnicky, & Dufour (2005) Buckalew, B. A., Kobulnicky, H. A., & Dufour, R. J. 2005, ApJS, 157, 30
- Calzetti et al. (2007) Calzetti, D., et al. 2007, ApJ, 666, 870
- Cannon et al. (2005) Cannon, J. M., et al. 2005, ApJ, 630, L37
- Cannon et al. (2006) Cannon, J. M., et al. 2006, ApJ, 647, 293
- Condon (1992) Condon, J. J. 1992, ARA&A, 30, 575
- Condon et al. (1998) Condon, J. J., Cotton, W. D., Greisen, E. W., Yin, Q. F., Perley, R. A., Taylor, G. B., Broderick, J. J. 1998, AJ, 115, 1693
- Condon et al. (1991) Condon, J. J., Huang, Z.-P., Yin, Q. F., & Thuan, T. X. 1991, ApJ, 378, 65
- Deeg et al. (1993) Deeg, H.-J., Brinks, E., Duric, N., Klein, U., & Skillman, E. 1993, ApJ, 410, 626
- de Jong et al. (1985) de Jong, T., Klein, U., Wielebinski, R., & Wunderlich, E. 1985, A&A, 147, L6
- Dopita et al. (2006) Dopita, M. A., et al. 2006, ApJ, 639, 788
- Draine & Lee (1984) Draine, B. T., & Lee, H. M. 1984, ApJ, 285, 89
- Draine & Li (2001) Draine, B. T., & Li, A. 2001, ApJ, 551, 807
- Dumas et al. (2011) Dumas, G. Schinnerer, E., Tabatabaei, F. S., Beck, R., Velusamy, T., & Murphy, E. 2011, AJ, 141, 41
- Dunne et al. (2009) Dunne, L., et al. 2009, MNRAS, 394, 1307
- Elmegreen (2000) Elmegreen, B. G. 2000, ApJ, 530, 277
- Engelbracht et al. (2008) Engelbracht, C. W., Rieke, G. H., Gordon, K. D., Smith, J.-D. T., Werner, M. W., Moustakas, J., Willmer, C. N. A., & Vanzi, L. 2008, ApJ, 678, 804
- Gall, Andersen, & Hjorth (2011) Gall, C., Andersen, A., & Hjorth, J. 2011, A&A, 528, A13
- Galliano et al. (2005) Galliano, F., Madden, S. C., Jones, A. P., Wilson, C. D., & Bernard, J.-P. 2005, A&A, 434, 867
- Garrett (2002) Garrett, M. A. 2002, A&A, 384, L19
- Gomez et al. (2009) Gomez, H. L., et al. 2009, MNRAS, 397, 1621
- Grassi et al. (2011) Grassi, T., Krstic, P., Merlin, E., Buonomo, U., Piovan, L., & Chiosi, C. 2011, A&A, in press
- Gruppioni et al. (2003) Gruppioni, C., Pozzi, F., Zamorani, G., Ciliegi, P., Lari, C., Calabrese, E., La Franca, F., & Matute, I. 2003, MNRAS, 341, L1
- Helou & Bicay (1993) Helou, G., & Bicay, M. D. 1993, ApJ, 415, 93
- Helou et al. (1988) Helou, G., Khan, I. R., Malek, L., & Boehmer, L. 1988, ApJS, 68, 151
- Helou, Soifer, & Rowan-Robinson (1985) Helou, G., Soifer, B. T., & Rowan-Robinson, M. 1985, ApJ, 298, L7
- Hirashita & Hunt (2004) Hirashita, H., & Hunt, L. K. 2004, A&A, 421, 555
- Hirashita & Hunt (2006) Hirashita, H., & Hunt, L. K. 2006, A&A, 460, 67
- Hirashita & Hunt (2008) Hirashita, H., & Hunt, L. K. 2008, Mapping the Galaxy and Nearby Galaxies (Ap&SS Proceedings Ser.), ed. K. Wada & F. Combes, p. 333
- Hirashita et al. (2008) Hirashita, H., Kaneda, H., Onaka, T., & Suzuki, T. 2008, PASJ, 60, S477
- Hirashita & Kuo (2011) Hirashita, H., & Kuo, T.-M. 2011, MNRAS, in press
- Ho, Moran, & Lo (2004) Ho, P. T. P., Moran, J. M., & Lo, K. Y. 2004, ApJL, 616, L1
- Hopkins et al. (2002) Hopkins, A. M., Schulte-Ladbeck, R. E., & Drozdovsky, I. O. 2002, AJ, 124, 862
- Hughes et al. (2006) Hughes, A., Wong, T., Ekers, R., Staveley-Smith, L., Filipovic, M., Maddison, S., Fukui, Y., & Mizuno, N. 2006, MNRAS, 370, 363
- Hunt et al. (2005) Hunt, L. K., Bianchi, S., & Maiolino, R. 2005, A&A, 434, 849
- Hunt et al. (2004) Hunt, L. K., Dyer, K. K., Thuan, T. X., & Ulvestad, J. S. 2004, ApJ, 606, 853
- Hunt et al. (2003) Hunt, L. K., Hirashita, H., Thuan, T. X., Izotov, Y. I., & Vanzi, L. 2003, Galaxy Evolution: Theory and Observations (Rev. Mex. Astron. Astrofis. Ser. Conf.), ed. V. Avila-Reese, C. Firmani, C. Frenk, & C. Allen (arXiv:astro-ph/0310865)
- Ibar et al. (2008) Ibar, E., et al. 2008, MNRAS, 386, 953
- Inoue, Hirashita, & Kamaya (2000) Inoue, A. K., Hirashita, H., & Kamaya, H. 2000, PASJ, 52, 539
- Jaffe et al. (1978) Jaffe, W. J., Perola, G. C., & Tarenghi, M. 1978, ApJ, 224, 808
- James et al. (2002) James, A., Dunne, L., Eales, S., Edmunds, M. G. 2002, MNRAS, 335, 753
- Johnson & Kobulnicky (2003) Johnson, K. E., & Kobulnicky, H. A. 2003, ApJ, 597, 923
- Kennicutt (1998) Kennicutt, R. C., Jr. 1998, ARA&A, 36, 189
- Klein et al. (1991) Klein, U., Weiland, H., & Brinks, E. 1991, A&A, 246, 323
- Klein et al. (1984) Klein, U., Wielebinski, R., & Thuan, T. X. 1984, A&A, 141, 241
- Kobulnicky & Johnson (1999) Kobulnicky, H. A., & Johnson, K. E. 1999, ApJ, 527, 154
- Kozasa, Hasegawa, & Nomoto (1989) Kozasa, T., Hasegawa, H., & Nomoto, K. 1989, ApJ, 344, 325
- Lacki & Thompson (2010) Lacki, B. C., & Thompson, T. A. 2010, ApJ, 717, 196
- Lada et al. (2010) Lada, C. J., Lombardi, M., & Alves, J. F. 2010, ApJ, 724, 687
- Leitch-Devlin & Williams (1985) Leitch-Devlin, M. A., & Williams, D. A. 1985, MNRAS, 213, 295
- Leitherer et al. (1999) Leitherer, C., et al. 1999, ApJS, 123, 3
- Lodders (2003) Lodders, K. 2003, ApJ, 591, 1220
- Matsuura et al. (2011) Matsuura, M., et al. 2011, Science, in press
- Michałowski et al. (2010) Michałowski, M. J., Watson, D., & Hjorth, J. 2010, ApJ, 712, 942
- Murphy (2009) Murphy, E. J. 2009, ApJ, 706, 482
- Murphy et al. (2006) Murphy, E. J., et al. 2006, ApJ, 651, L111
- Murphy et al. (2008) Murphy, E. J., Helou, G., Kenney, J. D. P., Armus, L., & Braun, R. 2008, ApJ, 676, 828
- Nagata et al. (2002) Nagata, H., Shibai, H., Takeuchi, T. T., & Onaka, T. 2002, PASJ, 54, 695
- Niklas & Beck (1997) Niklas, S., & Beck, R. 1997, A&A, 320, 54
- Nozawa et al. (2007) Nozawa, T., Kozasa, T., Habe, A., Dwek, E., Umeda, H., Tominaga, N., Maeda, K., & Nomoto, K. 2007, ApJ, 666, 955
- Nozawa et al. (2010) Nozawa, T., Kozasa, T., Tominaga, N., Maeda, K., Umeda, H., Nomoto, K., & Krause, O. 2010, ApJ, 713, 356
- Nozawa et al. (2003) Nozawa, T., Kozasa, T., Umeda, H., Maeda, K., & Nomoto, K. 2003, ApJ, 598, 785
- Osterbrock (1989) Osterbrock, D. E. 1989, Astrophysics of Gaseous Nebulae and Active Galactic Nuclei (Mill Valley: University Science Books)
- Price & Bate (2009) Price, D. J., & Bate, M. R. 2009, MNRAS, 398, 33
- Rho et al. (2009) Rho, J., Reach, W. T., Tappe, A., Hwang, U., Slavin, J. D., Kozasa, T., & Dunne, L. 2009, ApJ, 700, 579
- Sargent & Searle (1970) Sargent, W. L. W., & Searle, L. 1970, ApJ, 162, L155
- Schaerer (2002) Schaerer, D. 2002, A&A, 382, 28
- Seymour et al. (2009) Seymour, N., Huynh, M., Dwelly, T., Symeonidis, M., Hopkins, A., McHardy, I. M., Page, M. J., & Rieke, G. 2009, MNRAS, 398, 1573
- Spitzer (1978) Spitzer, L. 1978, Physical Processes in the Interstellar Medium (New York: Wiley)
- Takeuchi et al. (2003) Takeuchi, T. T., Hirashita, H., Ishii, T. T., Hunt, L. K., & Ferrara, A. 2003, MNRAS, 343, 839
- Takeuchi et al. (2005) Takeuchi, T. T., Ishii, T. T., Nozawa, T., Kozasa, T., & Hirashita, H. 2005, MNRAS, 362, 592
- Thuan & Izotov (2005) Thuan, T. X., & Izotov, Y. I. 2005, ApJS, 161, 240
- Todini & Ferrara (2001) Todini, P., & Ferrara, A. 2001, MNRAS, 325, 726
- Turner, Ho, & Beck (1998) Turner, J. L., Ho, P. T. P., & Beck, S. C. 1998, AJ, 116, 1212
- Ulvestad, Johnson, & Neff (2007) Ulvestad, J. S., Johnson, K. E., & Neff, S. G. 2007, AJ, 133, 1868
- Vacca & Conti (1992) Vacca, W. D., & Conti, P. S. 1992, ApJ, 401, 543
- Vader et al. (1993) Vader, J. P., Frogel, J. A., Terndrup, D. M., & Heisler, C. A. 1993, AJ, 106, 1743
- Valiante et al. (2009) Valiante, R., Schneider, R., Bianchi, S., & Andersen, A. C. 2009, MNRAS, 397, 1661
- van Zee et al. (1998) van Zee, L., Skillman, E. D., & Salzer, J. J. 1998, AJ, 116, 1186
- Vanzi et al. (2008) Vanzi, L., Cresci, G., Telles, E., & Melnick, J. 2008, A&A, 486, 393
- Vlahakis, Eales, & Dunne (2007) Vlahakis, C., Eales, S., & Dunne, L. 2007, MNRAS, 379, 1042
- Völk (1989) Völk, H. J. 1989, A&A, 218, 67
- Westera et al. (2004) Westera, P., Cuisinier, F., Telles, E., & Kehrig, C. 2004, A&A, 423, 133
- Wilson, Walker, & Thornley (1997) Wilson, C. D., Walker, C. E., & Thornley, M. D. 1997, ApJ, 483, 210
- Wu et al. (2008) Wu, Y., Charmandaris, V., Houck, J. R., Bernard-Salas, J., Lebouteiller, V., Brandl, B. R., & Farrah, D. 2008, ApJ, 676, 970
- Xu et al. (1992) Xu, C., Klein, U., Meinert, D., Wielebinski, R., & Haynes, R. F. 1992, A&A, 257, 47