Present address:] Kamioka Observatory, ICRR, University of Tokyo 456 Higashi-Mozumi, Kamioka-cho, Hida-city, Gifu 506-1205, Japan ††thanks: deceased Present address:] Lames Holding S.r.l., 16043 Chiavari, Italy
MEG Collaboration
New limit on the lepton-flavour violating decay
Abstract
We present a new result based on an analysis of the data collected by the MEG detector at the Paul Scherrer Institut in 2009 and 2010, in search of the lepton flavour violating decay . The likelihood analysis of the combined data sample, which corresponds to a total of muon decays, gives a 90% C.L. upper limit of on the branching ratio of the decay, constituting the most stringent limit on the existence of this decay to date.
pacs:
13.35.Bv; 11.30.Hv; 11.30.Pb; 12.10.DmThe lepton flavour violating (LFV) decay is forbidden within the standard model of elementary particles (SM). Even with the introduction of neutrino masses and mixing SM predicts an immeasurably small branching ratio ( 10-51) for this decay. Conversely new physics scenarios beyond SM, such as supersymmetric grand unified theories or theories with extra dimensions, predict branching ratios in the to 10-14 range barbieri ; hisano ; LFV-EPC . This is close to the present limit set by the MEGA experiment MEGA , , which places one of the most stringent constraints on the formulation of such theories. Observation of therefore would be an unambiguous signature of new physics, while improvements on the existing limit would stringently constrain many of the new physics scenarios beyond SM.
The MEG experiment proposal ; MEG-NPB covers a 10% solid angle, centred around a thin muon stopping target (m-thick polyethylene) and is composed of a positron spectrometer and a photon detector in search of back-to-back, monoenergetic, time coincident photons and positrons from the two-body decays. The positron spectrometer consists of a set of drift chambers (DC) DC and scintillation timing counters (TC) TC located inside a superconducting solenoid with a gradient field COBRA along the beam axis, ranging from 1.27 Tesla at the centre to 0.49 Tesla at either end. The photon detector LXe , located outside of the solenoid, is a homogeneous volume (900 ) of liquid xenon (LXe) viewed by 846 UV-sensitive photo-multiplier tubes (PMTs) submerged in the liquid. The spectrometer measures the positron momentum vector and timing, while the LXe detector is used to reconstruct the ray energy as well as the position and time of its first interaction in LXe. All the signals are individually digitized by in-house designed waveform digitizers based on the multi-GHz domino ring sampler chip (DRS) DRS . The PSI beam line is used to stop positive muons per second in the target. The residual polarization of the decaying muons along the beam axis was measured to be . The background to decay comes either from radiative muon decays (RMD) in which the neutrinos carry away little energy or from an accidental coincidence of an energetic positron from a normal Michel decay with a ray coming from RMD, Bremsstrahlung or positron annihilation-in-flight. The accidental coincidences are the dominant background in this experiment.
The MEG detector response, resolutions and stability are constantly monitored and calibrated. The photomultipliers (PMTs) of the LXe detector are calibrated daily by LEDs and -sources immersed in the liquid alpha . The energy scale and resolutions of the LXe detector are measured over the energy range of to MeV using rays from a radioactive Am/Be source, -reaction using a dedicated Cockcroft-Walton accelerator (CW) CW , and charge exchange and radiative capture reactions (CEX). A 9 MeV- line from the capture in nickel of neutrons from a pulsed and triggerable deuteron-deuteron neutron generator allows one to check the stability of the LXe detector even during data-taking. The relative time between the TC and LXe detector is monitored using RMD and 2-events from reactions.
The trigger requires the presence of a high energy ray in the LXe detector and a hit on the timing counters within a 20 ns window together with an approximate back-to-back topology. Pre-scaled monitoring and calibration triggers are also recorded. A more detailed description of the MEG detector can be found in Ref. MEG-NPB .
The results presented in this paper are based on data collected in 2009 and 2010 (for a total of -decays in the target); the 2010 statistics are about twice that of 2009. All sub-detectors were running stably during these periods. The 2008 data MEG-NPB are not used in this analysis because of their limited statistics and detector performance. In 2010 a DRS upgrade resulted in an improvement in the time resolution while an increase in noise in the DC, due to a deterioration of the HV power supplies, caused slightly worse positron tracking resolutions.
We adopted a likelihood analysis method combined with a blind procedure on examining the data: events close to the signal region were kept hidden (blind region) until all the analysis procedures had been completely defined. The probability density functions (PDFs) needed for the likelihood analysis were constructed using the events outside of the blind region (side-bands).
Several improvements to the analysis have been introduced since the presentation of the preliminary result based on the 2009 data ICHEP and also implemented in the current 2009, as well as in our 2010 analyses. These improvements include a new alignment technique for the DC system; an improved experimental evaluation of the spectrometer performances; a better understanding of the gradient magnetic field; improvement in the relative alignment of the photon detector and the positron spectrometer by means of cosmic ray muons; adoption of a more commonly used statistical method (profile likelihood); a constraint on the background rates in the likelihood analysis from the data in the side-bands.
The kinematic variables used to identify the decays are the -ray and energies (, ), their relative directions (, ) angle def and emission time (). The offline event selection requires at least one -track reconstructed in the spectrometer and pointing to the target, with minimal quality cuts applied. The blind region is defined by MeV and .
The positron track reconstruction in the spectrometer is based on a Kalman filter technique Kalman . Effects of multiple scattering and energy loss in the detector materials in the presence of the non-uniform magnetic field are taken into account. Internal alignment of the DC is obtained by tracking cosmic ray muons without a magnetic field and by minimizing the measured residuals in a manner independent of the initially assumed alignment millipede . The absolute position of the DC system is based on an optical survey.
The magnetic field of the spectrometer was measured at the beginning of the experiment and only its major component along the beam axis is used in the analysis to avoid possible misalignment errors from the Hall probes; the other minor components are deduced from the derivatives of the measured primary component using Maxwell equations together with boundary conditions at a symmetry plane at the magnet centre where the minor components are nearly zero. This magnetic field map agrees to within 0.2% with the field computed for the geometry and currents of the spectrometer coils.
The resolutions of the positron track direction are estimated by exploiting tracks with two full turns in the DC. Each turn is treated as an independent track and the resolutions are extracted from the difference between the two reconstructed sections. The energy resolution is evaluated by fitting the kinematic edge of the Michel decays and is well described by a sum of three Gaussians with resolutions of 0.31 MeV, 1.1 MeV and 2.0 MeV for the core (80%) and the two tail (13% and 7%) components, respectively for 2009 and 0.32 MeV, 1.0 MeV and 2.0 MeV for the core (79%) and the two tail (14% and 7%) components, respectively for 2010.
The decay vertex coordinates and the positron direction at the vertex are determined by extrapolating the reconstructed track back to the target. The -ray direction is defined by the line connecting the decay vertex to the -ray conversion point measured by the LXe detector.
A geometrical correlation exists between errors on at the vertex position and , which is measured by using the two-turn method and is perfectly reproduced by the Monte Carlo (MC) simulation. The -resolution has a -dependence due to the correlation and has a minimum at , where it is measured to be mrad for 2009 (2010) data 222From here on we will quote in parentheses the value in the 2010 data when different from that in 2009.. The -resolution is measured by the two-turn method to be mrad. The resolution on the decay vertex coordinates is also determined by the two-turn method; along the beam axis it is described by a Gaussian with mm while in the vertical direction it is described by the sum of two Gaussians with mm for the core (87%(85%)) and mm for the tail.
The determination of the photon energy in the LXe detector is based on the sum of the number of scintillation photons detected by the PMTs; correction factors take into account the different PMT geometrical acceptances. Due to its geometry the detector response is not totally uniform over the photon entrance window; this is corrected for by using -lines from CW and CEX reactions. The absolute energy scale and resolution at the signal energy MeV are determined by the CEX measurement; the resolution , extracted from a Gaussian fit to the high energy side of the spectrum, depends also on the depth () of the ray conversion point from the photon entrance surface of the LXe detector: and . The 3D-map of the measured resolutions is incorporated into the PDFs for the likelihood analysis.
The photon energy scale and the resolutions are cross-checked by fitting the background spectra measured in the side-bands with the theoretical RMD spectrum folded with the detector resolutions; the resolutions during the run are well represented by the CEX evaluations and the systematic uncertainty of the -scale is estimated to be . Since MEG operates at a high beam intensity, it is important to recognize and unfold pile-up photons. For each event the spatial and temporal distributions of the PMT charge are studied to identify photon pile-up in the LXe detector; in case of positive identification, corrections to the PMT charges are applied. Cosmic ray events are rejected using their characteristic PMT charge distribution.
The position of the first interaction of the -ray in the LXe detector is derived from the light distribution measured by the PMTs close to the region of the energy deposition by fitting the distribution with the expectation. The position resolution in the plane of the photon entrance window is measured to be mm in a dedicated CEX run with a lead slit-collimator placed in front of the LXe detector, while the resolution along the depth of mm and the position dependence of the resolutions are evaluated by a Monte Carlo simulation.
The resolutions on the relative directions (, ) are derived by combining the relevant resolutions of positrons and photons discussed above; the results are 14.5 (17.1) mrad for and 13.1 (14.0) mrad for . The relative time is derived from the two time measurements by the LXe detector and the TC, after correcting for the length of the particle flight-path. The associated resolutions at the signal energy ps are evaluated from the RMD peak observed in the side-band; a small correction takes into account the -dependence measured in the CEX calibration runs. The position of the RMD-peak corresponding to was monitored constantly during the physics data-taking period and found to be stable to within ps.
A likelihood analysis is carried out for events in a portion of the blind region (analysis region) defined by MeV, MeV, ns, mrad and mrad. These intervals in the analysis variables are between five and twenty sigmas wide to fully contain the signal events and also retain some background events. The best estimates of the numbers of signal, RMD and accidental background (BG) events in the analysis region are obtained by maximizing the following likelihood function:
where is the vector of observables for the -th event, , and are the expected numbers of signal, RMD and BG events, while , and are their corresponding PDFs. and is the observed total number of events in the analysis window. and are the numbers of RMD and BG events extrapolated from the side-bands together with their uncertainties and , respectively.
The signal PDF is the product of the PDFs for , , and , which are correlated variables, as explained above, and the PDF. The PDFs properly incorporate the measured resolutions and correlations among , and on an event-by-event basis. The RMD PDF is the product of the same -PDF as that of the signal and the PDF of the other four correlated observables, which is formed by folding the theoretical spectrum with the detector response functions. The BG PDF is the product of the five PDFs, each of which is defined by the single background spectrum, precisely measured in the side-bands. The dependence of the resolutions on the position of the -ray interaction point and on the positron tracking quality is taken into account in the PDFs.
A frequentist approach with a profile likelihood-ratio ordering PDG ; Feldman-Counsins is used to compute the confidence intervals on :
where the hat and double hat denote the best estimates maximizing the likelihood for floating and fixed , respectively. Other, independent analysis schemes based on averaged PDFs without event-by-event information or Bayesian approach were also used and found to be compatible with the analysis presented here to within 10 to 20% difference in the obtained branching ratio upper limits.
In order to convert into a branching ratio value the normalization relative to the Michel decay is computed MEG-NPB by counting the number of Michel positrons passing the same analysis cuts. This is accomplished by means of a pre-scaled Michel positron trigger enabled during the physics data-taking. A correction to the pre-scaling factor due to positron pile-up in the TC is taken into account. Another method for computing the normalization uses RMD events in the side-band and the theoretical branching ratio of the RMD. The normalizations calculated by these two independent methods are in good agreement and are combined to give the normalization factor with a 7% uncertainty.
The sensitivity of the experiment with a null signal hypothesis is evaluated by taking the median of the distribution of the upper limit on the branching ratio obtained over an ensemble of toy MC experiments. The rates of RMD and BG events, as measured in the side-bands, are assumed in the simulated experiments. The branching ratio sensitivity at 90% confidence level (C.L.) is found to be () for the 2009 (2010) data sample and when 2009 and 2010 are combined. These sensitivities are consistent with the upper limits obtained by the likelihood analyses in several comparable analysis regions of the side-bands.
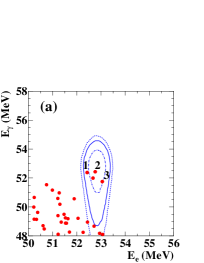

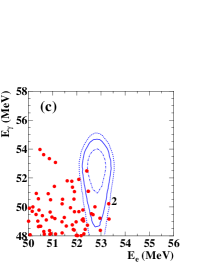
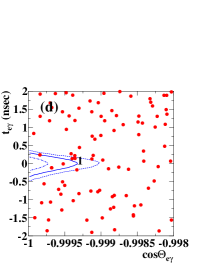
After calibrations, optimization of the analysis algorithms and background studies in the side-bands are completed, the likelihood analysis in the analysis region is performed. In Figures 1 we present the distributions, for the 2009 and 2010 data samples respectively, showing the events seen in the analysis region projected in the vs and vs planes, being the opening angle between the -ray and the positron. In plots and selections in and , each of which is 90% efficient on the signal, are applied ( and ) ; in plots and a selection in which is 90% efficient on the signal and a selection in which is 73% efficient on the signal inside the analysis window are applied ( and ). The contours of the signal PDF are also drawn and a few events with the highest signal likelihood are numbered in a decreasing order of relative signal likelihood, , and being the fractions of the RMD and the BG measured in the side-bands, respectively. High signal likelihood events were thoroughly checked and found to be randomly distributed in time and detector acceptance.
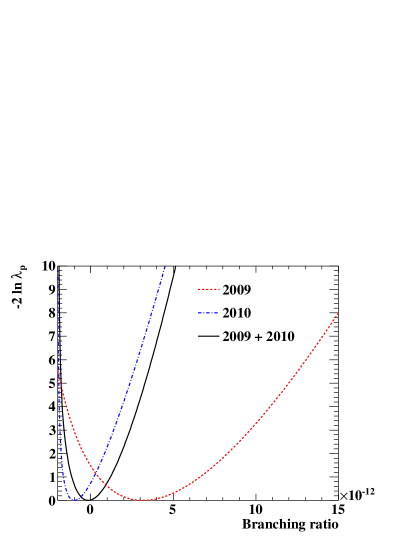
The observed profile likelihood ratios as a function of the branching ratio for 2009, 2010 and the combined data sample are shown in Fig. 2 likelihood curve . The analysis of the full data sample gives a 90% C.L. upper limit of , which constitutes the most stringent limit on the existence of the decay, superseding the previous limit by a factor of 5. The 90% C.L. intervals as well as the best estimate of the branching ratio for 2009 and 2010 data separately are also given in Table 1. The 2009 data set, which gives a positive best estimate for the branching ratio, is consistent with the hypothesis with an 8% probability.
The systematic uncertainties for the parameters of the PDFs and the normalization factor are taken into account in the calculation of the confidence intervals by fluctuating the PDFs according to the uncertainties. The largest contributions to the systematic uncertainty, which amount to a shift of about 2% in total in the branching ratio upper limit, come from the uncertainties of the offsets of the relative angles, the correlations in the positron observables and the normalization.
| Data set | LL | UL | |
|---|---|---|---|
| 2009 | |||
| 2010 | |||
| 2009 + 2010 |
The MEG experiment continues data-taking and is expected to explore the decay down to a branching ratio sensitivity of a few times in the next few years.
I Acknowledgements
We are grateful for the support and co-operation provided by PSI as the host laboratory and to the technical and engineering staff of our institutes. This work is supported by DOE DEFG02-91ER40679 (USA), INFN (Italy) and MEXT KAKENHI 16081205 (Japan).
References
- (1) R. Barbieri, L. Hall and A. Strumia, Nucl. Phys. B 455 (1995) 219.
- (2) J. Hisano, D. Nomura and T. Yanagida, Phys. Lett. B 437 (1998) 351.
- (3) M. Raidal et al., Eur. Phys. J. C 57 (2008) 13.
- (4) M. L. Brooks et al. [MEGA Collaboration], Phys. Rev. Lett. 83, (1999) 1521.
- (5) A. Baldini, T. Mori et al., “The MEG experiment: search for the decay at PSI”, available at http://meg.psi.ch/docs.
- (6) J. Adam et al. [MEG collaboration], Nucl. Phys. B 834 (2010) 1.
- (7) M. Hildebrandt et al. [MEG collaboration], Nucl. Instr. and Meth. A623 (2010) 111.
- (8) M. De Gerone et al., Nucl. Instr. and Meth. A638 (2010) 41.
- (9) W. Ootani et al., IEEE Trans. Applied Superconductivity 14 (2004) 568.
- (10) S. Mihara et al. [MEG Collaboration], J. Phys.: Conf. Ser. 308(2011)012009.
- (11) S. Ritt et al., Nucl. Instr. and Meth. A623 (2010) 486.
- (12) A. Baldini et al., Nucl. Instr. and Meth. A565 (2006) 589.
- (13) J. Adam et al. [MEG collaboration], Nucl. Instr. and Meth. A641 (2011) 19.
- (14) A. M. Baldini and R. Sawada for the MEG collaboration, talks presented at the ICHEP2010, 35th International Conference on High Energy Physics, July 22nd-28th, 2010, Paris, France. Proceedings: PoS (ICHEP2010)528 and PoS (ICHEP2010)263
- (15) and , and being the polar angle and the azimuthal angle, respectively, taking the -axis as the beam-axis.
- (16) R. Frühwirt, et al. “Data Analysis Techniques for High Energy Physics”, second ed. (Cambridge University Press, Cambridge, 2000).
- (17) CMS collaboration, JINST 5 (2010) T03009.
- (18) K. Nakamura et al. (Particle Data Group), J. Phys. G 37 (2010) 075021.
- (19) G. J. Feldman and R. D. Cousins, Phys. Rev D 57, (1998) 3873.
- (20) These curves are not directly used to derive the upper limits which are obtained in a full frequentist approach as described above.