11email: gsurcis@astro.uni-bonn.de 22institutetext: Joint Institute for VLBI in Europe, Postbus 2, 79990 AA Dwingeloo, The Netherlands 33institutetext: Sterrewacht Leiden, Leiden University, Postbus 9513, 2300 RA Leiden, The Netherlands 44institutetext: Max-Planck Institut für Radioastronomie, Auf dem Hügel 69, 53121 Bonn, Germany 55institutetext: National Astronomical Research Institute of Thailand, Ministry of Science and Technology, Rama VI Rd., Bangkok 10400, Thailand
The properties and polarization of the H2O and CH3OH maser environment of NGC7538-IRS 1
Abstract
Context. NGC7538 is a complex massive star-forming region. The region is composed of several radio continuum sources, one of which is IRS 1, a high-mass protostar, from which a 0.3 pc molecular bipolar outflow was detected. Several maser species have been detected around IRS 1. The CH3OH masers have been suggested to trace a Keplerian-disk, while the H2O masers are almost aligned to the outflow. More recent results suggested that the region hosts a torus and potentially a disk, but with a different inclination than the Keplerian-disk that is supposed to be traced by the CH3OH masers.
Aims. Tracing the magnetic field close to protostars is fundamental for determining the orientation of the disk/torus. Recent studies showed that during the protostellar phase of high-mass star formation the magnetic field is oriented along the outflows and around or on the surfaces of the disk/torus. The observations of polarized maser emissions at milliarcsecond resolution can make a crucial contribution to understanding the orientation of the magnetic field and, consequently, the orientation of the disk/torus in NGC7538-IRS 1.
Methods. The NRAO Very Long Baseline Array was used to measure the linear polarization and the Zeeman-splitting of the 22 GHz H2O masers toward NGC7538-IRS 1. The European VLBI Network and the MERLIN telescopes were used to measure the linear polarization and the Zeeman-splitting of the 6.7 GHz CH3OH masers toward the same region.
Results. We detected 17 H2O masers and 49 CH3OH masers at high angular resolution. We detected linear polarization emission toward two H2O masers and toward twenty CH3OH masers. The CH3OH masers, most of which only show a core structure, seem to trace rotating and potentially infalling gas in the inner part of a torus. Significant Zeeman-splitting was measured in three CH3OH masers. No significant (3) magnetic field strength was measured using the H2O masers. We also propose a new description of the structure of the NGC7538-IRS 1 maser region.
Key Words.:
Stars: formation - masers: water, methanol - polarization - magnetic fields - ISM: individual: NGC75381 Introduction
NGC7538 is a complex massive star-forming region located in the Perseus arm of our Galaxy at a distance of 2.65 kpc
(Moscadelli et al. mos09 (2009)). The region is composed of several clusters of infrared sources (Wynn-Williams et al.
wyn74 (1974)) and radio continuum sources (Campbell cam84 (1984)). The brightest source is NGC7538-IRS 1, whose central star
has been suggested to be an O6 star of about 30 M⊙ with systemic local standard of rest velocity km s-1 (Campbell & Thompson cam84b (1984); Sandell et al. san09 (2009); Puga et al. pug10 (2010)). Several
high-velocity molecular bipolar outflows were detected in NGC7538 and one of these is elongated 0.3 pc from IRS 1 (position angle
PA=140∘)
with a velocity of 250 km s-1 and a mass of 82.8 M⊙ (Kameya et al. kam89 (1989); Gaume et al. gau95 (1995);
Davis et al. dav98 (1998); Qiu et al. qiu11 (2011)). VLA continuum observations by Campbell (cam84 (1984)) indicate that the PA of the
outflow decreases away from IRS 1; i.e., 180∘ at 03 (0.004 pc) and 165∘ at (0.03 pc). Kameya et al.
(kam89 (1989)) gave three possible interpretations of this rotation: disk precession, interaction of the flow with dense gas,
and coupling of the gas with a large-scale magnetic field around IRS 1. Because Sandell et al. (san09 (2009)) found that the
collimated free-free jet (opening angle ∘) is approximately aligned with the outflow and that there is a strong accretion
flow toward IRS 1 (accretion rate M⊙), IRS 1 must be surrounded by an accretion
disk. The morphology of the free-free emission, which is optically thick up to 100 GHz (Franco-Hernández & Rodríguez fra04 (2004)),
suggests that the disk should be almost edge-on and oriented east-west (Scoville
et al sco86 (2008); Kameya et al kam89 (1989); Sandell et al. san09 (2009)). A possible detection of this edge-on disk was made
by Minier et al. (min98 (1998)), who observed a linear distribution of the brightest CH3OH masers with an inclination angle of
about 112∘. Pestalozzi et al. (pes04 (2004)) estimated that this disk is a Keplerian disk with an outer radius of 750 AU
and an inner radius of 290 AU by modeling the CH3OH maser emissions at 6.7 and 12.2-GHz.
Recent results disagree with the edge-on disk traced by the CH3OH masers. The observations of the mid-infrared
emission suggest that the radio
continuum emission does not come from a free-free jet but that it traces the ionized gas wind from the disk surface that in the new
scenario would be perpendicular to the CO-bipolar outflow with a disk inclination angle ∘ (De Buizer & Minier bui05 (2005)).
Klaassen et al. (kla09 (2009)) observed two warm gas tracers (SO2 and OCS) toward NGC7538-IRS 1 with the Submillimeter
Array (SMA). Although the region was unresolved, they found a velocity gradient consistent with the CH3OH maser velocities
and perpendicular to the large-scale molecular bipolar outflow. This rotating gas might indicate that there is a torus (with
an angular size of about arcsec; i.e., 5300 AU at 2.65 kpc) surrounding the smaller accretion disk proposed by De Buizer & Minier
(bui05 (2005)).
In addition, Krauss et al. (kra06 (2006)) proposed two possible scenarios for NGC7538-IRS 1 by considering both the linear distribution
of the 6.7-GHz CH3OH masers detected previously (e.g., Pestalozzi et al. pes04 (2004), De Buizer & Minier bui05 (2005))
and the asymmetry in the near infrared (NIR) images observed by them. In their most likely scenario, called
“Scenario B”, the CH3OH masers trace the edge-on disk as suggested by Pestalozzi et al. (pes04 (2004)) and the asymmetry
might be caused by the precession of the jet. In the “Scenario A” the CH3OH masers do not trace a disk but an outflow cavity as proposed by
De Buizer & Minier (bui05 (2005)), where the detected asymmetry might simply reflect the innermost walls of this cavity.
Besides the CH3OH masers, other maser species were detected around NGC7538-IRS 1: OH, H2O, NH3, and H2CO
(e.g., Hutawarakorn & Cohen hut03 (2003); Galván-Madrid et al. gal10 (2010); Gaume et al. gau91 (1991); Hoffman et al.
hof03 (2003)). The OH masers are located southward and show no obvious disk structure or relation to the outflow direction
(Hutawarakorn & Cohen hut03 (2003)). H2CO and H2O masers are located near the center of the continuum emission, and the H2O masers are also almost aligned with the outflow (Galván-Madrid et al. gal10 (2010)). The 6.7 and 12.2-GHz CH3OH masers show a
cone shape that opens to the north-west (Minier et al. min00 (2000)).
So far, the magnetic field structure in NGC7538-IRS 1 has been studied using submillimeter imaging polarimetry (Momose
et al. mom01 (2001)) and OH maser emission (Hutawarakorn & Cohen hut03 (2003)). Although the polarization vectors are locally
disturbed, at an angular resolution of 14 arcsec the magnetic field directions agree with the direction of the outflow
(Momose et al. mom01 (2001)), while at milliarcsecond (mas) resolution the OH maser observations indicate a magnetic field oriented
orthogonal to the outflow (Hutawarakorn & Cohen hut03 (2003)). Because H2O and CH3OH masers were detected close to the center of
the continuum emission, i.e. to the protostar, it is worthwhile investigating their linear and circular polarization emissions.
As shown by Surcis et al. (sur09 (2009), sur11 (2011)) for the massive star-forming region W75N, the polarization observations
of the two maser species can depict a reasonable scenario for the magnetic field close to massive protostars. Moreover, the direction
and strength of the magnetic field might help to decide the debate about the orientation of the disk.
Here we present Very Long Baseline Array (VLBA) observations of H2O masers, Multi-Element Radio Linked
Interferometer network (MERLIN) and European VLBI Network (EVN) observations of CH3OH masers in full polarization toward
NGC7538-IRS 1. In Sect. 3 we show our results obtained by studying the linear and circular
polarization of H2O and CH3OH maser emissions in a similar way as Vlemmings et al. (vle06a (2006), vle10 (2010))
and Surcis et al. (sur09 (2009), sur11 (2011)) for Cepheus A and W75N, respectively. In Sect. 4 we discuss our results and
attempt to disentangle the complex morphology in NGC7538-IRS 1.
| (1) | (2) | (3) | (4) | (5) | (6) | (7) | (8) | (9) | (10) | (11) | (12) | (13) |
| Maser | Group | RA | Dec | Peak flux | ||||||||
| offset | offset | Density(I) | ||||||||||
| (mas) | (mas) | (Jy beam-1) | (km s-1) | (km s-1) | (%) | (∘) | (km s-1) | (log K sr) | (%) | (∘) | ||
| W01 | N | -185.2131 | 141.908 | -57.8 | 0.41 | |||||||
| W02 | N | -176.4676 | 139.422 | -58.3 | 0.32 | |||||||
| W03 | N | -170.9744 | 139.088 | -58.3 | 0.27 | |||||||
| W04 | S | -57.6929 | -1071.104 | -72.2 | 0.59 | |||||||
| W05 | S | -57.4470 | -1056.554 | -57.3 | 0.47 | |||||||
| W06 | S | -57.3376 | -1056.630 | -70.3 | 1.15 | |||||||
| W07 | S | -57.1463 | -1057.065 | -73.3 | 0.77 | |||||||
| W08 | S | -56.7637 | -1056.586 | -67.3 | 1.46 | |||||||
| W09 | S | -56.4631 | -1070.080 | -71.6 | 0.64 | |||||||
| W10 | N | 0 | 0 | -60.6 | 0.56 | |||||||
| W11 | N | 85.5692 | -96.002 | -59.7 | 0.44 | |||||||
| W12 | N | 110.0019 | -13.538 | -60.2 | 0.83 | |||||||
| W13 | N | 111.6690 | -99.499 | -60.1 | 0.47 | |||||||
| W14 | N | 112.8442 | -156.492 | -60.1 | 0.42 | |||||||
| W15 | N | 151.9803 | -90.046 | -59.9 | 0.40 | |||||||
| W16 | N | 242.0042 | 148.947 | -43.3 | 0.62 | |||||||
| W17 | N | 242.7694 | 149.715 | -43.8 | 0.59 |
Notes. (a) The best-fitting results obtained by using a model based on the radiative transfer theory of H2O masers for s-1 (Surcis et al. sur11 (2011)). The errors were determined by analyzing the full probability distribution function. (b) The percentage of circular polarization is given by . (c)The angle between the magnetic field and the maser propagation direction is determined by using the observed and the fitted emerging brightness temperature. The errors were determined by analyzing the full probability distribution function.
2 Observations and analysis
2.1 22 GHz VLBA data
We observed the star-forming region NGC7538-IRS1 in the 616-523 transition of H2O (rest frequency:
22.23508 GHz) with the NRAO111The National Radio Astronomy Observatory (NRAO) is a facility of the National Science
Foundation operated under cooperative agreement by Associated Universities, Inc. VLBA on November 21, 2005. The
observations were made in full polarization spectral mode using four overlapped baseband filters of 1 MHz to cover a
total velocity range of km s-1. Two correlations were performed. One with 128 channels to generate all four
polarization combinations (RR, LL, RL, LR) with a channel width of 7.8 kHz (0.1 km s-1). The other one with high spectral
resolution (512 channels; 1.96 kHz=0.027 km s-1), which only contains the circular polarization combinations (LL, RR), to be able
to detect Zeeman-splitting of the H2O maser across the entire velocity range. Including the overheads, the total observation
time was 8 h.
The data were edited and calibrated using the Astronomical Image Processing System (AIPS) following the method of Kemball
et al. (kem95 (1995)). The bandpass, the delay, the phase, and the polarization calibration were performed on the calibrator
J0359+5057. The fringe-fitting and the self-calibration were performed on the brightest maser feature (W06 in Table 1).
All calibration
steps were initially performed on the dataset with modest spectral resolution after which the solutions, with the exception of
the bandpass solutions that were obtained separately, were copied and applied to the high spectral resolution dataset. Stokes
I, Q, and U data cubes (4 arcsec 4 arcsec, rms mJy beam-1) were created using the AIPS task IMAGR
(beam-size 1.0 mas 0.4 mas) from the modest spectral resolution dataset, while the I and V
cubes (rms mJy beam-1) where imaged from the high spectral resolution dataset and for the same fields. The Q and
U cubes were combined to produce cubes of polarized intensity and polarization angle. Because these observations were
obtained between two VLA polarization calibration observations222http://www.aoc.nrao.edu/ smyers/calibration/
made by the NRAO in 2009, during which
the linear polarization angle of J0359+5057 was constant at -86∘.7, we were able to estimate the polarization angles with
a systemic error of no more than 3∘.
We identified the H2O maser features using the process described in Surcis et al. (sur11 (2011)).
Here the program called “maser finder” is used. This program is able to search maser spots, velocity channel by velocity channel. We
identified a maser feature when three or more maser spots coincide spatially (within a box 2 by 2 pixels) and each of them
appeared in consecutive velocity channels. In Table 1 only the brightest spot of each series of maser spots that fulfill the
criteria described above are reported.
The two maser features
that show linear polarization emission were fitted using a full radiative transfer method code based on the
models for H2O masers of Nedoluha & Watson (ned92 (1992)). They solved the transfer equations for the polarized radiation of 22 GHz
H2O masers in the presence of a magnetic field which causes a Zeeman-splitting that is much smaller than spectral line breadth.
The fit provides the emerging brightness temperature () and the intrinsic thermal linewidth ().
See Vlemmings et al. (vle06a (2006)) and Surcis et al. (sur11 (2011)) for more details. We modeled the observed linear polarized and
total intensity maser spectra by gridding from 0.5 to 3.5 km s-1, in steps of 0.025 km s-1, by using a least-squares
fitting routine. From the fit results we were able to determine the best values of the angle between the maser propagation
direction and the magnetic field (). By considering the values of , , and
we were also able to estimate the saturation state of the H2O maser features.
2.2 6.7 GHz MERLIN data
To detect the polarization of the CH3OH maser emission at 6668.518 MHz () we observed
NGC7538-IRS1 with six of the MERLIN333MERLIN is operated by the University of Manchester as a National Facility of the
Science and Technology Facilities Council telescopes in full polarization spectral mode on December 28, 2005. The observation
time was h, including overheads on the calibrators 2300+638, 3C84 and 3C286. We used a 250 kHz bandwidth (km s-1)
with 256 channels (velocity resolution km s-1) centered on the source velocity km s-1. For
calibration purposes, the continuum calibrators were observed with the 16 MHz wide-band mode. Both 3C84 and 3C286 were also
observed in the narrow-band spectral line configuration and were used to determine the flux and bandpass calibration solutions.
The data were edited and calibrated using AIPS. The calibrator 3C84 was used to determine the phase offset between the wide- and
narrow-band set-up.
Instrumental feed polarization was determined using the unpolarized calibrator 3C84, and the polarization angle was calibrated
using 3C286. Using one of the strongest isolated maser features, we were able to self-calibrate the data in right- and left-circular
polarization separately. After calibration, the antenna contributions were reweighed according to their sensitivity at 5 GHz and
their individual efficiency. Stokes I, Q, U data cubes (5.12 arcsec 5.12 arcsec, rms mJy beam-1)
were created (beam-size 47 mas 34 mas).
The CH3OH maser features were also identified through the identification process mentioned above (Surcis et al. sur11 (2011)).
If the program finds a group of maser spots that are not exactly spatially coincident but show a continuum linear distribution with a
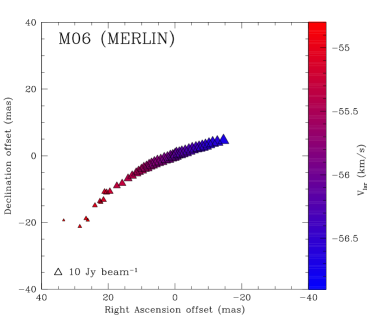
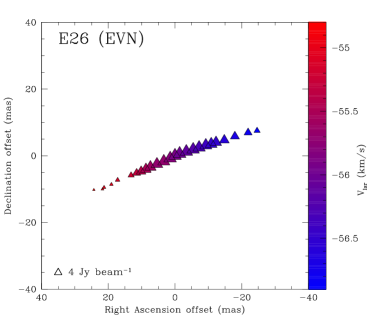
clear velocity gradient, we report in the corresponding table only the brightest maser spot of the group (e.g. maser feature M06).
We were unable to identify weak CH3OH maser features ( Jy beam-1) close to the brightest ones because of the dynamic range limits.
To determine , , and , we adapted the code used
for 22 GHz H2O masers to model the 6.7 GHz CH3OH masers, which has successfully been used by Vlemmings et al.
(vle10 (2010)) for the CH3OH masers in Cepheus A. We modeled the observed linear polarized and total intensity CH3OH maser feature
spectra by gridding from 0.5 to 2.6 km s-1, in steps of 0.05 km s-1, by using a least-squares fitting routine.
2.3 6.7 GHz EVN data
NGC7538-IRS1 was also observed at 6.7 GHz (CH3OH) in full polarization spectral mode with nine of the EVN444The European VLBI Network
is a joint facility of European, Chinese, South African and other radio astronomy institutes funded by their national research councils.
antennas (Jodrell2, Cambridge, Efelsberg, Onsala, Medicina, Torun, Noto, Westerbork, and the new joint antenna Yebes-40 m), for a total
observation time of 5 h on November 3, 2009 (program code ES063B). The bandwidth was 2 MHz, providing
a velocity range of km s-1. The data were correlated using 1024 channels to generate all four polarization
combinations (RR, LL, RL, LR) with a spectral resolution of 1.9 kHz (0.1 km s-1).
The data were edited and calibrated using AIPS. The bandpass, the delay, the phase, and the polarization calibration were
performed on the calibrator 3C286. Fringe-fitting and self-calibration were performed on the brightest maser feature (E26 in
Table 3). Then we imaged the I, Q, U, RR, and LL cubes (2 arcsec 2 arcsec,
rms mJy beam-1) using the AIPS task IMAGR (beam-size 6.3 mas 4.9 mas). The Q and U cubes were combined
to produce cubes of polarized intensity and polarization angle.
In this case, because the dynamic range of our EVN observations was better than that of MERLIN observations, we were able to
identify CH3OH maser features with a peak flux density of less than 1 Jy beam-1 with the “maser finder” program. The maser emission was fitted by
using the adapted code for CH3OH masers, but with a grid of ranging from 0.5 to 1.95 km s-1.
We were able to determine the Zeeman-splitting from the
cross-correlation between the RR and LL spectra, which was successfully used by Surcis et al. (sur09 (2009)) for the polarized CH3OH maser emission detected in W75N. The dynamic range of the RR and LL cubes decreases close to the strongest maser emission of each
group because of the residual calibration errors. As a result, we were not able to determine the
Zeeman-splitting () for the features with a peak flux density of less than 1.8 Jy beam-1.
| (1) | (2) | (3) | (4) | (5) | (6) | (7) | (8) | (9) | (10) | (11) | (12) |
| Maser | group | RAa | Deca | Peak flux | |||||||
| offset | offset | Density(I) | |||||||||
| (mas) | (mas) | (Jy beam-1) | (km s-1) | (km s-1) | (%) | (∘) | (km s-1) | (log K sr) | (∘) | ||
| M01 | D | -256 | -275 | -60.68 | 0.86 | ||||||
| M02 | A | -115 | 47 | -55.94 | 0.45 | ||||||
| M03 | A | -74 | 22 | -57.30 | 0.36 | ||||||
| M04 | C | -73 | -215 | -61.38 | 0.37 | ||||||
| M05 | C | -28 | -222 | -60.81 | 0.85 | ||||||
| M06 | A | 0 | 0 | -56.07 | 0.63 | ||||||
| M07 | B | 59 | -287 | -58.44 | 0.52 | ||||||
| M08 | B | 98 | -186 | -58.70 | 0.54 | ||||||
| M09 | E | 87 | -559 | -59.05 | 0.31 | ||||||
| M10 | E | 125 | -546 | -58.83 | 0.42 | ||||||
| M11 | B | 127 | -207 | -57.61 | 0.70 | ||||||
| M12 | E | 154 | -503 | -58.09 | 0.30 | ||||||
| M13 | B | 159 | -157 | -56.33 | 0.40 |
Notes. (a) The absolute reference position is and . (b) The best-fitting results obtained by using a model based on the radiative transfer theory of CH3OH masers for s-1 (Vlemmings et al. vle10 (2010)). The errors were determined by analyzing the full probability distribution function. (c)The angle between the magnetic field and the maser propagation direction is determined by using the observed and the fitted emerging brightness temperature. The errors were determined by analyzing the full probability distribution function. (d)Because of the low angular resolution the code is able to give an upper limit for and a lower limit for .
3 Results
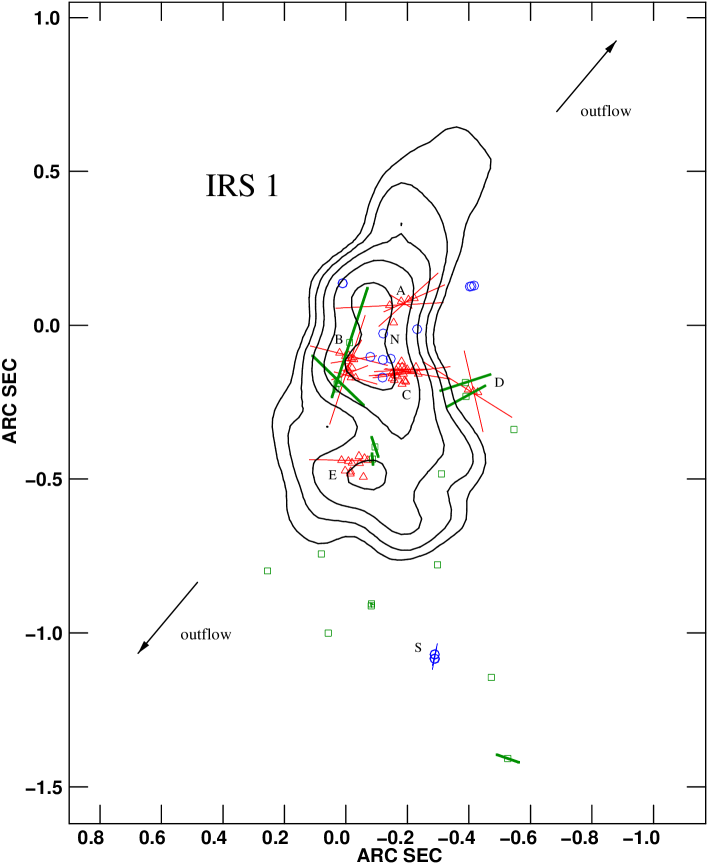
In Fig. 1 we show the H2O (blue circles) and CH3OH maser features (red triangles) detected by us and superimposed on the 2 cm continuum contour map of NGC7538-IRS1 observed with the VLA in 1986 (Franco-Hernández & Rodríguez 2004). Because the continuum observations were made 20.3 yr before our observations, we have shifted the continuum map by -50 mas in both directions according to the proper motion, mas yr-1 and mas yr-1, measured by Moscadelli et al. (mos09 (2009)). The direction of the large-scale molecular bipolar outflow is also shown. Because we did not have absolute positions of the H2O maser features, we estimated the offset of one common H2O maser feature detected both in the VLA observations of Galvàn-Madrid et al. (gal10 (2010)) and by us (features M3 and W01, respectively). All positions of the H2O maser features were shifted according to this offset. We did indeed have absolute positions of the CH3OH maser features at low-angular resolution, but not at high-angular resolution. Hence, to overlay these maser features to the continuum, we matched the brightest CH3OH maser feature detected with the EVN and the brightest one detected with MERLIN (M06, absolute position and ). All CH3OH maser features were shifted accordingly. Thus, based on the resolution of the VLA H2O and MERLIN CH3OH maser observations the uncertainties of H2O and CH3OH maser features absolute positions are 50 mas (Galvàn-Madrid et al. gal10 (2010)) and 10 mas, respectively.

3.1 H2O masers
We detected 17 22-GHz H2O maser features with the VLBA associated to NGC7538-IRS1 (named W01-W17 in Table 1). No
H2O maser emission with a peak flux density () less than 0.13 Jy beam-1 is detected even though our channel rms is significantly less.
The H2O maser features can be divided into two groups, N and S, that are composed of 11 and 6 H2O maser
features, respectively.
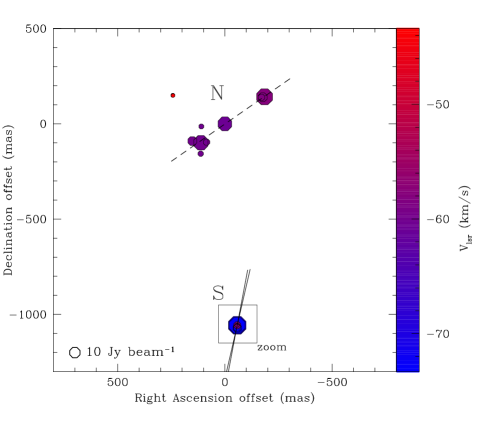
Group N is located at the center of the continuum emission and it shows a linear distribution with a position angle of
–52∘ (see Fig. 2). The local standard-of-rest velocities () of group N are between km s-1 and km s-1.
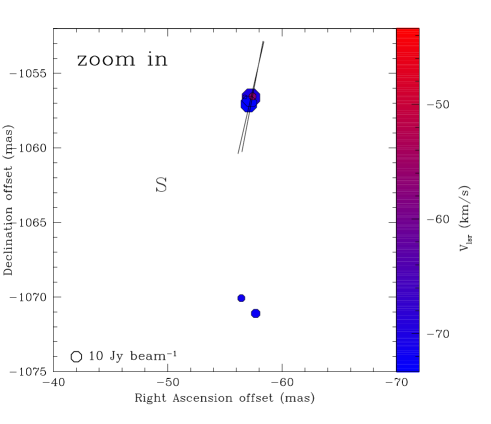
Excluding W16 and W17, the range is km s-1 km s-1. Group S is located about 1′′ southward from
group N and its velocity range is km s-1 km s-1, which is more blue-shifted.
Linear polarization is detected in 2 H2O maser features that belong to group S (W06 and W07). Their linear
polarization fraction (column 7 of Table 1) is % and the weighted linear polarization angles is
∘. The full radiative transfer method code for H2O masers was
able to fit the feature W07 and the results are given in column 10 and 11 of Table 1 and in
Fig. 3. The emerging brightness temperature and the intrinsic thermal linewidth are
K sr and 3.4 km s-1, respectively. By considering and the observed we determined
∘, indicating that the maser is operating in a regime where the magnetic field is close to perpendicular
to the propagation of the maser radiation. No significant circular polarization emission is detected.

| (1) | (2) | (3) | (4) | (5) | (6) | (7) | (8) | (9) | (10) | (11) | (12) | (13) |
| Maser | group | RA | Dec | Peak flux | ||||||||
| offset | offset | Density(I) | ||||||||||
| (mas) | (mas) | (Jy beam-1) | (km s-1) | (km s-1) | (%) | (∘) | (km s-1) | (log K sr) | (m s-1) | (∘) | ||
| E01 | D | -286.910 | -282.502 | -60.40 | 0.12 | |||||||
| E02 | D | -272.725 | -279.037 | -60.49 | 0.21 | |||||||
| E03d | D | -255.344 | -273.992 | -60.58 | 0.24 | |||||||
| E04 | C | -93.660 | -222.357 | -61.28 | 0.24 | |||||||
| E05 | C | -86.171 | -200.790 | -61.28 | 0.20 | |||||||
| E06 | A | -80.377 | 22.786 | -57.24 | 0.20 | |||||||
| E07 | C | -74.392 | -213.730 | -61.28 | 0.29 | |||||||
| E08 | A | -61.547 | 18.163 | -57.15 | 0.23 | |||||||
| E09 | C | -57.174 | -207.658 | -61.46 | 0.27 | |||||||
| E10 | C | -52.938 | -248.180 | -60.84 | 0.31 | |||||||
| E11 | C | -49.085 | -205.700 | -60.75 | 1.08 | |||||||
| E12 | C | -48.483 | -245.093 | -60.67 | 0.28 | |||||||
| E13 | C | -44.930 | -222.357 | -60.84 | 0.25 | |||||||
| E14 | C | -41.350 | -198.801 | -61.02 | 0.49 | |||||||
| E15 | C | -40.421 | -255.891 | -60.84 | 0.33 | |||||||
| E16 | C | -39.082 | -181.780 | -60.75 | 0.18 | |||||||
| E17 | A | -37.661 | 12.650 | -56.80 | 0.33 | |||||||
| E18 | C | -27.986 | -199.362 | -60.75 | 0.19 | |||||||
| E19 | C | -25.963 | -230.701 | -60.84 | 0.26 | |||||||
| E20 | C | -22.083 | -211.354 | -60.58 | 0.27 | |||||||
| E21 | C | -18.147 | -226.401 | -60.75 | 0.22 | |||||||
| E22 | C | -15.769 | -242.950 | -60.84 | 0.25 | |||||||
| E23 | A | -13.091 | -56.523 | -55.75 | 0.26 | |||||||
| E24 | C | -8.172 | -220.826 | -60.67 | 0.29 | |||||||
| E25 | C | -7.762 | -238.071 | -60.84 | 0.32 | |||||||
| E26d | A | 0 | 0 | -55.92 | 0.33 | |||||||
| E27 | E | 71.113 | -503.039 | -58.56 | 0.12 | |||||||
| E28 | E | 81.252 | -497.234 | -58.56 | 0.27 | |||||||
| E29 | E | 85.297 | -557.914 | -58.91 | 0.27 | |||||||
| E30 | E | 97.923 | -513.329 | -58.38 | 0.18 | |||||||
| E31 | E | 99.399 | -489.943 | -58.38 | 0.21 | |||||||
| E32 | B | 110.386 | -235.856 | -57.77 | 0.31 | |||||||
| E33 | B | 116.016 | -175.760 | -57.86 | 0.30 | |||||||
| E34 | B | 121.782 | -203.613 | -57.42 | 0.55 | |||||||
| E35 | E | 122.083 | -511.884 | -58.21 | 0.22 | |||||||
| E36 | B | 123.859 | -173.165 | -57.59 | 0.32 | |||||||
| E37 | B | 125.062 | -233.976 | -57.07 | 0.28 | |||||||
| E38 | E | 126.893 | -540.110 | -58.12 | 0.21 | |||||||
| E39 | E | 127.303 | -546.631 | -58.73 | 0.26 | |||||||
| E40 | B | 129.927 | -218.961 | -57.51 | 0.37 | |||||||
| E41d | B | 132.550 | -163.392 | -57.24 | 0.34 | |||||||
| E42 | E | 134.190 | -506.261 | -58.12 | 0.20 | |||||||
| E43d | B | 137.196 | -209.274 | -57.24 | 0.37 | |||||||
| E44 | B | 137.552 | -181.682 | -57.33 | 0.24 | |||||||
| E45 | B | 143.509 | -164.852 | -56.72 | 0.32 | |||||||
| E46 | E | 144.083 | -537.047 | -58.73 | 0.28 | |||||||
| E47 | B | 149.112 | -203.584 | -57.42 | 0.27 | |||||||
| E48 | E | 156.163 | -503.223 | -58.03 | 0.24 | |||||||
| E49 | B | 162.558 | -154.095 | -56.19 | 0.16 |
Notes. (a) The best-fitting results obtained by using a model based on the radiative transfer theory of CH3OH masers for s-1 (Vlemmings et al. vle10 (2010)). The errors were determined by analyzing the full probability distribution function. For s-1 (Minier et al. min02 (2002)) has to be adjusted by adding . (b) The Zeeman-splittings are determined from the cross-correlation between the RR and LL spectra. (c)The angle between the magnetic field and the maser propagation direction is determined by using the observed and the fitted emerging brightness temperature. The errors were determined by analyzing the full probability distribution function. (d)Because of the degree of the saturation of these H2O masers, is underestimated, and are overestimated.
3.2 CH3OH masers
We detected 13 6.7-GHz CH3OH maser features with the MERLIN telescope (named M01-M13 in Table 2) that appear to be
composed of 49 features when observed with the EVN resolution (named E01-E49 in Table 3). Including the more
sensitive EVN observations, we detect no CH3OH maser emission below Jy beam-1. Note that as defined in Sect. 2, we indicate
with the term maser feature the brightest maser spot among a series of maser spots that either show a spatial
coincidence and consecutive velocities or show a clear velocity gradient along a continuum linear structure.
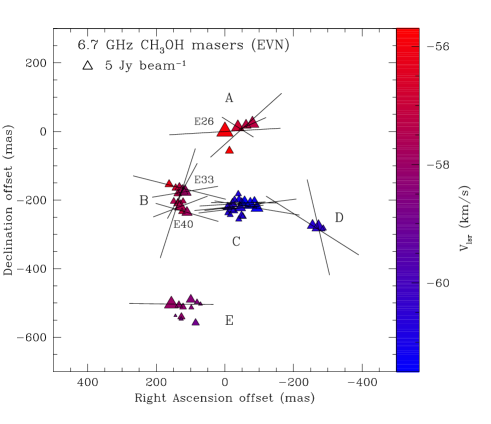
In the left panel of Fig. 4 we show the contours of the CH3OH maser structures detected with MERLIN and in the
right panel the distribution of the CH3OH maser features detected with the EVN. The CH3OH maser features distribution at
high angular resolution match the CH3OH maser emission detected with MERLIN four years before perfectly.
Following the naming convention adopted by Minier et al. (min00 (2000)), they can be divided into five groups (from A
to E).
Note that each group is composed of several maser features, each of which indicates a series of maser spots.
Group A, which is composed of five maser features (3 at MERLIN resolution) and hosts the brightest maser feature of the region
(M06 and E26, respectively), shows a linear distribution. If we consider all maser spots of
the maser feature M06 (top-left panel of Fig. 5), we are able to measure a velocity gradient of about
0.02 km s-1 AU-1 from northwest to southeast, which is confirmed by considering the matching maser spots of E26 (EVN, top-right
panel of Fig. 5).
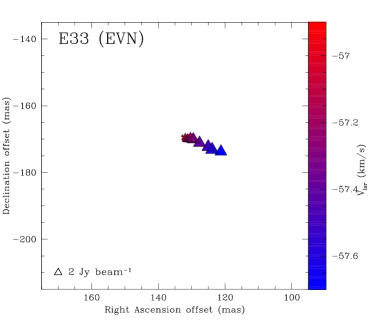
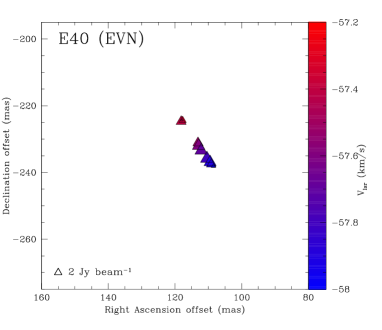
Group B is resolved into 12 CH3OH maser features (four at MERLIN resolution). The spots of the features E33 and
E40 of this group show a velocity gradient similar to that of E26 but from southwest to northeast (bottom panels of
Fig. 5). No CH3OH maser features of group B detected with MERLIN show a velocity gradient. The CH3OH maser groups C, D,
and E are composed of 18, 3, and 11 maser features, respectively. While groups C and D are located close to the central peak of the
continuum emission, group E is located about 300 mas southward. The velocities of groups C and D are more blue-shifted
( km s-1 km s-1) than those of groups A, B, and E ( km s-1 km s-1).
We detected linear polarization in 10 and 20 CH3OH maser features with MERLIN and EVN, respectively. The features of
group D show the highest linear polarization fraction of the region (column 8 of Tables 2 and 3), though
the observations at higher angular resolution revealed E43 to be the feature with the highest linear polarization fraction
(6.2%). Because the EVN provides an angular resolution eight times better than MERLIN and because we also have a higher dynamic range, we will,
for the interpretation of the magnetic field, only use the linear polarization vectors of the
maser features detected with the EVN. The groups A, C, and E have weighted linear polarization vectors
almost oriented east-west, with angles ∘∘, ∘∘, and ∘∘, respectively. The weighted
linear polarization angles for the other two groups are ∘∘ and
∘∘.

The full radiative transfer method code for CH3OH masers was able to fit 7 (MERLIN) and 20 (EVN) CH3OH maser features, the results are given in columns 10 and 11 of Tables 2 and 3. Considering the high angular resolution observations, the weighted intrinsic maser linewidth and the weighted emerging brightness temperature are km s-1 and K sr. As an example, the -contours for feature E33 are reported In Fig. 6.
| Group | EVN | MERLIN | |||||||
| (∘) | (km s-1) | (K sr) | (∘) | (∘) | (km s-1) | (K sr) | (∘) | ||
| A | 1.2a | b | |||||||
| B | 0.9a | b | - | ||||||
| C | |||||||||
| D | 0.6a | b | - | ||||||
| E | |||||||||
Notes. (a) Only the highest value has been taken into account. (b) Only the lowest value has been taken into account.
The fit for the CH3OH maser features detected with
MERLIN gives values both for and for consistent or higher than
those detected with the EVN (see Table 4). However, owing to the lower angular resolution of MERLIN and the occurrence of strong
velocity gradients, the fits are strongly affected by line blending. As for the H2O maser features,
we are able to determine the values (column 12 and 13 of Tables 2 and 3, respectively) from
and . The weighted value for the whole region is
∘, which is almost constant in all groups.
Only for group E we determine a lower value, i.e.,
∘.
The Zeeman-splitting () in m s-1 determined from the cross-correlation between the RR and LL spectra of the
CH3OH maser features detected with the EVN is reported in column 12 of Table 3. Note that the cross-correlation method is
dynamic-range sensitive, therefore we are able to measure only for those features that show a very high dynamic range.
It has been impossible to obtain measurements from MERLIN data because of the insufficient dynamic range.
4 Discussion
4.1 Comparing CH3OH spectra at different resolution
Vlemmings (vle08 (2008)) observed the CH3OH masers with the 100-m Effelsberg telescope
in November 2007, i.e. two years later
than our MERLIN observations and two years before our EVN observations. A comparison between the single-dish and MERLIN fluxes reveals
only a difference of 10% across the whole spectra. This slight difference can be explained by the different resolution of the two
instruments and flux calibration uncertainties in the Effelsberg observations ( 10%, Vlemmings vle08 (2008)).
This means that no significant changes occurred between the two epochs and there is no indication of a core/halo structure of the maser features
(hereafter simply called masers) at scales of
100 AU such as described for a sample of CH3OH maser sources by Pandian et al. (pan11 (2011)).

In Fig. 7 we show the total flux spectra of the CH3OH masers detected with MERLIN and the EVN in 2005 and 2009,
respectively. Generally, the EVN resolved out between 60% and 90% of the flux when 6.7-GHz CH3OH masers were observed with both these
instruments (e.g., Minier et al. min02 (2002); Bartkiewicz et al. bar09 (2009); Torstensson et al. tor11 (2011)). This
indicates the presence of emission structures on scales that are resolved by the EVN, i.e. a halo structure that surrounds the core of the masers.
Moreover, if the maser spots do not have a compact core, they would not be detected in the EVN observations
(Pandian et al. pan11 (2011)). Although in our observations the EVN resolves out about 50% of the flux of group C ( km s-1),
the majority of the flux appears to be recovered across the entire CH3OH maser spectrum. This suggests that the halo structure is absent,
except in some masers of group C and likely in E26 of group A, and that the masers only contain a compact core.
Moreover, the non-detection of the maser M07 with the EVN might indicate the absence of the compact core in this maser.
Minier et al. (min02 (2002)) observed the 6.7-GHz CH3OH masers with five antennas of the EVN. The authors determined the size of the
halo () and of the core () of the brightest masers of groups A and C by Gaussian fitting of the visibility amplitudes.
For the brightest maser of group A the authors determined mas (13 AU at 2.65 kpc) and mas (8 AU), and
mas (45 AU), and mas (13 AU) were measured for the brightest maser of group C. The Gaussian fit of E26
and E07 gives a size of 5 mas and 6 mas respectively, indicating that the EVN resolves out the halo structure observed by Minier et al.
(min02 (2002)) and that we observe only the core of these two masers.
We suggest that the absence of a halo structure in most of the CH3OH masers could be caused by the amplification of the
strong continuum emission shown in Fig. 1. This would argue that almost all CH3OH masers are on the front-side of this
source. Similar arguments were used in the interpretation of the structure of Cepheus A
(Torstensson et al. tor11 (2011)).
4.2 H2O and CH3OH maser properties
Before discussing the polarization analysis of the masers in NGC7538-IRS1, we need to consider the degree of the maser saturation. As explained in detail by Vlemmings et al. (vle10 (2010)) and Surcis et al. (sur11 (2011)), when the full radiative transfer method code is applied to a saturated maser, the code gives a lower limit for and an upper limit for . The masers are unsaturated when and fully saturated when , where R is the stimulated emission rate given by
| (1) |
Here is the Einstein coefficient for the maser transition, which for H2O masers is taken to be equal to
(Goldreich & Keeley gol72 (1972)) and for the CH3OH masers is (Vlemmings et al. vle10 (2010)),
and are the Boltzmann and Planck constants, respectively, and the maser frequency. From
we can estimate an upper limit for the emerging brightness temperature below which the masers can be considered unsaturated.
The limits are K sr and
K sr for H2O and CH3OH masers, respectively. Consequently, only four CH3OH masers are partly saturated; i.e., E03, E26, E41 and E43 (Table 3). Because the model emerging brightness temperature
scales linearly with , the ratio is independent of the value of .
The of the saturated CH3OH masers are close to implying
that the maser lines are rebroadened as expected when the maser becomes saturated. Furthermore, these four CH3OH masers do also show a high
linear polarization fraction, which again confirms their saturated state (Goldreich et al. gol73 (1973)).
The intrinsic linewidth of the H2O maser W07 is higher than the typical values measured in previous works, i.e.
km s-1 (Surcis et al. sur11 (2011)). This difference might indicate the presence
of a strong turbulent gas with a turbulence velocity of km s-1 or multiple components overlapping.
By comparing the brightness temperature with obtained from the model, we can
estimate the maser beaming angle () for both maser species. We can estimate the brightness temperature () by
considering the equation
| (2) |
where is the flux density, the maser angular size and is a constant factor that includes all constant values, such as the Boltzmann constant, the wavelength, and the proportionality factor obtained for a Gaussian shape by Burns et al. (bur79 (1979)). The values of for H2O and CH3OH masers are
| (3) |
| (4) |
as reported by Surcis et al. (sur11 (2011)) and Surcis et al. (sur09 (2009)), respectively. The H2O maser W07 is unresolved
and . The Gaussian fit
of CH3OH masers detected with the EVN gives a size between 5 and 7 mas, which indicates that all CH3OH masers are
marginally resolved.
In a tubular geometry , where and are the transverse size and length of the tube,
respectively. By assuming approximately the size of the masers, the maser lengths are in the range
cm cm and cm cm for W07 and the CH3OH masers, respectively.
4.3 Magnetic field in NGC7538-IRS 1
4.3.1 CH3OH Zeeman-splitting and magnetic field
We measured 6.7-GHz CH3OH maser Zeeman-splitting ranging from -2.7 m s-1 to +2.7 m s-1. This is 2–3 times larger than was measured with the Effelsberg telescope (Vlemmings vle08 (2008)) as expected when resolving individual masers. From the Zeeman theory we know that the Zeeman-splitting is related to the magnetic field strength along the line of sight () by the equation
| (5) |
where is the Zeeman-splitting in km s-1 and is the Zeeman-splitting coefficient in km s-1 G-1, which strongly depends on the Landé g-factor of the molecular transition. Recently, Vlemmings et al. (vle11 (2011)) found an unfortunate calculation error in the used so far ( km s-1 G-1; e.g., Surcis et al. sur09 (2009), Vlemmings et al. vle10 (2010)), the current best value is found to be one order of magnitude lower ( km s-1 G-1). However, Vlemmings et al. (vle11 (2011)) show that the splitting between the RCP- and LCP-signal still likely originates from the Zeeman theory and not from other non-Zeeman effects. Until careful laboratory measurements of the g-factor appropriate for the 6.7-GHz CH3OH masers are made, we cannot give any exact value for the magnetic field strength. Because there is a linear proportionality between and , we can say that the negative value of the Zeeman-splitting indicates a magnetic field oriented toward the observer and positive away from the observer. However, we can speculatively give a possible range of values for by considering km s-1 G-1 km s-1 G-1, thus mG mG.
4.3.2 Magnetic field orientation
Before discussing the orientation of the magnetic field, we have to evaluate the foreground Faraday rotation (i.e., the rotation caused by the medium between the source and the observer), which is given by
| (6) |
where is the length of the path over which the Faraday rotation occurs, and are respectively the
average electron density and the magnetic field along this path and is the frequency. By assuming the interstellar electron density,
the magnetic field, and the distance are , (Sun et al. sun08 (2008)),
and kpc, respectively,
is estimated to be 0∘ at 22-GHz and 6∘ at 6.7-GHz. At both frequencies the foreground Faraday
rotation is within the errors reported in Tables 1 and 3 thus it should not affect our conclusions.
Because all values are higher than the Van Vleck angle ∘ (Goldreich et al. gol73 (1973)),
the magnetic fields are inferred to be perpendicular to the linear polarization vectors. The magnetic field orientation derived from the H2O masers is ∘, while the five groups of CH3OH masers show orientation angles
∘, ∘, ∘, ∘,
and ∘. However, considering the relatively large errors in column 13 of Table 3, we cannot
rule out that the actual values are below 55∘, in which case the magnetic field is parallel to the linear polarization
vectors.
Because Hutawarakorn & Cohen (hut03 (2003)) measured the linear polarized emission of the 1.6 and 1.7-GHz OH masers, we can now
compare the orientation of the magnetic field derived from the two maser species (Fig. 1). We have to consider that the Faraday rotation
at the OH maser frequencies is, at the same conditions, larger than at 6.7-GHz. The linear polarization angles of group D show a 90∘ difference w.r.t those of the nearby 1.6-GHz OH masers.
This might be caused either by a 90∘–flip phenomenon or by the Faraday rotation if the masers are deeply located in a strong ionized gas.
Most of the OH masers are likely to be Zeeman -components, therefore the magnetic field is perpendicular to the
linear polarization vectors. Considering the large errors of , the orientation of the magnetic fields of group B and E are
consistent with those derived from the nearby 1.6-GHz OH masers (Hutawarakorn & Cohen hut03 (2003)). In particular, the linear polarization
vector of E43, which shows the highest linear polarization fraction, is perfectly aligned with feature 2 of the 1665 MHz OH maser
(Hutawarakorn & Cohen hut03 (2003)). Unless the Faraday rotation is 180∘, the consistence of the magnetic field orientation indicates that
the Faraday rotation at OH maser frequency is low.
4.3.3 The role of the magnetic field
The importance of the magnetic field in the region can be estimated by evaluating the ratio between thermal and magnetic energies (). If , the magnetic field dominates the energies in the high-density protostellar environment. The factor is given by
| (7) |
where is the Alfvénic Mach number and is the sonic Mach number, which in formula are
| (8) |
Here is the Alfvén velocity and is the sound velocity, and , the turbulence velocity, can be estimated using . By considering a mass and the relation between the velocity and the temperature of a gas, we can write and in terms of , , and the kinetic temperature of the gas
| (9) |
| (10) |
So we get
| (11) |
which, considering Eq. 5 and , can thus be written as
| (12) |
By assuming , K, which are the typical values in the CH3OH masing region, the weighted values for the unsaturated masers of the angle 78∘, and Zeeman-splittings m s-1, we obtain
| (13) |
Although the value of is still uncertain, we can expect that this must be neither higher than the old value ( km s-1 G-1, Vlemmings vle08 (2008)) nor lower than the new value ( km s-1 G-1, Vlemmings et al. vle11 (2011)). Therefore, it is reasonable that is between and . Consequently the magnetic field is dynamically important in this massive star-forming region.
4.4 Structure of NGC7538-IRS 1
Recently, large-scale elliptical configurations have been detected in significant CH3OH masers around high-mass protostars. These masers
are thought to trace molecular rings (e.g., Bartkiewicz et al. bar09 (2009)). However, most of these rings do not show signs of rotation,
but instead the radial motions dominate, indicating that the masers are instead tracing infalling gas in the interface between
the torus and the flow, e.g. Cepheus A HW2
(Torstensson et al. tor11 (2011); Vlemmings et al. vle10 (2010)). In this light it is legitimate to reconsider whether the masers in
NGC7538-IRS 1 could trace similar gas.
In this work we have observed velocity gradients in three CH3OH masers, i.e., E26, E33, and E40. Whereas the velocity gradient of
E26 has already been observed by other authors (e.g., Minier et al. min98 (1998); Pestalozzi et al. pes04 (2004)), those of masers
E33 and E40 have not been reported so far (Fig. 5). All velocity gradients of E26, E33, and E40 are equal to
0.02 km s-1 AU-1. Considering the orientation of the linear distribution of the maser spots of E26, E33, and E40, we find that all of them
seem to point toward a common center. This suggests that E26, E33, and E40 are likely tracing a gas with a radial motion, probably consistent
with the interface of the torus and infalling gas. Consequently the maser spots of E26 are likely not tracing a Keplerian disk as proposed by
Pestalozzi et al. (pes04 (2004)). The CH3OH masers of groups A, B, C, and D show a cone-shape distribution that opens to the north-west. This
seems to indicate that we are looking at a regular structure, for instance the inner part of a torus. Klaassen et al. (kla09 (2009)) detected
an almost face-on 5300 AU-torus
perpendicular to the outflow with a clockwise rotation motion. If this torus is on the same plane of the disk supposed by
De Buizer & Minier (bui05 (2005)), then its inclination angle must be i=32∘. By keeping in mind these new
results, we can suppose that the CH3OH masers of groups A, B, and C are tracing the surface of the inner torus, possibly where
the infall reaches the rotating structure.
The masers of groups D and E trace the gas slightly farther out on the torus. In particular, group A is
located to the opposite side of the torus w.r.t. the other three maser groups.
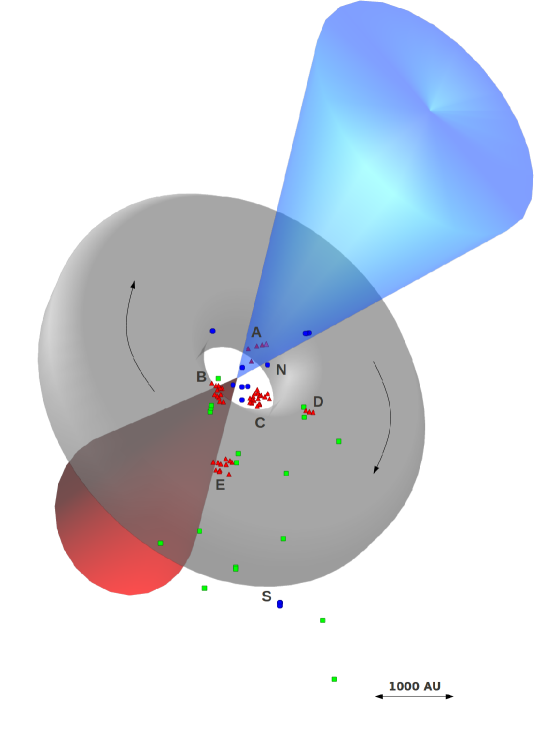
In Fig. 8 a three-dimensional sketch of the region as described above is shown.
The outflow sketched here is a simplified representation of the chaotic and complex multi-outflows structure observed toward NGC7538 and
in particular around IRS-1 (e.g., Qiu et al. qiu11 (2011); Klaassen et al. kla11 (2011)).
In this scenario the H2O masers of group N are located parallel to the edges of the outflow, which show a blue-shifted
part northwestern and a red-shifted part southeastern (e.g., Kameya et al. kam89 (1989); Hutawarakorn & Cohen hut03 (2003)).
In this case the H2O masers can be pumped by a shock caused by the interaction of the outflow with the infalling gas. The most
southern H2O masers, W06 and W07, might be associated either with the red-shifted part of the outflow or most likely
with another source, as also
suggested by the different orientation of the magnetic field in that region. Moreover, the OH masers located southward (Hutawarakorn &
Cohen hut03 (2003)) might be pumped by the red-shifted part of the high-velocity outflow and those located westward by the blue-shifted
part.
This scenario is further supported by the similarity between the torus and outflow velocities and that of the three maser species.
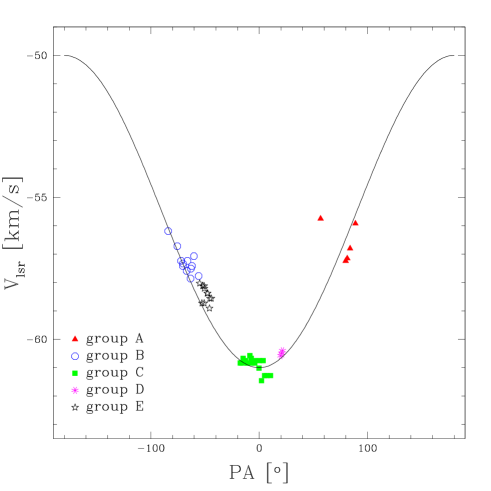
In Fig. 9 we plot the CH3OH maser velocities as a function of the position angle (PA) along the torus. To determine the
PA of each individual CH3OH maser, we consider that every maser lies on an own circle that has the same orientation and inclination angle of the torus
with the center located at the origin of the sketched outflow in Fig 8. Moreover, we plot in Fig. 9 an empirical function
(solid line) based on the orientation and on the velocity field of the torus observed by Klaassen et al. (kla09 (2009)), i.e. the PA and velocity
of all the points of a circle that has the same size, orientation, and inclination of the torus.
The maser velocities perfectly match the non-Keplerian velocity profile of the torus that is rotating clockwise (Klaassen et al.
kla09 (2009)). This indicates that the CH3OH masers are likely related to the torus structure.
Groups A and E appear to be systematically blue- and red-shifted w.r.t the torus velocities respectively, supporting the suggestion of infall
motion (on the order of 1 km s-1) along the line of sight.
The velocities of the blue- and red-shifted part of the outflow are km s-1 and
km s-1 (Kameya et al. kam89 (1989)). The mean velocities of the H2O masers of group N and S
are km s-1, excluding the masers W16 and W17, and km s-1. While
again suggests that these masers might be associated with another source, the difference between
and indicates that the H2O masers are
tracing the gas surrounding and being entrained by the outflow. The 1.6 and 1.7-GHz OH masers show
velocity ranges km s-1 km s-1 that agree well with and , which might indicate an
association with the torus rather than with the CO-outflow. The presence of OH and CH3OH masers in the same environments,
also suggested by the linear polarization vectors of the two maser species (see Sect. 4.3.2), is in contrast with the excitation
model of Cragg et al. (grag02 (2002)), which predicts the inhibition of the 6.7-GHz CH3OH masers when 1.6-GHz OH masers arise.
The orientation of the magnetic field derived by the linear polarized emission of the CH3OH masers at high
angular resolution matches the scenario we presented above. Most likely the magnetic field is perpendicular to the linear polarization
vectors for most of
the CH3OH maser features, but for group E the magnetic field is instead parallel to the linear polarization vectors (see Sect. 4.3.1).
This is also suggested by considering the linear polarization vectors of the OH masers (see Sect. 4.3.2). In this case the magnetic
field is situated on the two surfaces of the torus, with a counterclockwise direction on the top surface. This interpretation is consistent
with the signs of the magnetic field strengths determined from the Zeeman-splitting measurements of the CH3OH masers and OH masers, which show
negative strength ( mG, Hutawarakorn & Cohen hut03 (2003)) toward the region were groups B and E arises and positive toward groups
A and D.
Even if the CH3OH masers are not tracing the Keplerian-disk reported by Pestalozzi et al. (pes04 (2004)), the presence of a smaller
disk is not ruled out. In the scenario proposed here, it would be located within the torus. Accordingly, we argue that a possible answer to the question
about the morphology of NGC7538-IRS 1 is that the CH3OH masers are tracing a gas close to the torus that is falling toward the connection
region between the torus and the disk as was observed in other protostars (e.g., Vlemmings et al. vle10 (2010)).
The new scenario described in this paper is determined by considering the entire CH3OH maser region
and not just the masers of group A. Consequently, this scenario is different both from “Scenario A” and from “Scenario B”
suggested by Kraus et al. (kra06 (2006)), who considered the results obtained by De Buizer & Minier (bui05 (2005)) and by Pestalozzi et al.
(pes04 (2004)) for the CH3OH masers of group A, respectively. In “Scenario A” the CH3OH masers of group A might resemble either clumps in
the cavity of the outflow or recent ejecta from the outflow, while in “Scenario B” group A trace a disk and the authors proposed a jet precession
model to explain the asymmetry of the NIR emission. However, in our scenario the asymmetry of the NIR emission might reflect the innermost
walls of an outflow cavity as explained in “Scenario A”, but with the masers that are tracing an infalling gas rather than the outflow cavity or
a recent ejecta from the outflow.
Two questions remain: what is the radio continuum emission shown in Fig. 1? How can this scenario
be consistent with the changing of the position angle of the outflow reported in Campbell (cam84 (1984))? De Buizer & Minier
(bui05 (2005)) argue that the radio continuum emission is consistent with radio emission arising from a photoevaporated disk wind and Kameya et al.
(kam89 (1989)) suggested that the rotation of the outflow stems from a disk precession.
5 Conclusions
The massive star-forming region NGC7538-IRS 1 has been observed at 22-GHz in full polarization spectral mode with the VLBA
and at 6.7-GHz with the EVN and MERLIN to detect linear and circular polarization emission from H2O and CH3OH masers,
respectively. We detected 17 H2O masers and 49 CH3OH masers at high angular resolution. We have measured
Zeeman-splitting for three CH3OH masers ranging from -2.7 m s-1 to +2.7 m s-1. No significant magnetic field strength has been measured
from the H2O masers. Furthermore, we have also shown that the masers of NGC7538-IRS 1 are all consistent with a torus-outflow
scenario. Here the CH3OH masers are tracing the interface between the infall and the large-scale torus,
and the H2O masers are related to the blue-shifted part of the outflow. The H2O masers of the southern group are thought to be associated
with another source. The magnetic field is situated on the two surfaces of the torus with a counterclockwise direction on the top
surface.
Acknowledgments. We wish to thank an anonymous referee for making useful suggestions that have improved the paper. GS, WHTV, and RMT acknowledge support by the Deutsche Forschungsgemeinschaft (DFG) through the Emmy Noether Reseach grant VL 61/3-1. G.S. and WHTV thank Pamela D. Klaassen for the very useful discussion. G.S. thanks Ramiro Franco-Hernández for kindly providing the VLA continuum image.
References
- (1) Bartkiewicz, A., Szymczak, M., van Langevelde, H.J. et al. 2009, A&A, 502, 155
- (2) Burns, J.O., Owen, F.N., & Rudinick, L. 1979, AJ, 84, 1683
- (3) Campbell, B. 1984, ApJ, 282, L27
- (4) Campbell, B. & Thompson, R. 1984, ApJ, 279, 650
- (5) Cragg, D.M., Sobolev, A.M., & Godfrey, P.D. 2002, MNRAS, 331, 521
- (6) Davis, C.J., Moriarty-Schieven, G., Eislöffel, J. et al. 1998, AJ, 115, 1118
- (7) De Buizer, J.M. & Minier, V. 2005, ApJ, 628, L151
- (8) Franco-Hernández, R. & Rodríguez , L.F. 2004, ApJ, 604, 105
- (9) Galván-Madrid, R., Montes, G., Ramírez, E.A. et al. 2010, ApJ, 713, 423
- (10) Gaume, R.A., Johnston, K.J., Nguyen, H.A. et al. 1991, ApJ, 376, 608
- (11) Gaume, R.A., Goss, W.M., Dickel H.R. et al. 1995, ApJ, 438, 776
- (12) Goldreich, P. & Keeley, D.A., 1972, ApJ, 174, 517
- (13) Goldreich. P., Keeley, D.A., & Kwan, J.Y., 1973, ApJ, 179, 111
- (14) Hoffman, I.M., Goss, W.M., Palmer, P. et al. 2003, ApJ, 598, 1061
- (15) Hutawarakorn, B. & Cohen, R.J. 2003, MNRAS, 345, 175
- (16) Kameya, O., Tatsuhiko, I.H., Hirano, N. et al. 1989, ApJ, 339, 222
- (17) Kemball, A.J., Diamond, P.J. and Cotton, W.D. 1995, A&AS, 110, 383
- (18) Klaassen, P.D., Wilson, C.D., Keto, E.R. et al. 2009, ApJ, 703, 1308
- (19) Klaassen, P.D., Wilson, C.D., Keto, E.R. et al. 2011, arXiv1103.5706K
- (20) Kraus, S., Balega, Y., Elitzur, M. et al. 2006, A&A, 455, 521
- (21) Minier, V., Booth, R.S., and Conway, J.E. 1998, A&A, 336, L5
- (22) Minier, V., Booth, R.S., and Conway, J.E. 2000, A&A, 362, 1093
- (23) Minier, V., Booth, R.S., and Conway, J.E., 2002, A&A, 383, 614
- (24) Momose, M., Tamura, M., Kameya, O. et al. 2001, ApJ, 555, 855
- (25) Moscadelli, L., Reid, M.J., Menten, K.M. et al. 2009, ApJ, 693, 406
- (26) Nedoluha, G.E. & Watson, W.D., 1992, ApJ, 384, 185
- (27) Pandian, J.D., Momjian, E., Xu, Y. et al. 2011, ApJ, 730, 55
- (28) Pestalozzi, M.R., elitzur, M., Conway, J.E. et al. 2004, ApJ, 603, L113
- (29) Puga, E., Marín-Franch, A., Najarro, F. et al. 2010, A&A, 517, 2
- (30) Qiu, Keping; Zhang, Qizhou; Menten, Karl M. 2011, ApJ, 728, 6
- (31) Sandell, G. Goss, W.M., Wright, M. et al. 2009, ApJ, 699, L31
- (32) Scoville, N.Z., Sargent, A.I., Sanders, D.B. et al. 1986, ApJ, 303, 416
- (33) Sun, X. H., Reich, W., Waelkens, A. et al. 2008, A&A, 477, 573
- (34) Surcis, G., Vlemmings, W.H.T., Dodson, R. et al., 2009, A&A, 506, 757 (S09)
- (35) Surcis, G., Vlemmings, W.H.T., Curiel, S. et al. 2011, A&A, 527,48
- (36) Torstensson, K.J.E., van Langevelde, H.J., Vlemmings, W.H.T. et al. 2011, A&A, 526, 38
- (37) Vlemmings, W.H.T., Diamond, P.J., van Langevelde, H.J. et al. 2006a, A&A, 448, 597
- (38) Vlemmings, W.H.T. 2008, A&A, 484, 773
- (39) Vlemmings, W.H.T., Surcis, G., Torstensson, K.J.E. et al. 2010, MNRAS, 404, 134
- (40) Vlemmings, W.H.T., Torres, R.M., & Dodson, R. 2011, A&A, 529, 95
- (41) Wynn-Williams, C.G., Becklin, E.E., & Neugebauer, G. 1974, ApJ, 187, 473