Present address: ]Department of Physics, Pacific Union College, Angwin, CA 94508, USA
Present address: ]Institute of Physics and Astronomy, University of Aarhus, 8000 Aarhus C, Denmark
Present address: ]GSI Helmholtzzentrum für Schwerionenforschung, 64291 Darmstadt, Germany
Present address: ]Laboratorium für Physikalische Chemie, ETH Zürich, 8093 Zurich, Switzerland
Present address: ]Institute of Physics and Astronomy, University of Aarhus, 8000 Aarhus C, Denmark
Work partly performed in visit at ]Laboratoire Aimé–Cotton, Université Paris-Sud, 91405 Orsay Cedex, France
Assignment of resonances in dissociative recombination of HD+ ions: high-resolution measurements compared with accurate computations
Abstract
The collision-energy resolved rate coefficient for dissociative recombination of HD+ ions in the vibrational ground state is measured using the photocathode electron target at the heavy-ion storage ring TSR. Rydberg resonances associated with ro-vibrational excitation of the HD+ core are scanned as a function of the electron collision energy with an instrumental broadening below 1 meV in the low-energy limit. The measurement is compared to calculations using multichannel quantum defect theory, accounting for rotational structure and interactions and considering the six lowest rotational energy levels as initial ionic states. Using thermal equilibrium level populations at 300 K to approximate the experimental conditions, close correspondence between calculated and measured structures is found up to the first vibrational excitation threshold of the cations near 0.24 eV. Detailed assignments, including naturally broadened and overlapping Rydberg resonances, are performed for all structures up to 0.024 eV. Resonances from purely rotational excitation of the ion core are found to have similar strengths as those involving vibrational excitation. A dominant low-energy resonance is assigned to contributions from excited rotational states only. The results indicate strong modifications in the energy dependence of the dissociative recombination rate coefficient through the rotational excitation of the parent ions, and underline the need for studies with rotationally cold species to obtain results reflecting low-temperature ionized media.
pacs:
34.80.Gs, 34.80.Ht, 34.80.LxI Introduction
The dissociative recombination (DR) process Larsson and Orel (2008) of diatomic ions, together with its competing reactions – ro-vibrational excitation and de-excitation as well as, at higher energy, dissociative excitation – plays a decisive role in astrophysical Petrie and Bohme (2007) and planetary Witasse et al. (2008) ionized media, fusion plasma in the divertor region Krasheninnikov (2002) and in most cold plasmas of technological interest Goodings et al. (1979). The hydrogen cation and its isotopologues represent benchmark systems frequently taken up in experimental and theoretical studies. With the technique of merged electron and ion beams Phaneuf et al. (1999), collision studies can be realized under quasi-monoenergetic conditions for detailed comparisons of experiment and theory. This yields collision-energy resolved rate coefficients while, for sensitive comparison to theory, good control is needed over the ro-vibrational excitation of the incident cations. Following first results on H in single-pass merged beams Hus et al. (1988), the infrared active isotopologue HD+ moved into the focus of experiments Forck et al. (1993); Tanabe et al. (1995); Strömholm et al. (1995); Al-Khalili et al. (2003) using the ion-storage ring technique Larsson (1995), where fast ion beams are stored over many seconds and vibrational de-excitation of HD+ is completed within much less than a second Amitay et al. (1998). On H, storage-ring experiments gave access to vibrational de-excitation in electron collisions Krohn et al. (2000); Motapon et al. (2008). Moreover, using special ion sources, the control of the initial states could be much improved in recent experiments Zhaunerchyk et al. (2007); de Ruette (2007); Novotny (2008) on H + . They resulted in accurate state-to-state, energy-resolved rate coefficients whose comparison to advanced theoretical studies Takagi (2002); Motapon et al. (2008) is underway.
Studies on the system HD+ + have reached a high level of accuracy. Storage-ring experiments were compared to detailed predictions Schneider et al. (1997); Takagi et al. (2009) from multichannel quantum defect theory (MQDT) that addressed in particular the dependence of the rate coefficient on the rotational excitation of the ion. The energy-resolved DR rate coefficient Al-Khalili et al. (2003) and rotational effects in the resonant collision processes Novotny et al. (2008) were experimentally investigated. Moreover, experimental and theoretical results were compared for the related process of rotational de-excitation in low-energy electron collisions Shafir et al. (2009).
The study presented here on the DR reaction
| (1) |
is motivated by the large improvement of the experimental energy resolution achieved by using a photocathode electron beam Orlov et al. (2004) for merged-beams experiments Wolf et al. (2009), in which electron temperatures below 1 meV are reached. As a function of the collision energy, scanned with high resolution, the DR rate coefficient displays a rich structure of resonances, caused by resonant capture of the incident electron into Rydberg states on a ro-vibrationally excited HD+ core before the dissociation of the recombined system into the channels given by Eq. (1). These measurements will be presented together with a detailed comparison to state-by-state theoretical calculations of the DR rate coefficient by the MQDT method with the goal to assign the dominant resonance structures. The assignment provides a highly sensitive test for the quality of the molecular data – potential energy surfaces and mutual couplings – and for the theoretical approach to account for the underlying mechanisms and interactions.
The setup allowing our current measurements is described in Sec. II. Section III presents our experimental results. The main steps in the MQDT computation of the cross section are reviewed in Sec. IV, and the procedure of resonance assignment is described in Sec. V. A detailed comparison between measurements and computations is performed in Sec. VI.
II Experimental setup
The experiment was performed in the heavy ion storage ring TSR at the Max Planck Institute for Nuclear Physics in Heidelberg, Germany. HD+ ions from a Penning source were accelerated in a radiofrequency quadrupole accelerator and a linear rf accelerator to a final energy 5.3 MeV, injected into the storage ring within 30 s, and stored for up to 10 s before their replacement by a new injection. Along their closed orbit with a circumference of 55.4 m, the residual gas pressure is below 110-10 mbar. As in previous experiments Lestinsky et al. (2008) at this facility, the ions were merged on each turn in the ring with collinear, velocity-matched or slightly velocity-detuned electron beams of 1.5 m length in two straight sections of the TSR: the electron cooler Steck et al. (1990); Pastuszka et al. (1996); Schmitt (1999), and the electron target section (ETS) Sprenger et al. (2004).
The electron cooler was used to compress the phase-space density of the injected ion beam within the first 1–2 s after the injection, reaching 1 mm ion beam diameter, much smaller than the electron beam diameters of 27 mm and 19 mm in the electron cooler and in the ETS, respectively. The electron cooler with beam velocity locked the ion beam velocity to ; the laboratory electron energy of this electron beam was near 970 eV. It was generated by a thermionic cathode and magnetically expanded so that the temperature in the co-moving frame of the beam can be calculated Pastuszka et al. (1996); Schmitt (1999) to meV. This temperature refers to the transverse direction perpendicular to the ion beam, while the longitudinal electron velocity differences correspond to a temperature found to be meV in independent measurements Gwinner et al. (2000). The electron density of the electron cooler amounted to =1.8107 cm-3 and a longitudinal magnetic field of 0.04 T was present in its interaction region with the ion beam.
The electron beam in the ETS was used for the DR rate coefficient measurements at variable beam velocity , which sets the electron–ion collision energy through the detuning energy defined as
| (2) |
where is the electron mass. The electron–ion collision velocities are described by an anisotropic thermal distribution Andersen et al. (1990) with the transverse and longitudinal electron temperatures and , respectively. The electron beam of the ETS was produced with a photocathode at liquid-nitrogen temperature Orlov et al. (2004) and, similar to the electron cooler, magnetic expansion was applied between the cathode and the interaction region Sprenger et al. (2004). At matched beam velocities (, corresponding to ) the electron density of the ETS was cm-3; a longitudinal magnetic field of 0.057 T was present in its interaction region. Electron temperatures of meV and near 25 eV were determined for the photocathode electron beam in the present measurement, observing energy dependences in the DR rate coefficient as described below.
The neutral fragments emerging from the electron–ion reactions in the ETS travel with the ion beam velocity and leave the storage ring in forward direction towards a dedicated beamline in which a surface barrier detector (SBD) with 4848 mm2 active area is situated at about 11.5 m from the ETS center. The SBD has unit efficiency and yields signals proportional to the kinetic energy of the fragments impinging within the sampling time of 1 s which is long compared to the arrival time difference of fragments from one DR event of 1 ns, while short compared to the typical interval between two independent events at rates of 1 kHz. Signals associated with the full mass of HD+ are associated with a DR event, whereas those corresponding to smaller masses are treated as events yielding a single neutral H or D.
After the ion beam is injected into the TSR, phase-space cooling and radiative cooling of the molecular ions are allowed to proceed over a period of typically 2 s before data are taken. The laboratory energy of the electrons in the ETS is then varied in cycles of tens of milliseconds between values of , which yield (“cooling”), of , which yield eV (“reference”), and of (“measurement”), varied according to the range of detuning energy to be scanned. The rates of DR signals, , and of single mass events, with , are recorded at these energies. The variation of from injection to injection yields the rates as a function of energy, from which together with the electron densities the relative DR rate coefficient at is obtained by
| (3) |
Here, is the DR rate at and the rate of deuterons at , both averaged over all cycles of a given , whereas and are the rates of deuterons and of DR at and , respectively, averaged over all values of of one data set. Different data sets may differ in the ratio of depending on the average pressure in the storage ring.
As a function of the laboratory energy , the rate coefficient measured by this method shows a peak at , corresponding to the smallest collision energies where the DR cross section diverges, while the rate coefficient assumes a finite value determined by the spread of the electron–ion collision velocities. From Eq. (2), relating to , it is seen that any variations of lead to much smaller changes in the collision energies, distributed in a narrow range around . Hence, sorting the data into suitable intervals of , highly resolved variations of the energy resolved merged-beams rate coefficient are measured. This rate coefficient is linked to the DR cross section via
| (4) |
where is the collision velocity and the distribution of collision energies for a given detuning energy, which follows from the anisotropic thermal velocity distribution and reflects the electron beam temperatures and . For the transformation between and , small long-term drifts between the voltages supplied in the ETS and the electron cooler are monitored by regular scans over the peak at , fixing at the maximum position of the peak in the analysis of the data taken in the temporal vicinity. The weighted average of these rate coefficients for the different data sets is then corrected for toroidal effects Lampert et al. (1996) and finally absolutely normalized to the rate coefficient cm3 s-1 reported by Al-Khalili et al. (2003).
In addition to the energy-resolved velocity-averaged rate coefficient , also the reduced rate coefficient is used for the presentation of experimental and theoretical data. This choice suppresses the overall decrease of , scaling as , which is caused by the behaviour of the non-resonant DR cross section. For a cross section with constant , this reduced DR rate coefficient for assumes the constant value of . Near , the value of is lowered by the convolution over the electron energy distribution. For asymptotically small , it rises as because of the convolution with the electron energy distribution and reaches 90% of its final value at , which corresponds to 2.5 meV in the present case. Thus, above a few meV, variations of only occur if the energy dependence of deviates from , which emphasizes the resonant contributions.
III Experimental results
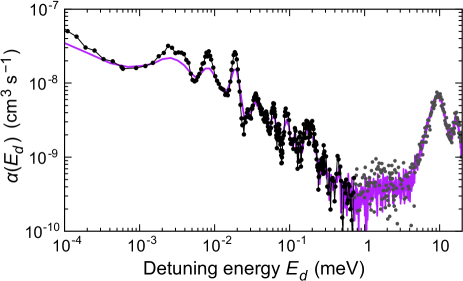
The measured merged-beams rate coefficient as function of the detuning energy is shown in Fig. 1. Temporal changes of the energy dependence became insignificant for times larger than 2 s after the injection, so that we present data from the storage time interval of 2–10 s. High-resolution scans were limited to the energy region below 0.7 eV, above which the rate coefficient becomes very small. The high-energy peaks near 10 and 16 eV were scanned with lower resolution and less measurement time. Here the previously observed structure Al-Khalili et al. (2003) for vibrationally relaxed HD+ ions is well reproduced. Of the previous benchmark measurements presented by Al-Khalili et al. (2003), that from CRYRING is chosen for comparison with the present data as it was obtained with the lowest electron temperature so far reported for this system, meV. In the present results, the structure at low energies appears much better resolved. Thus, the peaks at 3, 8, and 19 meV become more pronounced and sub-structures appear much more clearly, as illustrated in Fig. 1 by the additional low-energy peak near 2.5 meV.
A more detailed view of the low-energy structure is presented in Fig. 2 using the reduced rate coefficient . This reveals clear sub-structures and newly observed peaks between 30 and 100 meV.
For a determination of the electron temperature, the low-energy edges of the lowest-lying peaks, corresponding to energy regions near 2, 7, and 17 meV, were compared to a model rate coefficient. It was obtained from a cross section composed of an overall decrease and three infinitely narrow resonances near the peak positions, folded with the anisotropic thermal velocity distribution. For appropriately chosen peak positions, good agreement was found for meV, while the high-energy edges are consistent with meV. This implies a collision energy spread (full width at half maximum, FWHM) of 1 meV or less in the low-energy limit, 2 meV at meV and 6.5 meV at meV, scaling as for meV.
| 0 | 1 | 2 | 3 | 4 | 5 | 6 | 6 |
|---|---|---|---|---|---|---|---|
| 0 | 5.44 | 16.28 | 32.47 | 53.91 | 80.46 | 111.99 | |
| 0.104 | 0.251 | 0.271 | 0.199 | 0.108 | 0.046 | 0.015 | 0.006 |
| 140.2 | 14.61 | 4.04 | 1.64 | 0.823 | 0.469 |
The energy resolution obtained in the present measurements is thus comparable to, and for very low collision energies even below the energy splitting of the two lowest rotational levels of HD+ of 5.44 meV, so that the rotational structure of the ro-vibrationally excited Rydberg resonances Bardsley (1968) in the electron collision continuum can be expected to become visible.
After leaving the ion source the HD+ ions are vibrationally and rotationally excited (rotational and vibrational initial ionic levels and , respectively). But while the vibrations are known to radiatively relax within storage times considerably shorter than 1 s Amitay et al. (1998), the rotational excitation of the HD+ ions built on the vibrational ground state is expected to reach an equilibrium only after several seconds of storage, with a number of rotational states remaining populated at all times. The cooling rate and the resulting population distribution finally reached are determined by the interaction with the blackbody radiation field of 300 K that pervades the inner volume of the room-temperature ion storage ring, and by the continuous interaction of the HD+ ions with the electrons of the electron cooler and the electron target. While the Einstein coefficients between the rotational states required to describe the interaction of HD+ with the radiation field are well known Amitay et al. (1994), the expected large inelastic cross sections for low-energetic electron scattering on rotational states of HD+ could only recently be verified by observing the rotational cooling of HD+ by super-elastic electron collisions (SEC) in a dedicated experiment Shafir et al. (2009). Based on these findings we estimated the time development of the rotational populations by adjusting the calculations described by Shafir et al. (2009) to the present experimental situation. In particular, the larger temperature of the electron beam of the electron cooler of 16 meV in its co-moving reference frame, substantially higher than that of the electron beam used in Ref. Shafir et al. (2009) (2.8 meV), led not only to rotational de-excitation by SEC. It also caused considerable excitation of the lowest rotational states by inelastic collisions with electrons in the high-energetic tail of the velocity distribution in the electron cooler. Conversely, cooling and heating of the distribution by inelastic electron collisions in the ETS were found to be negligible, mainly because of its much lower electron density. While steady-state conditions were found in these estimates to be reached only asymptotically at the end of the observation window (10 s), the average population distribution, weighted by the storage lifetime of the HD+ beam of 7 s, can be approximated by a Boltzmann distribution with a rotational temperature in the range of 250–300 K (the range of uncertainty reflecting the limited accuracy at which the SEC cross sections could be verified in Ref. Shafir et al. (2009)). In the following discussion we therefore assume a thermal distribution of 300 K to reasonably represent the relative populations of the HD+ rotational levels during the present measurement. The resulting populations of the seven lowest rotational states with quantum numbers –6 are compiled together with other properties in Table 1.
IV Theoretical Method
Dissociative recombination is a reactive collision involving ionization channels, describing the scattering of an electron on the molecular ion, and dissociation channels, accounting for the atom–atom scattering. The main steps of our current MQDT treatment Motapon et al. (2008) are described below.
IV.1 Construction of the interaction matrix
This is performed in the outer shell of the region of small electron–ion and nucleus–nucleus distances, that is in the ‘A-region’ Jungen and Atabek (1977), where the Born-Oppenheimer context is appropriate for the description of the collision system. The good quantum numbers in this region are , , and , associated respectively to the total angular momentum and its projections on the -axes of the laboratory-fixed and of the molecule-fixed frames.
Within a quasi-diabatic representation Sidis and Lefebvre-Brion (1971); Bardsley (1968); Giusti (1980), the relevant states are organized in channels, according to the type of fragmentation which they are meant to describe. An ionization channel is built starting from the ground electronic state of the ion and one of its ro-vibrational levels , and is completed by gathering all the mono-electronic states of a given orbital quantum number . These mono-electronic states describe, with respect to the threshold, either a “free” electron – in which case the total state corresponds to (auto)ionization – or to a bound electron – in which case the total state corresponds to a temporary capture into a Rydberg state. In the A-region, these states may be modeled reasonably well with respect to the hydrogenic states in terms of the quantum defect , dependent on the internuclear distance , but assumed to be independent of energy.
An ionization channel is coupled to a dissociation one, labeled , by the electrostatic interaction . In the molecular-orbital (MO) picture, the states corresponding to the coupled channels must differ by at least two orbitals, the dissociative states being doubly-excited for the present case. We account for this coupling at the electronic level first, through an -dependent scaled “Rydberg–valence” interaction term, , assumed to be independent of the energy of the electronic states pertaining to the ionization channel. Subsequently, the integration of this electronic interaction on the internuclear motion results in the elements of the interaction matrix ,
| (5) |
where is the total energy and and are the nuclear wave-functions corresponding to a dissociative state and to an ionization channel, respectively.
This procedure applies in each -subspace, and results in a block-diagonal global interaction matrix. The block-diagonal structure, corresponding to the available symmetries, propagates to the further built matrices.
IV.2 Construction of the reaction matrix
Starting from the interaction matrix , we build the reaction K-matrix, which satisfies the Lippmann-Schwinger integral equation
| (6) |
This equation has to be solved once – whose elements are given by Eq. (5) – is determined. Here is the zero order Hamiltonian associated to the molecular system, while neglecting the interaction potential . It has been proven that, provided the electronic couplings are energy-independent, a perturbative solution of Eq. (6) is exact to second order Ngassam et al. (2003).
IV.3 Diagonalization of the reaction matrix
In order to express the result of the short-range interaction in terms of phase-shifts, we perform a unitary transformation of our initial basis into eigenstates. The columns of the corresponding transformation matrix are the eigenvectors of the K-matrix, and its eigenvalues serve to evaluate the non-vanishing elements of a diagonal matrix :
| (7) |
IV.4 Frame transformation to the external region
In the external zone – the ‘B-region’ Jungen and Atabek (1977), characterized by large electron-core distances – the Born-Oppenheimer model is no longer valid for the whole molecule, but only for the ionic core. is no longer a good quantum number, and a frame transformation Fano (1970); Chang and Fano (1972); Vâlcu et al. (1998) is performed between coupling schemes corresponding to the incident electron being decoupled from the core electrons (external region) or coupled to them (internal region). The frame transformation coefficients involve angular coupling, electronic and vibrational factors, and are given by
| (9) |
as well as by and , which are obtained by replacing cosine with sine in Eqs. (IV.4) and (9). In the preceding formulae, is a vibrational wavefunction of the molecular ion, and is a vibrational wavefunction of the neutral system adapted to the interaction (A) region. The matrix elements represent the ro-vibronic couplings giving rise to the resonant capture processes. The quantities and are related to the reflection symmetry of the ion and neutral wave function respectively, and take the values +1 for symmetric states and 1 for antisymmetric ones. The ratio in front of the sum in the right member of Eq. (IV.4) contains the selection rules for the rotational quantum numbers. The indices () stand for the states of a given symmetry, open to dissociation at the current energy. denotes the eigenchannels built through the diagonalization of the reaction matrix and , are its eigenvalues and the components of its eigenvectors respectively.
The projection coefficients shown in Eqs. (IV.4) and (9) include the two types of couplings controlling the process: the electronic coupling, expressed by the elements of the matrices and , and the non-adiabatic coupling between the ionization channels, expressed by the matrix elements involving the quantum defect . This latter interaction is favored by the variation of the quantum defect with the internuclear distance .
IV.5 Construction of the generalized scattering matrix
The matrices and with the elements given by Eqs. (IV.4) and (9) are the building blocks of the ‘generalized’ scattering matrix :
| (10) |
It involves all the channels, open (“”) and closed (“”). Although, technically speaking, the open channels only are relevant for a complete collision event, the participation of the closed channels may influence strongly the cross section, as shown below.
The matrix relies on 4 block sub-matrices,
| (11) |
where “” and “” label the lines and columns corresponding to open and closed channels, respectively.
IV.6 Elimination of closed channels
The building of the X matrix is performed independently on any account of the asymptotic behaviour of the different channel wavefunctions. Eventually, imposing physical boundary conditions leads to the ‘physical’ scattering matrix, restricted to the open channels Seaton (1983):
| (12) |
It is obtained from the sub-matrices of appearing in Eq. (11) and on a further diagonal matrix formed with the effective quantum numbers (in atomic units) associated with each vibrational threshold of the ion situated above the current energy (and consequently labelling a closed channel).
IV.7 Cross section evaluation
For a molecular ion initially in the level and recombining with an electron of kinetic (collision) energy , the cross section of capture into all the dissociative states of the same symmetry is given by
| (13) |
On the other hand, the cross section for a ro-vibrational transition to the final level , giving collisional (de-)excitation, is
| (14) | |||||
Here is the ratio between the multiplicities of the neutral and the target ion. After performing the MQDT calculation for all accessible total rotational quantum numbers and for all relevant symmetries, one has to add up the corresponding cross sections in order to obtain the global cross section for dissociative recombination or ro-vibrational (de-)excitation as a function of the electron collision energy .
V Computation of cross sections and resonance assignment
V.1 Computations
Since the lowest doubly excited state has by far the most favorable crossing with the ion curve for collisions taking place at low energy, our analysis has focused on its contribution to the DR cross section. To improve the accuracy of the cross sections, we have used for this symmetry the adjusted quasi-diabatic molecular data – electronic potential curves and couplings – as described in Ref. Motapon et al. (2008). In particular, the quantum defect functions were obtained by the procedure of Ross and Jungen (1987) using the large set of adiabatic potential curves from Detmer et al. (1998). With these data, we have performed MQDT-based Schneider et al. (1997); Giusti (1980); Vâlcu et al. (1998) computations of the DR cross section for vibrationally relaxed HD+ on its first 13 rotational levels (–12, ), a range which is by far sufficient to satisfactorily model an equilibrium rotational distribution corresponding to temperatures below 1000 K.
For each initial rotational state of the ground vibrational level , the cross section has been obtained by summing up the contributions over all accessible values of and all symmetries. Once the total cross-sections were computed, we have calculated Boltzmann averages for different rotational temperatures between 100 and 1000 K. This output has then been used for a further average, consisting of the convolution with the anisotropic Maxwell distribution of the relative velocities between electrons and cations in storage ring conditions. This yields the energy-resolved rate coefficient described by Eq. (4) suitable for comparison with the experiment, where appropriate electron temperatures and must be set to define the collision energy distribution . For the calculations presented here we have chosen meV and meV. Regarding the rotational temperature assumed in the Boltzmann average to determine the rotational level populations, we will assume the value of 300 K considered as a reasonable estimate of the experimental conditions (see Sec. III).
The high experimental resolution and the finite number of rotational levels giving significant contributions to the rate coefficient suggest to investigate the origin of individual structures in the theoretical cross section and their correspondence to the energy dependence of the experimental cross section. Such structure can in particular be of resonant character, representing electronically bound Rydberg states in the various ionization channels as defined above, which are associated to well-defined quantum numbers of the ion core in the ‘A-region’. Single rotational states of the incident ion are discussed separately before the average over the rotational level populations is added as a final step. The choice of the electronic orbital momentum of the Rydberg resonances corresponds to that applied earlier Schneider et al. (1997), where it is restricted to and ( and states, only). The resulting angular momenta that contribute to the sum in Eq. (13) as well as the channel quantum numbers are those given in Table 1 of Ref. Schneider et al. (1997).
V.2 Resonance assignment
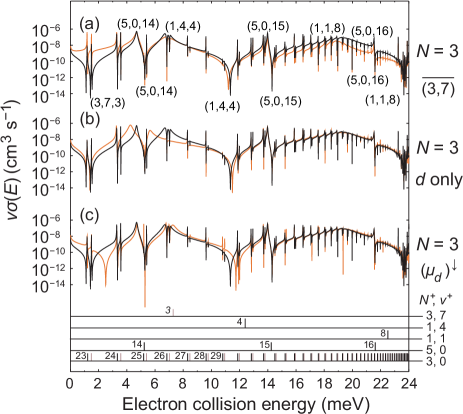
The assignment procedure has been carried out for each of the first six rotational states of the ground vibrational state of HD+(), that is, –5. As suggested by Eq. (4), the energy dependent DR cross section is represented in the form of , which is denoted as the “local” rate coefficient. The step to the experimental energy-resolved rate coefficient then consists only in the convolution with to obtain . For simplicity, the same energy scale (denoted as “electron collision energy”) is used in the figures both for the collision energy itself and for the detuning energy scanned in the experiment as a proxy for ; moreover, the convolved energy-resolved rate coefficient is represented on the same vertical scale as the unconvolved local rate coefficient . The fully assigned local rate coefficients and the results of the convolution are presented in Fig. 3 and 4 for HD+( in the initial ro-vibrational states and 2, respectively, which have the highest relative populations at 300 K (see Table 1). The energy range of 0–24 meV is chosen in order to focus on the resonances that determine the DR rate coefficient under cold plasma conditions up to 100 K.
V.2.1 Results for the most populated initial rotational states
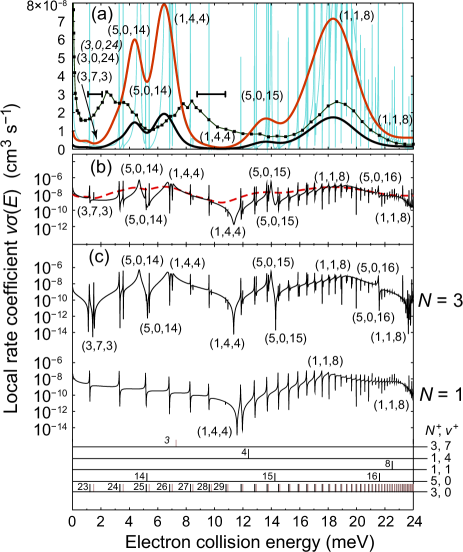
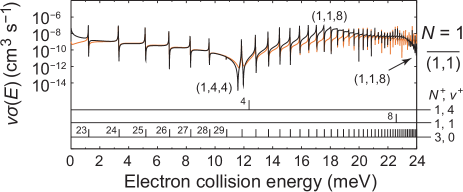
In Fig. 3 the calculated energy-resolved DR rate coefficient is presented for . The result of the convolution in Fig. 3(a) shows a number of maxima and minima whose assignment has been obtained by considering the unconvolved local rate coefficient in Fig. 3(b) and, at the most elementary level shown in Fig. 3(c), the contributions to it arising from the accessible states of total angular momentum . Details of the resonance assignment will be discussed in Sec. V.2.2. It is guided by considering the Rydberg series corresponding to various relevant ionic-core excitations as indicated by the prediction bars in the lower part of the figure. Purely rotational excitations from to lead to high- Rydberg resonances in the near-threshold electronic continuum. Only small contributions to result from (), but significant effects ensue for , even after the convolution. Significant peaks and dips in the rate coefficient are also caused by higher ro-vibrational core excitations, which lead to Rydberg resonances with lower principal quantum number . These structures are considerably shifted in energy from their positions predicted by the Rydberg formula and need more detailed verifications in order to identify their origin (see Sec. V.2.2). Important structures can be assigned to the resonances and in the excitation channels and , respectively, whose energies are well known Tanabe et al. (1995) to lie in the electronic continuum relevant for the low-energy DR of HD+. Note that these cases do not involve any change in the rotation, as . Moreover, the resonance in the even higher excitation channel, energetically predicted below the ionization threshold for this channel, is found to cause a strong dip in the rate coefficient at only 2 meV collision energy for this incident rotational level.
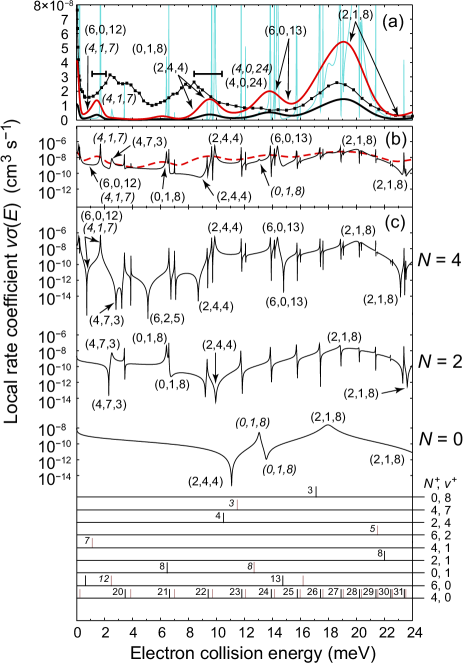
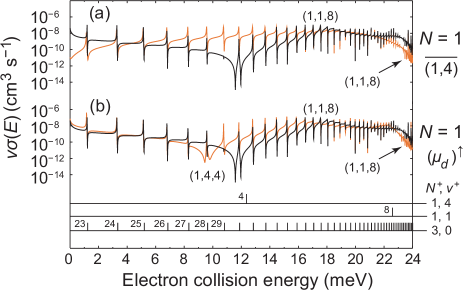
The energy-resolved DR rate coefficient for , and the contributions to it of the individual total angular momenta , are shown in Fig. 4. Considering the core excitations indicated in the lower part of the plot, again some resonances from purely rotational excitation remain visible even after the convolution over the electron energy distribution. Thus, the Rydberg level of the excitation channel leads to a clear structure around 16 meV; in addition, the and Rydberg levels of the channel lie very close to the HD ionization threshold and likely cause the calculated to rise by a factor of 4 in the range of meV. The dominant structures in the predicted are again the and resonances in the channels and , respectively, with . The states of the channels and predicted in this energy region probably lead to an additional broad modulation of the calculated local rate coefficient.
The comparisons to the experiment in Fig. 3(a) and Fig. 4(a) show that the calculations for only the two most populated initial rotational states already well reproduce the observed strong structure near 20 meV, which coincides with the predicted peaks for both . The calculated positions of these peaks are fairly independent of as the related resonant capture processes do not involve a change in the core rotation and is sufficiently high, so that variations of the quantum defect with have only a small effect. This is different for most other resonances. The calculated rate coefficient after summation over will be presented in Sec. VI, where also the main resonant contributions for the other initial rotational states will be labeled.
V.2.2 Procedure and verification of resonance assigment
The resonance assignment demonstrated in the previous section is the result of a two-step strategy, based on the prediction of the resonance energies and a validation of the resonant effect onto the local rate coefficient. These two steps are implemented as follows.
(i) Prediction. Considering a channel with the core quantum numbers and , the conservation of the total energy in the resonant electron capture process into a Rydberg state with principal quantum number and orbital angular momentum can be approximated by
| (15) |
Here is the Rydberg energy constant, the suitably averaged quantum defect of the relevant channel (see below), and the energy of the incident electron associated with the resonance of channel . These energies are used to create the Rydberg series prediction bars in the figures of this Section.
The quantum defect can in lowest approximation, appropriate for low and high , be calculated at the equilibrium internuclear distance of the ground-state molecular ion. However, for lower states, which become relevant at higher , the anharmonicity of the HD+ potential curve together with the -dependence of the quantum defects leads to imprecise predictions of the Rydberg resonance energies. Hence, we obtain the quantum defects for a particular excited core state as the average
| (16) |
The actual structure of the local rate coefficient due to the Rydberg resonance is still shifted from the prediction of Eq. (15) through the perturbation induced by the dissociative state, which is properly taken into account by the MQDT formalism. Hence, in a number of cases structures cannot be uniquely identified using the prediction bars alone, and the assignment to specific excitation channels and Rydberg resonances requires a validation procedure.
(ii) Validation. For a unique identification of the excitation threshold , we eliminate the respective resonant contributions in the cross-section calculation. For this purpose, the matrix elements representing the ro-vibronic couplings for this specific threshold are set to zero in Eq. (IV.4) for both and . In most cases the comparison between the cross section obtained in these trials and the original calculated cross section enables us to identify the structures due to the considered threshold. Similarly, the contributions from different resonance orbital angular momenta are distinguished by temporarily setting the corresponding quantum defect function to zero in Eq. (IV.4).
A further tool for resonance identification is to probe the sensitivity of the energy at which a structure occurs to slight changes of the quantum defect, which lead to corresponding changes of the resonance energy according to
| (17) |
Low-lying mono-excited Rydberg states are strongly coupled with the dissociation continuum, which results in large width of the resonance profile. Furthermore, the inclusion of the vibronic coupling via the frame transformation induces asymmetric resonance profiles. Thus, the assignment of such states using only predicted resonance positions is normally not possible, and the detailed validation steps discussed here are needed.
The validation of the peak and valley positions for the resonance in the channel for is demonstrated in Fig. 5. The threshold elimination procedure is used on the excitation channel and leads to a disappearence of the presumed minima and maxima. The corresponding validation of the minimum for the same initial state is demonstrated in Fig. 6(a) regarding the associated excitation channel, while Fig. 6(b) shows the effect of a shift of the quantum defect for the Rydberg states, which leads to downward displacements of both the presumed and structures, with a larger shift observed as expected for the structure assigned to .
All three steps were combined to identify the resonance in the contribution to the rate coefficient, as shown in Fig. 7. Near 1.2 meV, the MQDT local rate coefficient shows more mimima than energetically predicted at these energies (only two minima should occur along the Rydberg series from and ). The third minimum could arise from the nearby resonance or possibly the resonance occuring at . On removal of all resonances in Fig. 7(b), only the narrow structure close to the predicted energy disappears. The deepest minimum near 1.2 meV, occurring between and , clearly has character as it remains when the contribution is removed. Also, on slightly lowering the quantum defect in Fig. 7(c), this minimum moves upward by a larger amount than the nearby , identifying it as .
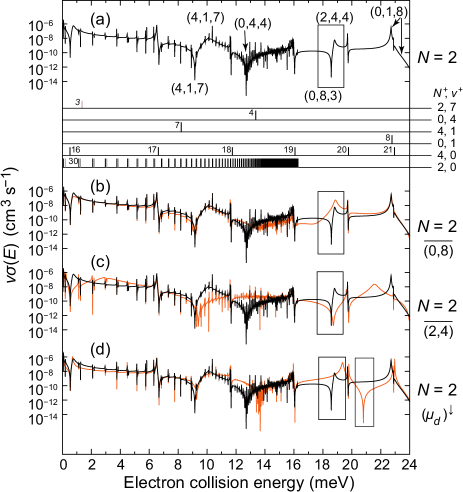
As a final example for the validation procedure, the identification of resonance maxima and minima is demonstrated in Fig. 8 for the MQDT local rate coefficient for the DR of HD+ ions in the rotational ground state (). In addition to the prediction bars shown, the and states are calculated from Eqs. (15) and (16) to lie out of scale, at meV and meV, respectively. Elimination of the excitation channel in Fig. 8(b) leads to disappearence of the minimum near 19 meV, while the elimination of the excitation channel in Fig. 8(c) suppresses the nearby maximum. On a slight decrease of the quantum defect in Fig. 8(d), both the minimum and the maximum are upshifted, revealing their character; as expected because of the lower principal quantum number involved, the minimum assigned to shifts more strongly than the maximum assigned to .
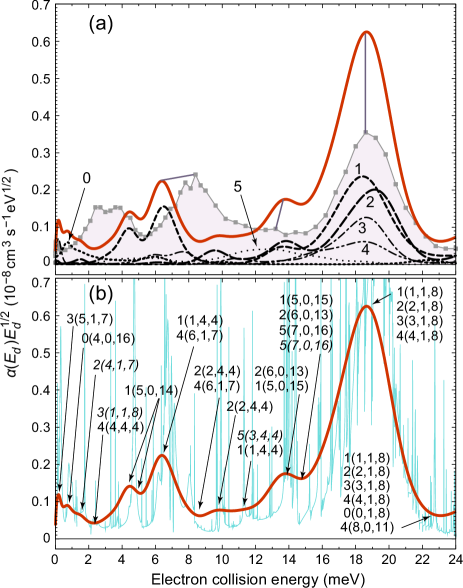
VI Detailed comparison between storage-ring and MQDT results
For the comparison between experimental and theoretical results, we choose the reduced DR rate coefficient which emphasizes the resonant variations. The Boltzmann-weighted contributions of the individual HD+ rotational states as well as the total MQDT rate coefficient obtained by summing these contributions are shown in Fig. 9(a), while the main resonances assigned to the structures in the total MQDT rate coefficient are indicated in Fig. 9(b). For the shape of the theoretical rate coefficient, the contribution turns out to have the largest influence. In fact, the predicted double structure between 4 and 7 meV resulting from the and resonances for this remains visible also in the sum over all initial rotational states. HD+ ions in are also predicted to yield the largest contribution to the peak near 19 meV through the resonance. This resonance is further emphasized by other resonances of the same Rydberg level and with , which occur at essentially the same for –4. Near 14 meV the maxima and minima caused by the Rydberg levels of and of add up. Theory also predicts two structures at very low energy meV: a peak due to combined ro-vibrational excitation of ions, caused by a Rydberg level, and a rather strong Rydberg resonance through purely rotational excitation of ions to . The latter prediction would significantly influence the DR of HD+ in a low-temperature environment, where will be much more important than in the present case. [Note that also the Rydberg levels of the excitation channel occur in very close vicinity of the ionization threshold () for these ions, as shown in Fig. 8, but the MQDT calculation predicts lower contributions to the DR rate for these states.] Altogether, while the strongest resonances in the calculated rate coefficient are due to combined ro-vibrational excitation, also purely rotational excitation and capture in Rydberg levels with –16 are found to give significant contributions.
In comparison to the experiment, a clear correspondence is observed between the calculated peaks of –4 near 19 meV and the dominant experimental structure found at this energy. At lower energies, less good agreement is found; in particular, the prominent experimental peaks at 2–4 meV (with a sub-structure) and at 8 meV are not correctly reproduced by the theory. Considering the trend of low- resonances to acquire a large width, it appears not unreasonable to suggest a correspondence between the strong theoretical resonance for at 6 meV with the experimental structure observed 2 meV higher in energy. It can also be rationalized that for the low involved in such resonances, both energetic position and width will sensitively depend on the underlying quantum defect of this channel and on its residual dependence. On the other hand, this assumes that the lower experimental peak (or unresolved peaks) are caused by levels not properly accounted for in the calculation. It must be noted that for a predicted high- resonance, such as for near 5 meV, variations of the quantum defect will not significantly change the resonance position on the considered energy scale (even though the resonance strength and the exact position of the associated minima and maxima will be affected). Hence, the 2–4 meV experimental peak can be plausibly assumed to be partly caused by the , resonance, while other contributions to it are obviously missed by the calculation.
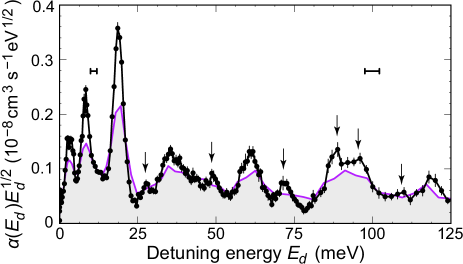
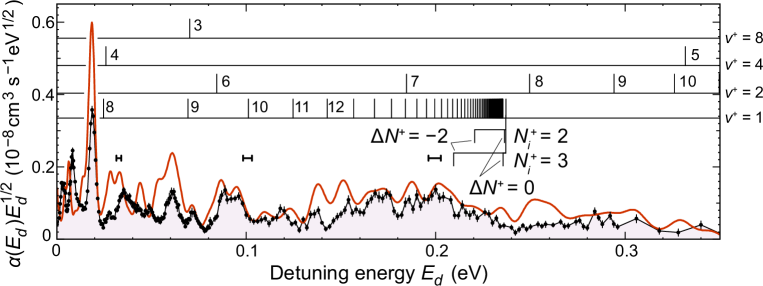
The theoretical results obtained in the same approach over a broader energy range, including the excitation limit to the first HD+ vibrational level at 0.237 eV, are shown in Fig. 10 and compared to the experimental data, using again the reduced rate coefficient . It should be noted that the thermal rate coefficient of cm3 s determined in the limit of low electron temperature by Al-Khalili et al. (2003) translates into a constant low-energy limit of that amounts to cm3 s-1 eV1/2, in good agreement with the average value of the reduced rate coefficient observed at 0.02 eV, while the overall trend of then shows a lower average up to 0.2 eV. A further decrease occurs as expected at the first vibrational excitation threshold, when the autoionization into the electronic continuum of HD) becomes energetically allowed following resonant electron capture (resonant vibrational excitation).
The energetic thresholds for autoionization plotted in Fig. 10, which are complemented by the attached Rydberg series of capture resonances, assume incident ions and are slightly shifted by rotational effects. Thus, for and autoionization into the continuum with , the reduction of the vibrational constant by centrifugal effects moves the threshold positions downward by a few meV, resulting in shifts of and meV for and incident HD+ ions, respectively. The shifts become larger for autoionization into the continuum with , corresponding to vibrational excitation connected with rotational de-excitation and are illustrated for the threshold and the case in Fig. 10, where they amount to and meV, respectively. Since processes with are clearly important in the MQDT calculations, as discussed in detail in Sec. V, all resonance positions marked here (in contrast to Sec. V) can have only indicative character considering the rotational excitation relevant in the present study. With this in mind, for Fig. 10 also the quantum defects were neglected in the Rydberg state positions marked which, however, mainly affects the low- resonances for and 8.
The present MQDT result yields overall a remarkable agreement with both the magnitude and the structure of the observed rate coefficient. In fact, up to 0.2 eV most prominent structures of the reduced rate coefficient are resonably well reproduced by the theory with local energy shifts below 5 meV. Also an intermittant dip in between 0.10 and 0.14 eV is reasonably borne out by the MQDT prediction. Both in experiment and theory, the drop in the reduced rate coefficient at 0.2 eV, i.e., already below the rotationless vibrational excitation threshold, is remarkable. In fact, the onset of this decrease occurs just at the expected threshold energies of processes for and 3 indicated in Fig. 10, which suggests that resonant electron collisions followed by autoionization in this energy region lead to vibrational excitation together with rotational de-excitation. The initial rotational levels for which this effect can be expected are among the most populated ones at 300 K (see Table 1).
VII Discussion and outlook
At the high energy resolution and theoretical accuracy achieved in the present work, dissociative recombination experiments using a stored beam of vibrationally relaxed HD+ ions turn out to be a sensitive tool for studying rotational effects in resonant low-energy collisions with molecular cations. The energy-resolved rate coefficient reveals a rich structure from ro-vibrationally excited Rydberg resonances which drive the DR processes observed here as well as the other collision channels of ro-vibrational (de-)excitation and elastic scattering. Extensive MQDT calculations yield a high level of agreement with the observed structures, which confirms the good quality of the molecular data applied, the efficiency of the theoretical approach for predicting the low-energy resonant processes, and the assumptions about the rotational level population underlying the interpretation of the experimental results.
The rotational level population, close to the thermal equilibrium caused by radiative transitions in the blackbody radiation field of the 300-K (room-temperature) storage-ring and by the inelastic and superelastic electron collisions in the electron cooler, leads to 5 similarly occupied HD+ initial levels with excitation energies well above the experimental energy resolution. The largest structure, a narrow resonance near 19 meV, is assigned to the rotationally excited initial states –4, whereas no contribution from is predicted for this peak. The molecular rotation is conserved in the formation of these electron capture resonances. The calculation predicts similarly large rate coefficients for processes with which, however, for the various initial rotational levels are strongly dispersed over the energy scale studied here. While the experimental structures are not reproduced in all their detail, the agreement between the measured structures and those in the MQDT rate coefficient after convolution with the experimental energy distribution is remarkable and by far the best for any molecular ion to-date, especially at this resolution. Not only can most observed structures between 5 and 200 meV be individually assigned to calculated ones, but also the ratio of the calculated and the measured rate coefficients remains within 0.5 to 2.0 over essentially this entire energy range.
The ro-vibrational resonant structure in the low-energy DR rate coefficient of HD+ is among the most pronounced ones observed for this process on any molecular cation. Since ro-vibrational resonances of the type considered here occur for a wide range of diatomic and polyatomic ions, their statistically averaged DR rate coefficients in cold media should be expected to be significantly influenced by the magnitudes and the temperature dependences of this resonant DR process. However, most experiments so far observed rather structureless energy dependences in low-energy DR studies of heavier systems Larsson and Orel (2008). It is likely that this can be attributed to the much smaller energetic differences between the rotational levels for these species as compared to the hydrogen cation, which leads to an even larger number of rotational levels populated at the rotational temperatures of at least 300 K in the collision-energy resolved DR measurements so far performed on such systems. This stands in contrast to the low-temperature conditions of many media in which DR is important, and much more structure in the energy dependence of the DR rate coefficient may well be revealed also in these cases with improved control over the rotational populations. For HD+, the present results predict that the collision energy dependence of the DR rate coefficient for rotationally cold () ions will be dramatically different from that observed here and in previous experiments with similar, near room-temperature, rotational populations. The development of a cryogenic electrostatic ion storage ring suitable for electron–ion collision experiments with merged beams is in progress Zajfman et al. (2005); Lange et al. (2010) and will make energy-resolved DR studies possible under conditions where rotational excitation by the thermal blackbody radiation is largely eliminated and the parent ions are rotationally cold.
On the theoretical side, the present work demonstrates the power of the MQDT method for predicting low-energy collision cross sections between electrons and molecular cations determined by numerous Rydberg capture resonances, including a detailed account of rotational effects. The magnitude and energetic dependence of the DR rate coefficient can be well understood on the basis of these calculations after averaging over the electron energy distribution and the initial HD+ rotational distribution. Methods for identifying the individual resonant contributions in the theoretical cross section even in cases of overlapping and strongly broadened resonances have been implemented. This will be of great help in future efforts to further improve the quantum defect functions and their implementation in the resonant cross-section calculation. Full experimental control over the initial rotational excitation of the HD+ ions, in connection with MQDT calculations using the procedures presented here, can be expected to yield a complete understanding of the state-to-state resonant collision mechanism for this benchmark reaction also in the low-temperature limit which is not yet finally explored.
Acknowledgements.
The authors would like to thank Ch. Jungen, H. Takagi, C. H. Greene, V. Kokoouline, and S. L. Gubermann for numerous discussions and the TSR and accelerator teams at the Max-Planck Institute for Nuclear Physics for their support during the beam times. We acknowledge scientific and financial support from the European Spatial Agency/ESTEC 21790/08/NL/HE, the International Atomic Energy Agency (CRP “Light Element Atom, Molecule and Radical Behaviour in the Divertor and Edge Plasma Regions”), the French Research Federation for Fusion Studies (CEA, EFDA, EURATOM), the French ANR project ‘SUMOSTAI’, the CNRS/INSU programme ‘Physique et Chimie du Milieu Interstellaire’, the projects Triangle de la Physique/PEPS ‘Physique théorique et ses interfaces’, CPER Haute-Normandie/CNRT ‘Energie, Electronique, Matériaux’, and PPF/CORIA-LOMC ‘Energie-Environnement’, and the agencies IEFE Rouen-Le Havre, and Conseil Régional de la Haute Normandie. IFS thanks the Laboratoire Aimé–Cotton and the Max-Planck Institute for Nuclear Physics for their hospitality. XU is senior research associate of the Belgian Fund for Scientific Research (FNRS). The experimental work was supported by the Israel Science Foundation, by the German Israel Foundation for Scientific Research (GIF) under contracts I-707-55.7/2001 and I-900-231.7/2005, and by the European Project ITS LEIF (HRPI-CT-2005-026015). DS acknowledges support from the Weizmann Institute through the Joseph Meyerhoff program. The support by the Max-Planck Society is gratefully acknowledged.References
- Larsson and Orel (2008) M. Larsson and A. E. Orel, Dissociative Recombination of Molecular Ions (Cambridge University Press, Cambridge, 2008).
- Petrie and Bohme (2007) S. Petrie and D. K. Bohme, Mass Spectrom. Reviews 26, 258 (2007).
- Witasse et al. (2008) O. Witasse, T. Cravens, M. Mendillo, J. Moses, A. Kliore, A. Nagy, and T. Breus, Space Sci. Rev. 139, 235 (2008).
- Krasheninnikov (2002) S. I. Krasheninnikov, Phys. Scr. T96, 7 (2002).
- Goodings et al. (1979) J. Goodings, D. Bohme, and C.-W. Ng, Combustion and Flame 36, 27 (1979).
- Phaneuf et al. (1999) R. A. Phaneuf, C. C. Havener, G. H. Dunn, and A. Müller, Rep. Prog. Phys. 62, 1143 (1999).
- Hus et al. (1988) H. Hus, F. Yousif, C. Noren, A. Sen, and J. B. A. Mitchell, Phys. Rev. Lett. 60, 1006 (1988).
- Forck et al. (1993) P. Forck, M. Grieser, D. Habs, A. Lampert, R. Repnow, D. Schwalm, A. Wolf, and D. Zajfman, Phys. Rev. Lett. 70, 426 (1993).
- Tanabe et al. (1995) T. Tanabe, I. Katayama, H. Kamegaya, K. Chida, Y. Arakaki, T. Watanabe, M. Yoshizawa, M. Saito, Y. Haruyama, K. Hosono, K. Hatanaka, T. Honma, K. Noda, S. Ohtani, and H. Takagi, Phys. Rev. Lett. 75, 1066 (1995).
- Strömholm et al. (1995) C. Strömholm, I. F. Schneider, G. Sundström, L. Carata, H. Danared, S. Datz, O. Dulieu, A. Källberg, M. af Ugglas, X. Urbain, V. Zengin, A. Suzor-Weiner, and M. Larsson, Phys. Rev. A 52, R4320 (1995).
- Al-Khalili et al. (2003) A. Al-Khalili, S. Rosén, H. Danared, A. M. Derkatch, A. Källberg, M. Larsson, A. Le Padellec, A. Neau, J. Semaniak, R. Thomas, M. af Ugglas, L. Vikor, W. Zong, W. van der Zande, X. Urbain, M. Jensen, R. C. Bilodeau, O. Heber, H. B. Pedersen, C. Safvan, L. H. Andersen, M. Lange, J. Levin, G. Gwinner, L. Knoll, M. Scheffel, D. Schwalm, R. Wester, D. Zajfman, and A. Wolf, Phys. Rev. A 68, 042702 (2003).
- Larsson (1995) M. Larsson, Rep. Prog. Phys. 58, 1267 (1995).
- Amitay et al. (1998) Z. Amitay, A. Baer, M. Dahan, L. Knoll, M. Lange, J. Levin, I. F. Schneider, D. Schwalm, A. Suzor-Weiner, Z. Vager, R. Wester, A. Wolf, and D. Zajfman, Science 281, 75 (1998).
- Krohn et al. (2000) S. Krohn, Z. Amitay, A. Baer, D. Zajfman, M. Lange, L. Knoll, J. Levin, D. Schwalm, R. Wester, and A. Wolf, Phys. Rev. A 62, 032713 (2000).
- Motapon et al. (2008) O. Motapon, F. O. Waffeu Tamo, X. Urbain, and I. F. Schneider, Phys. Rev. A 77, 052711 (2008).
- Zhaunerchyk et al. (2007) V. Zhaunerchyk, A. Al-Khalili, R. D. Thomas, W. D. Geppert, V. Bednarska, A. Petrignani, A. Ehlerding, M. Hamberg, M. Larsson, S. Rosen, and W. J. van der Zande, Phys. Rev. Lett. 99, 013201 (2007).
- de Ruette (2007) N. de Ruette, Rovibrational selectivity of the ionisation of H in a strong laser field, Ph.D. thesis, Université de Louvain la Neuve (2007).
- Novotny (2008) S. Novotny, Fragmentation of molecular ions in slow electron collisions, Ph.D. thesis, University of Heidelberg (2008).
- Takagi (2002) T. Takagi, Phys. Scr. T96, 52 (2002).
- Schneider et al. (1997) I. F. Schneider, C. Strömholm, L. Carata, X. Urbain, M. Larsson, and A. Suzor-Weiner, J. Phys. B: At. Mol. Opt. Phys. 30, 2687 (1997).
- Takagi et al. (2009) H. Takagi, S. Hara, and H. Sato, Phys. Rev. A 79, 012715 (2009).
- Novotny et al. (2008) S. Novotny, H. Rubinstein, H. Buhr, O. Novotný, J. Hoffmann, M. B. Mendes, D. A. Orlov, C. Krantz, M. H. Berg, M. Froese, A. S. Jaroshevich, B. Jordon-Thaden, M. Lange, M. Lestinsky, A. Petrignani, D. Shafir, D. Zajfman, D. Schwalm, and A. Wolf, Phys. Rev. Lett. 100, 193201 (2008).
- Shafir et al. (2009) D. Shafir, S. Novotny, H. Buhr, S. Altevogt, A. Faure, M. Grieser, A. G. Harvey, O. Heber, J. Hoffmann, H. Kreckel, L. Lammich, I. Nevo, H. B. Pedersen, H. Rubinstein, I. F. Schneider, D. Schwalm, J. Tennyson, A. Wolf, and D. Zajfman, Phys. Rev. Lett. 102, 223202 (2009).
- Orlov et al. (2004) D. A. Orlov, U. Weigel, D. Schwalm, A. S. Terekhov, and A. Wolf, Nucl. Instrum. and Meth. Phys. Res. A 532, 418 (2004).
- Wolf et al. (2009) A. Wolf, D. A. Orlov, C. Krantz, M. Lestinsky, A. Shornikov, O. Novotný, J. Stützel, H. Buhr, M. Mendes, A. Petrignani, M. Grieser, S. Schippers, A. Müller, F. Ferro, and E. Lindroth, J. Phys.: Conf. Ser. 194, 012024 (2009).
- Lestinsky et al. (2008) M. Lestinsky, E. Lindroth, D. A. Orlov, E. W. Schmidt, S. Schippers, S. Böhm, C. Brandau, F. Sprenger, A. S. Terekhov, A. Müller, and A. Wolf, Phys. Rev. Lett. 100, 033001 (2008).
- Steck et al. (1990) M. Steck, G. Bisoffi, M. Blum, A. Friedrich, C. Geyer, M. Grieser, B. Holzer, E. Jaeschke, M. Jung, D. Kr mer, K. Matl, W. Ott, and R. Repnow, Nucl. Instrum. and Meth. Phys. Res. A 287, 324 (1990).
- Pastuszka et al. (1996) S. Pastuszka, U. Schramm, M. Grieser, C. Broude, R. Grimm, D. Habs, J. Kenntner, H.-J. Miesner, T. Schüßler, D. Schwalm, and A. Wolf, Nucl. Instrum. and Meth. Phys. Res. A 369, 11 (1996).
- Schmitt (1999) M. Schmitt, Erzeugung energiescharfer Elektronenstrahlen, Ph.D. thesis, University of Heidelberg (1999).
- Sprenger et al. (2004) F. Sprenger, M. Lestinsky, D. A. Orlov, D. Schwalm, and A. Wolf, Nucl. Instrum. and Meth. Phys. Res. A 532, 298 (2004).
- Gwinner et al. (2000) G. Gwinner, A. Hoffknecht, T. Bartsch, M. Beutelspacher, N. Eklöw, P. Glans, M. Grieser, S. Krohn, E. Lindroth, A. Müller, A. A. Saghiri, S. Schippers, U. Schramm, D. Schwalm, M. Tokman, G. Wissler, and A. Wolf, Phys. Rev. Lett. 84, 4822 (2000).
- Andersen et al. (1990) L. H. Andersen, J. Bolko, and P. Kvistgaard, Phys. Rev. A 41, 1293 (1990).
- Lampert et al. (1996) A. Lampert, A. Wolf, D. Habs, J. Kenntner, G. Kilgus, D. Schwalm, M. S. Pindzola, and N. R. Badnell, Phys. Rev. A 53, 1413 (1996).
- Hunter et al. (1974) G. Hunter, A. W. Yau, and H. O. Pritchard, At. Data Nucl. Data Tab. 14, 11 (1974).
- Amitay et al. (1994) Z. Amitay, D. Zajfman, and P. Forck, Phys. Rev. A 50, 2304 (1994).
- Bardsley (1968) J. N. Bardsley, J. Phys. B: At. Mol. Opt. Phys. 1, 365 (1968).
- Jungen and Atabek (1977) C. Jungen and O. Atabek, J. Chem. Phys. 66, 5584 (1977).
- Sidis and Lefebvre-Brion (1971) V. Sidis and H. Lefebvre-Brion, J. Phys. B: At. Mol. Opt. Phys. 4, 1040 (1971).
- Giusti (1980) A. Giusti, J. Phys. B: At. Mol. Opt. Phys. 13, 3867 (1980).
- Ngassam et al. (2003) V. Ngassam, A. Florescu, L. Pichl, I. Schneider, O. Motapon, and A. Suzor-Weiner, Eur. Phys. J. D 26, 165 (2003).
- Fano (1970) U. Fano, Phys. Rev. A 2, 353 (1970).
- Chang and Fano (1972) E. S. Chang and U. Fano, Phys. Rev. A 6, 173 (1972).
- Vâlcu et al. (1998) B. Vâlcu, I. Schneider, M. Raoult, C. Strömholm, M. Larsson, and A. Suzor-Weiner, Eur. Phys. J. D 1, 71 (1998).
- Seaton (1983) M. J. Seaton, Rep. Prog. Phys. 46, 167 (1983).
- Ross and Jungen (1987) S. Ross and C. Jungen, Phys. Rev. Lett. 59, 1297 (1987).
- Detmer et al. (1998) T. Detmer, P. Schmelcher, and L. S. Cederbaum, Phys. Rev. A 57, 1767 (1998).
- Zajfman et al. (2005) D. Zajfman, A. Wolf, D. Schwalm, D. A. Orlov, M. Grieser, R. von Hahn, C. Welsch, J. R. Crespo López-Urrutia, C. D. Schröter, X. Urbain, and J. Ullrich, J. Phys.: Conf. Ser. 4, 296 (2005).
- Lange et al. (2010) M. Lange, M. Froese, S. Menk, J. Varju, R. Bastert, K. Blaum, J. R. Crespo López-Urrutia, F. Fellenberger, M. Grieser, R. von Hahn, O. Heber, K.-U. Kühnel, F. Laux, D. A. Orlov, M. L. Rappaport, R. Repnow, C. D. Schröter, D. Schwalm, A. Shornikov, T. Sieber, Y. Toker, J. Ullrich, A. Wolf, and D. Zajfman, Rev. Sci. Instrum. 81, 055105 (2010).