Biomimetic bluff body drag reduction by self-adaptive porous flaps.
Nicolas Mazellier***Corresponding author: nicolas.mazellier@univ-orleans.fr Audrey Feuvrier and Azeddine Kourta
Laboratoire PRISME, 8, rue Léonard de Vinci, 45072 Orléans, FRANCE
Abstract
The performances of an original passive control system based on a biomimetic approach are assessed by investigating the flow over a bluff-body. This control device consists in a couple of flaps made from the combination of a rigid plastic skeleton coated with a porous fabric mimicking the shaft and the vane of the bird’s feathers, respectively. The sides of a square cylinder have been fitted with this system so as to enable the flaps to freely rotate around their leading edge. This feature allows the movable flaps to self-adapt to the flow conditions. Comparing both the uncontrolled and the controlled flow, a significant drag reduction (up to 22%) has been obtained over a broad range of Reynolds number. The investigation of the mean flow reveals a noticeable modification of the flow topology at large scale in the vicinity of the controlled cylinder accounting for the increase of the pressure base in comparison with the natural flow. Meanwhile, the study of the relative motion of both flaps points out that their dynamics is sensitive to the Reynolds number. Furthermore, the comparative study of the flow dynamics at large scale suggest a lock-in coupling of the flap motion and the vortex shedding.
1 Introduction
The flow over a bluff body is a situation often encountered in a large number of engineering applications such as aerodynamics of road vehicles or buildings undergoing wind loading. One of main features of bluff body flows relies on the onset of flow separation arising from either curvature or adverse pressure gradient effects. In most cases, flow separation is responsible for the alteration of the aerodynamic performances (e.g. drag increase) or structural vibrations (e.g. galloping), inducing consequently energy consumption excess and/or structural fatigue. Even though a large number of studies have been devoted to flow separation it remains one of the most challenging issue of modern fluid dynamics.
In this context, flow control appears as one of the most attractive way to prevent flow separation or at least attenuate its effects. At first glance, one can distinguish between two main classes of control strategies: passive and active [1]. By opposition to the active control, the passive control (often referred to as flow management [2]) does not require external power supply. Bearman and Owen [3] achieved up to 50% drag reduction of rectangular cylinders by introducing spanwise waviness of the front face. These authors pointed out that the vortex shedding was suppressed for an optimal wavelength, while the separated shear layer instabilities were still observed. Owen et al. [4] implemented protuberances at the surface of a circular cylinder following a helical pattern. This passive system enabled 25% drag reduction over one decade of Reynolds numbers. Recently, Shao and Wei [5] investigated the modification of the flow around a square cylinder at high Reynolds number by means of a control rod. By displacing the control rod, the authors identified the location zones where the control was efficient. Their results indicate that the maximum drag reduction (%) was achieved when the control rod was located in the separated shear layers. In that configuration, the vortex shedding was almost annihilated. Even though these examples, chosen among others, suggest that passive control can lead to significant improvements, the efficiency of this control strategy is often restricted to limited configurations. For instance, Shao and Wei [5] reported noticeable influences of the Reynolds number and the cross-section form of the control rod onto the control efficiency.
Inspired from nature observations, a new class of passive control strategy, referred to as self-adaptive passive control, has recently emerged with the pioneer works of research groups in biomimetism (see e.g. [6]). Indeed, nature provides numerous examples of passive or active control mechanisms. One can cite, for instance, the ability of fishes to optimize their hydrodynamic performances by means of riblets or compliance (see [7] for a review). Shape reconfiguration is another example of natural flow management. Alben et al. [8] and then after Gosselin et al. [9] reported huge drag reduction of flexible bodies set in a stream. Recently, Favier et al. [10] simulated the flow over a circular cylinder fitted with movable cilia at low Reynolds number. The interplay between the coating and the large scale structure in the wake implied up to 15% drag reduction. The authors observed a lock-in phenomenon of the coating motion at a frequency slightly smaller than the natural (i.e. without cilia) vortex shedding frequency. Gosselin and de Langre [11] reported an experimental investigation of the aerodynamics of a sphere fitted with a poroelastic coating. Their results showed a significant drag reduction due to the reconfiguration of the hairy surface.
Bechert et al. [6] mimicked a bird’s feather by implementing a movable flap on the upper surface of an airfoil. During their experiments, this flap was activated by the flow separation arising at high enough angle of attack. Their results revealed that using this self-adaptive passive device the stall regime was delayed. This phenomenon was recently confirmed by Schatz et al. [12] who performed numerical simulations implementing comparable movable flap. In this study, we develop and evaluate the performances of an original self-adaptive passive control device based on the works reported by Bechert et al. [6] and Schatz et al. [12]. Our system consists in a couple of porous flaps designed to mimic the main features of bird’s feathers. This control system is fitted on the sides of a square cylinder model which is well documented in literature. The experimental set-up is made in such way that the control flaps can freely rotate around their leading edge. This system is therefore activated by the flow separation arising at the corners of the square cylinder [13]. The work reported here is dedicated to the investigation of the control system dynamics and its interplay with the flow. A specific attention is given to the aerodynamic performances of the controlled square cylinder.
The paper is organized as follows. The experimental set-up and the measurements techniques are detailed in Sec. 2. The main features of the uncontrolled flow are described in Sec. 3 and will provide a reference case. Then, the design of the original control system developed in this study is introduced in Sec. 4. A particular focus is given to the dynamics of the control system with respect to the flow conditions. Finally, the efficiency of this system is assessed in Sec. 5 over a broad range of flow conditions.
2 Experimental set-up
2.1 The experimental facility
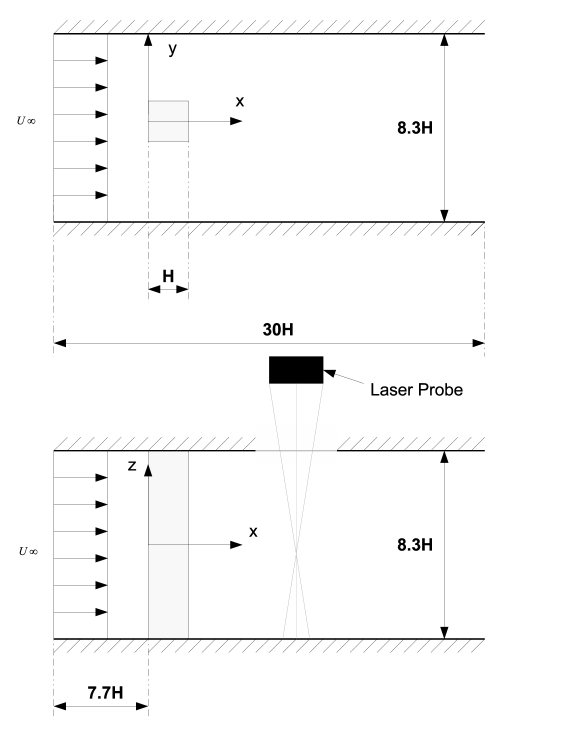
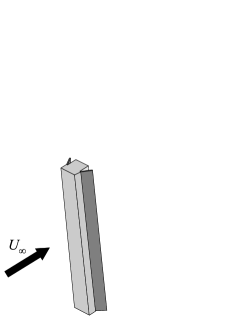
Experiments were conducted in a subsonic open-loop wind tunnel (see Fig. 1). The working section is 2m long with a square cross-section of 50cm in width. The combination of a settling chamber equipped with honeycomb and screens followed up with a (16:1) contraction located in front of the working section ensured a very low residual turbulence level (%). The free-stream velocity is inferred from the pressure drop measured in the contraction. The maximum reachable velocity is 60m/s with the wind tunnel free of obstacle. As shown in Fig. 2, the roof of the working section is equipped with a movable glass window enabling velocity measurement via an optical technique (see below for more details).
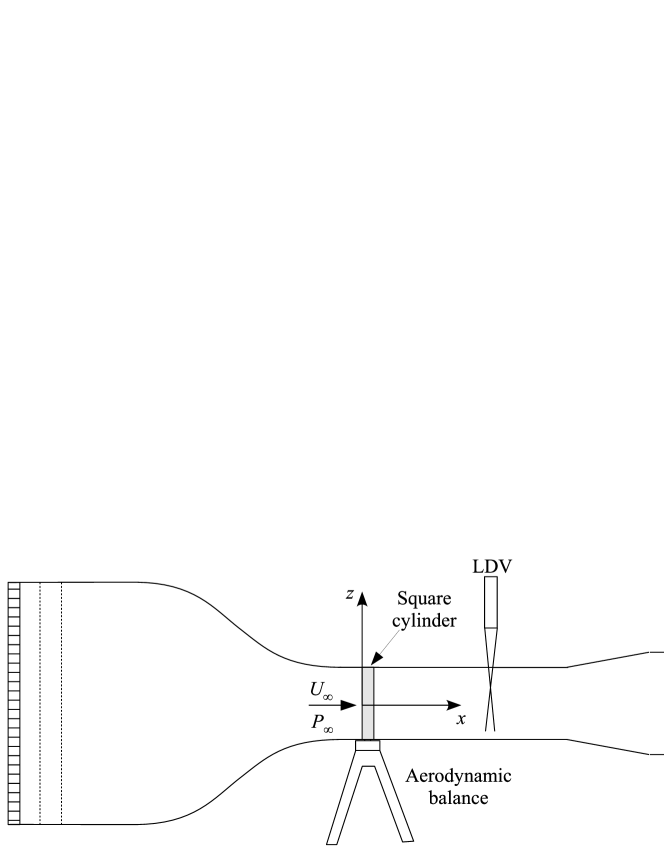
Two aluminum cylinders with a square section were used in the framework of this study. One of these models was used as a reference, while the other was fitted with the control system introduced in the next section. The width of the cylinders was equal to 60mm and their front face were located around 8 downstream from the working section inlet. The cylinders almost spanned the channel resulting in a blockage ratio of 12% and an aspect ratio of 8.3. In this study, the Reynolds number (with the kinematic viscosity) was varied over the range to . The origin of the coordinate system used in the following coincides with the center of the front face of the cylinder as displayed in Figs. 1 and 2. The axis of each cylinder was aligned with gravity (i.e. -direction here).
2.2 The measurement techniques
The velocity field in the vicinity of the square cylinder is investigated by means of two-components (514.5nm, 488nm) Laser Doppler Velocimetry (LDV) system with a 6W Argon-Ion laser (Spectra-Physics, Stabilite 2017) as light source. The flow seeding was ensured by saturating the wind tunnel room with olive oil droplets (m in diameter) generated by a particle seeding apparatus. The LDV probe was mounted on a 3D traversing system controlled by a computer and data were collected in the backward mode and processed with a BSA processor (Dantec) set in a non-coincident single measurement per burst mode. Velocity measurements were performed in the horizontal mid-plane (i.e. ) of the working section. The constraints induced by the model geometry and the set-up configuration prevented us to probe the wall normal velocity closer than from the cylinder surface, while the wall tangential velocity was probed up to from this surface. The characteristic length scales of the measurement volume were in and directions and 1mm in direction. For each measurement point, several parameters such as the photomultiplier intensity and/or the window filtering were adjusted to optimize the mean data rate. Regarding the investigated region of the flow, the sampling rate was ranging from 2kHz to 20kHz resulting in time-series lasting between 50s (close to the cylinder) and 5s (in the free stream), respectively. These values were high enough to resolve the large scale flow dynamics. The LDA technique is known to produce non-equidistant time samples avoiding consequently a direct spectral analysis (Fourier transform). To overcome this drawback, a linear interpolation method was used to recover uniformly sampled data in order to investigate the large scale dynamics of the flow since this procedure only alters the high frequency range.
The global aerodynamics efforts acting on the square cylinder were obtained using a six internal components balance which was calibrated separately with masses covering the entire range of force measured in this study. The force signal was collected by means of a 12-bits data acquisition card with a sampling rate set at 10Hz. For each measurement, the integration time was equal to 60s. The time averaged force was then calculated by subtracting the residual force recorded with flow at rest over 30s before and after each measurement point. The uncertainties were estimated to lie within the range 2% (highest ) to 10% (lowest ).
Besides the force measurement, the pressure distribution around the square cylinder was investigated by means of 46 taps distributed in the mid-span of the model. Pressure taps were connected to a multiplexed pressure transducer (Scanivalve, CTRL2/S2-S6) through 1m long tubing of 1.6mm inner diameter. The pressure reference, , measured at the inlet of the working section was also connected to the pressure transducer such that the collected signal was the differential pressure . To improve the signal to noise ratio, the pressure signal was amplified and then low-pass filtered before being stored via a 16-bits data acquisition card. The sampling rate and the integration time were set at 1kHz and 30s, respectively.
3 The natural or uncontrolled flow
This section is dedicated to the investigation of the flow around the square cylinder without the control system. In the following, this configuration is referred to as either the natural or the uncontrolled flow.
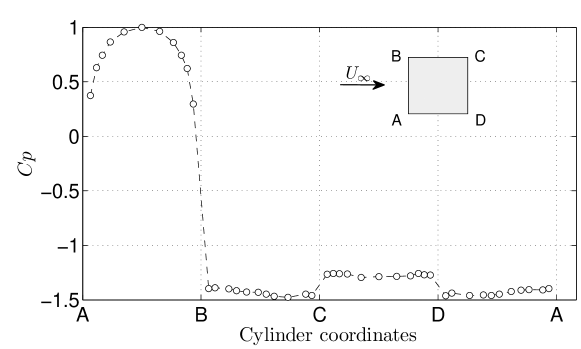
It is well known that the forces acting on bluff bodies are mainly dominated by pressure forces [14] unlike streamlined bodies where viscous forces are not negligible. Therefore, in this study, the pressure coefficient is used as a relevant variable allowing for the characterization of the local fluid force exerted on the square cylinder. The distribution of around the uncontrolled cylinder measured for is displayed in Fig. 3. For sake of simplicity, the faces of the square cylinder have been decomposed as the front face (AB), the base (CD) and the sides (BC and DA). It is worth noticing that the pressure distribution is symmetric with respect to the axis meaning that the mean lift is null. Therefore, for convenience, we only focus on the half cylinder (i.e. ) in the following.
As expected, the front face AB is featured by a strong pressure level where the maximum value corresponds to the stagnation pressure. The sudden pressure drop observable at corner B results from the flow separation due to the sharp curvature of the model. This flow separation induces the formation of a recirculation region on the side of the square cylinder. This is well supported by the profiles of the normalized streamwise mean velocity plotted in Fig. 4 which exhibit a region close to the side wall (here BC) where the streamwise velocity is negative. Note that for convenience, we introduce the wall location such that stands for the distance from the wall. Our results fairly well agree with those of Lyn and Rodi [13] which have been added in Fig. 4 for comparison.
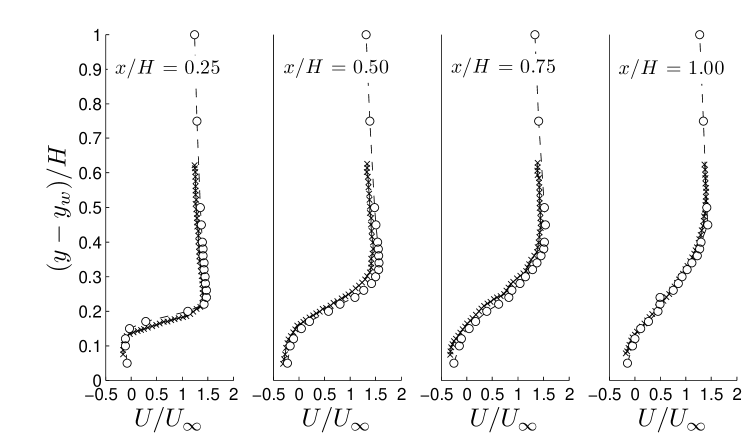
The typical size of the recirculation region may be characterized by the location of the velocity bulge observable for the three first streamwise distances in Fig. 4. One can see that the recirculation region grows with increasing distance until which coincides with the minimum pressure level (see Fig. 3). This specific position is representative of the location of the vortex core (, hereafter) featuring the recirculation region on the cylinder side as illustrated in Fig. 5.
The low pressure plateau on the base (CD) of the model is due to the presence of another recirculation region. It is important to note that the drag force is induced by the asymmetry of the pressure distribution between the front and the base faces. The near wake of the uncontrolled cylinder can be characterized by the points and introduced in Fig. 5. The former represents the vortex core position of the flow recirculation on the base, while the latter stands for the location of the stagnation point delineating the recirculation region in the wake.
In addition to the mean flow topology, the dominant dynamics of the flow around the uncontrolled square cylinder has also been studied. The natural vortex shedding frequency of the flow, , was determined using a spectral analysis of the velocity signal as illustrated in Fig. 6 for several . The related natural Strouhal number () remains almost constant () over the range of used here. This value falls into the range reported in literature (see e.g. [15]).
4 The passive control system
4.1 The design
The control system investigated in this study which consists in a couple of flaps has been designed to mimic some features of bird’s feathers. For that purpose, the flaps are built from the combination of a rigid frame and a porous fabric simulating the shaft and the vane, respectively. A schematic of the control flap is given in Fig. 7.

Besides the reference square cylinder, a similar model has been fitted with this original control system. Each flap is set on one side of the controlled square cylinder at a distance downstream from the corners A or B. The flaps are fixed to the cylinder by means of tape such that they can freely rotate around their leading edge. An illustration of the experimental set-up of the control system is given in Fig. 7. In this study, the chord and the thickness of the flaps are equal to 35mm and 2mm, respectively. Their wingspan is slightly smaller than the square cylinder span in order to prevent friction on the wind tunnel walls. Note that all experiments have been performed with the square cylinder axis aligned with the gravity and that the sides of the controlled square cylinder have been machined such that, when the fluid is at rest, the flaps fit into the walls.
According to the results reported in Sec. 3, when the fluid passes around the model, the side walls of the cylinder are subjected to a low pressure level inducing a suction effect. For high enough , the suction is sufficiently intense to activate the movable flaps which depart from the cylinder surface and then flutter around a mean position. As no external power supply is required to activate our control system, the latter is referred to as a self-adaptive passive control device. The rigid frame which is made from solid ABS (rapid prototyping) has been designed to stiffen the flap in order to prevent waviness during the flap motion. Meanwhile, in order to lighten the flap, the ratio of the area covered by its solid structure to the reference surface has been restricted to about 50% (see Fig. 7). The porous fabric which is used to mimic the vane of the bird’s feather is made from a commercial silk covering the entire flap area . To avoid the propagation of spanwise waves, the fabric is glued onto the solid frame.
Note that even though three different positions of the fixation have been tested, we only report the results obtained for 25mm which has been found to be the most efficient. It is worth noticing that at this specific position, the center of the flaps roughly coincides with the location of the vortex core introduced in Fig. 5.
4.2 The flap dynamics
In order to understand the coupling between the flow and the control system, the dynamics of the movable flaps has been investigated. For that purpose, the time evolution of the position of the flaps has been evaluated on images recorded by means of a camera with a sampling rate of 300 frames per second. This sampling rate is at least 8 times larger than the highest vortex shedding frequency observed for the natural flow (see Sec. 3).
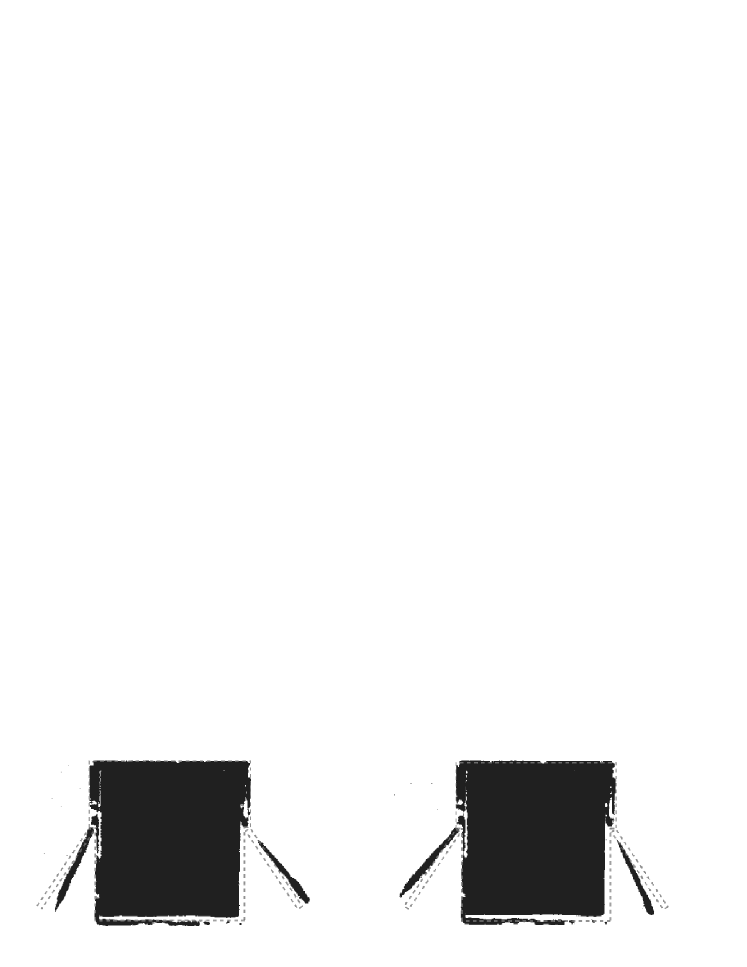
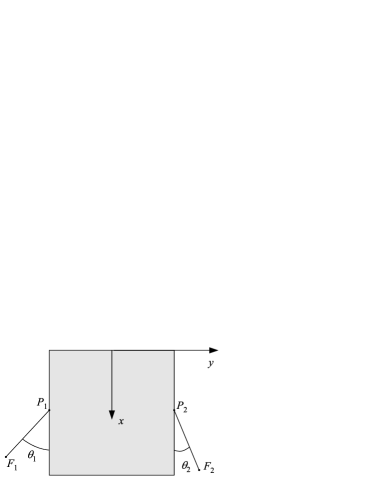
The motion of both flaps is illustrated in Fig. 8 which shows two typical positions reached by the movable flaps for . For comparison, the average position of the flaps has been drawn (dashed contour). One can see that significant departures from the average position are achieved during the experiments. Note that for helping the comparison, a threshold procedure has been designed to convert the original images into binary images.
The dynamics of the movable flaps is featured by the time evolution of the angle where the subscript equals either 1 or 2 depending on which flap is considered. A schematic of the geometrical representation is given in Fig. 9. Furthermore, we introduce the local coordinate system related to the average position of the flaps, i.e. (where stands for the time average), as shown in Fig. 9. In these diagrams, the points represent the pivot on which the flaps rotate, while the points denote the instantaneous position of the tip of the flaps.
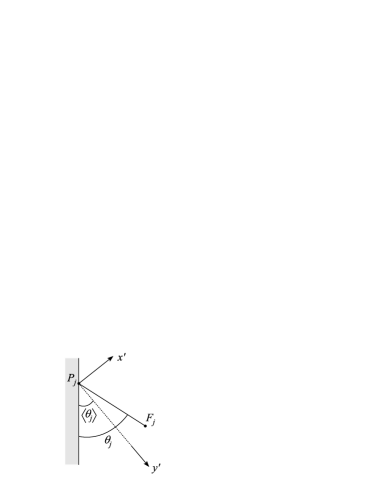
A specific algorithm has been developed to recover the time-series by evaluating the positions of the flaps on each snapshot. The uncertainties associated to this procedure has been estimated to be lower than 2%. The instantaneous location of the points in the local coordinate system can therefore be defined as follows:
| (1) |
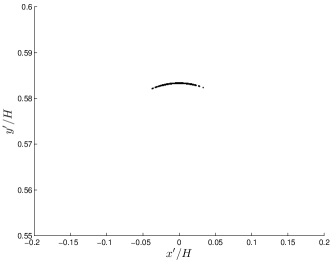
The dimensionless trajectories of the points calculated according to Eq. (1) for , and are plotted in Figs. 10, 10 and 10, respectively. These results indicate that the amplitude of the rotation around the equilibrium state, i.e. and , increases with increasing .
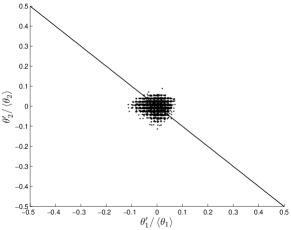
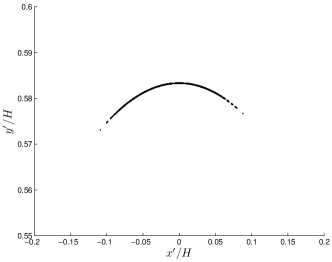
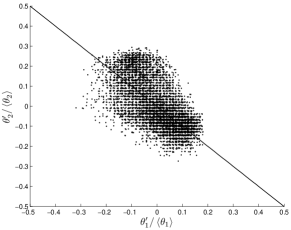
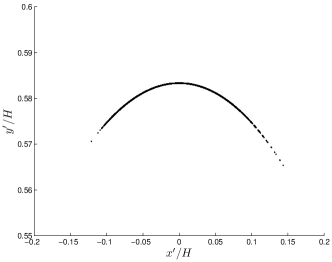
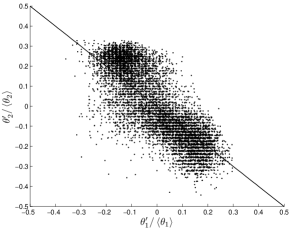
In order to highlight this behavior, we introduce the fluctuating angle such as . The deviation from the equilibrium state can therefore be quantified by the scatter plots of the normalized fluctuating angles as displayed in Figs. 10, 10 and 10 for , and , respectively. For the lowest , the deviation from the equilibrium angle remains smaller than 10%, while it reaches up to 30% for the highest . Furthermore, these results point out a noticeable modification in the shape of the scatter plots with respect to . The elongation of the scatter plot observable beyond indicates that the motion of both flaps become dependent to each other. Indeed, the alignment of the scatter plots along the slope -1 (solid lines in Figs. 10, 10 and 10) means that the rotation of both flaps is in phase.
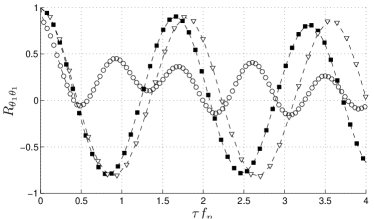
The dynamics of a single flap can be studied by means of the auto-correlation coefficient defined as follows:
| (2) |
where is the time lag. The variation of computed for several is plotted in Fig. 11. For sake of clarity, we do not report the variation of since no significant difference with has been observed. In order to highlight the differences with the natural (i.e. uncontrolled) flow, the time lag is normalized by the natural vortex shedding frequency reported previously. The shape of indicates that the rotating motion of the flaps is almost periodic for each used in this study. However, the results reported in Fig. 11 show that the dimensionless rotation frequency of the flaps is dependent on . Indeed, for the lowest , is slightly higher than the natural vortex shedding frequency (), while it is smaller for the two largest (). We discuss further these results in the next subsection.
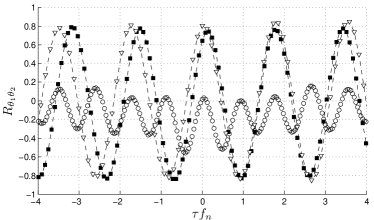
In addition to the dynamics of a single flap, the relative motion of both flaps can be quantified by means of the cross-correlation coefficient:
| (3) |
The variation of displayed in Fig. 11 confirms that both flaps move with the same frequency . However, at , the cross-correlation coefficient is almost null for meaning therefore that the flaps’ motion is not synchronous. On the contrary, the high value of observed at for , indicate that the flaps rotate in phase. For the intermediate , i.e. , one can see a slight shift in time revealing that the relative flap rotation is not exactly synchronous.
4.3 The fluid-structure coupling
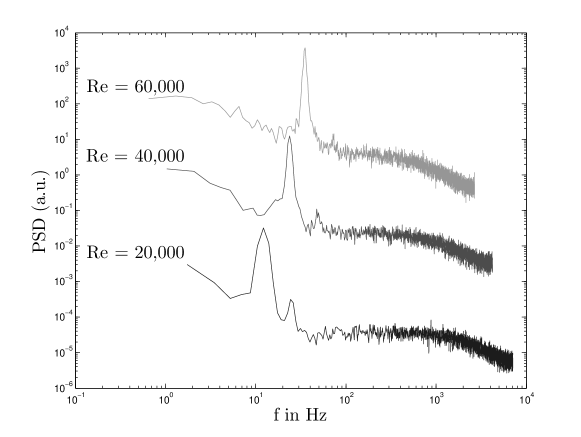
In order to compare the large scale flow dynamics with that of the movable flaps, we plot in Fig. 12 the power spectra of velocity measured in the near wake (, ) of the controlled square cylinder. In this plot, the spectral frequency is normalized by the natural vortex shedding frequency . For the lowest , i.e. , the wake is dominated by a single frequency which is comparable to the rotation frequency of the flaps as shown in the previous subsection. This frequency features the vortex shedding of the controlled flow. The related Strouhal number () deviates noticeably from the natural one () in agreement with usual observations reported in fluid/structure interactions (see e.g. [10]). For instance, studying the flow modification around a square cylinder oscillating in a stream, Bearman and Obajasu [16] revealed the occurrence of a lock-in regime between the vortex shedding and the cylinder oscillation. Such behavior was also reported by de Langre [17] who studied the linear stability of a circular cylinder subjected to vortex-induced vibrations.
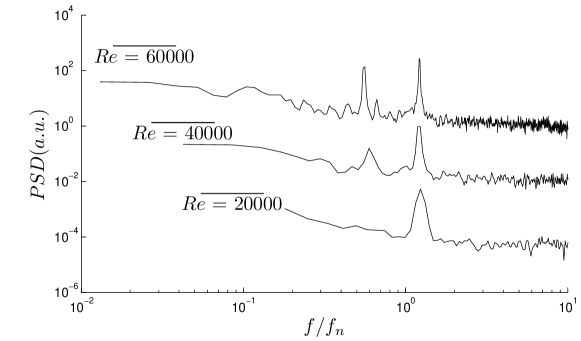
For higher , the wake remains dominated by the vortex shedding characterized by as evidenced in Fig. 12. However, another energetic mode arises at a lower frequency . This phenomenon coincides with the synchronization of the motion of both flaps (i.e. ). One can notice that the ratio increases with increasing . Meanwhile, the ratio of the energy contained in the high frequency mode (i.e. related to ) to that contained in the low frequency mode (i.e. related to ) decreases. This evolution may be interpreted as a modification of the wake pattern such as reported in vortex-induced vibration (see e.g. [18]) or in active flow control (see e.g. [19]). However, further experiments and analysis would be required in order to address properly this issue.
5 The controlled flow
This subsection is dedicated to the study of the flow subjected to the self-adaptive passive control. The results obtained for the velocity in the vicinity of the square cylinder and the pressure distribution around this obstacle are analyzed to provide a first simple mechanism of the interplay between the control system and the flow. Finally, the efficiency of the control system is evaluated by means of drag force measurement.
5.1 The flow topology modification
Fig. 13 compares the velocity profiles normal to the side of both the uncontrolled and the controlled square cylinders at for . Note that the crossing of the laser beams and the flap trajectory restricts the investigation of the velocity field to .
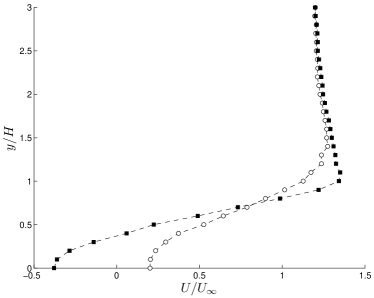
Even though the shape of both curves are similar, one can clearly remark that the recirculation region is enlarged by the control system. However, beyond , both velocity profiles collapse meaning that the outer flow is almost unaffected by the presence of the movable flaps. This is an important result implying that the blockage of the flow is identical in both the uncontrolled and the controlled cases.
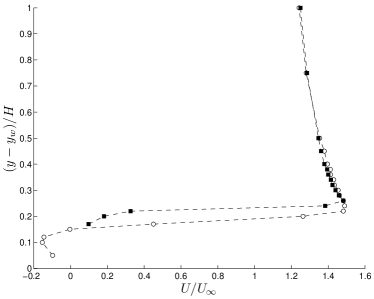
The modification of the near wake is evidenced in Fig. 13 showing the velocity profile measured for both the uncontrolled and the controlled square cylinders at for . The velocity deficit observed in both cases is a feature of wakes. However, the spreading of the uncontrolled wake is larger than that of the controlled one. Moreover, one can see that, at this position, the controlled wake is featured by a region () where unlike the uncontrolled wake. This means that the location of the stagnation point delineating the recirculation region in the wake of the cylinder has moved farther downstream in the controlled case.

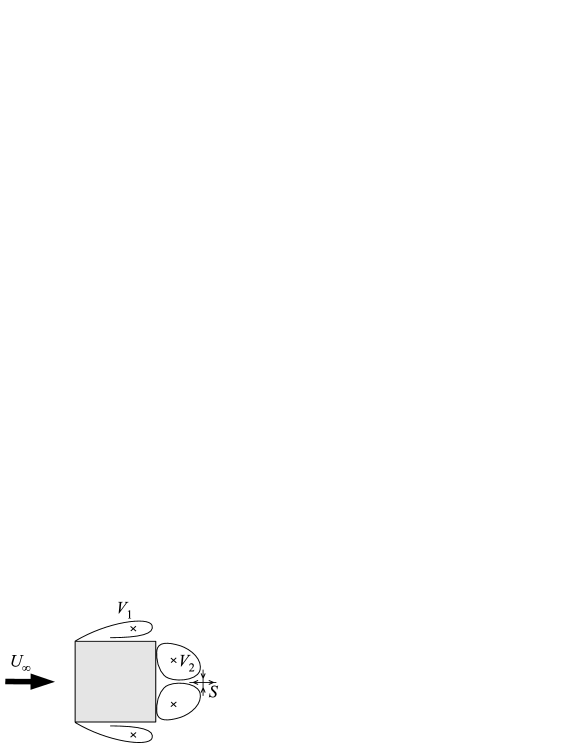
According to the results displayed in Figs. 13 and 13, we propose a simple representation of the mean topology of the controlled flow which is described in Fig. 14. In that representation, two recirculation regions are separated by the movable flaps. The vortex associated to which is expected to be at the origin of control activation is pushed upstream by the flap motion. Meanwhile, the pressure level downstream from the flaps (i.e. right-hand side in Fig. 14 is expected to increase due to the pressure drop induced by the fluid passing through the porous fabric. As a consequence, the vortex core of the second recirculation region, and by the way the stagnation point , are expected to move downstream their positions in the uncontrolled case.
5.2 The drag force reduction
In order to assess that simple mechanisms, the pressure distribution around the controlled cylinder is compared to that obtained for the uncontrolled one as shown in Figs. 15-15 for several .
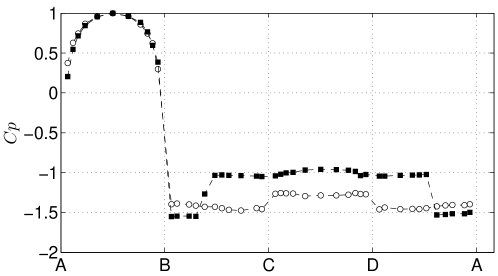
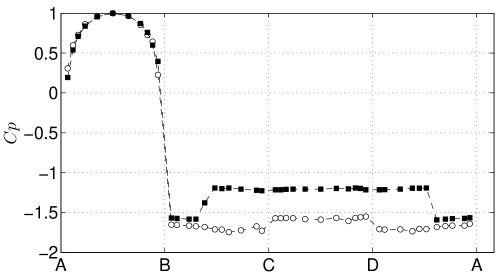
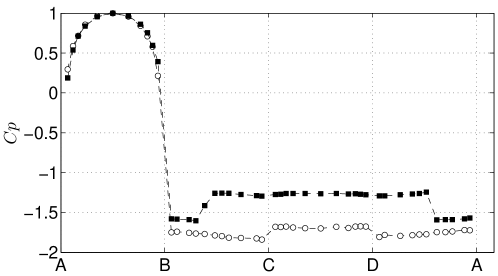
One can see that, independently of , the control system significantly modifies the pressure distribution on the lateral sides (i.e. BC and DA) and the base (i.e.CD) as well, whereas the stagnation face (i.e. AB) is unaffected. The pressure jump visible on the both sides of the controlled cylinder coincides with the position of the leading edge of the movable flaps. Assuming that each flap can be assimilated to a screen with a given blockage ratio and that is representative of the pressure drop across the flaps, it comes [20]
| (4) |
where is the dimensionless pressure jump and a dimensionless function. The evolution of computed from the pressure distribution is plotted in Fig. 16 with respect to .
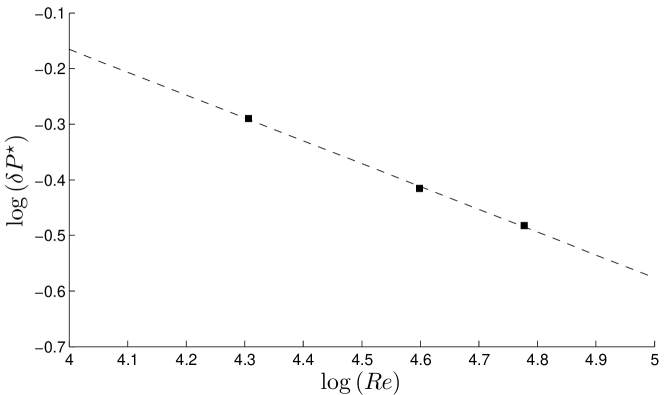
This plot points out that the normalized pressure drop decreases with increasing in agreement with the results reported by Groth and Johansson [21]. In the present study, the fitting (in the least-mean square sense) of our experimental data yields
| (5) |
where and , at least for the range of tested here. According to this result, the pressure drop evolves like . However, one can notice that the pressure upstream from the flap (left-hand side in Fig. 14) remains almost constant with respect to . This confirms that the pressure downstream from the flap (right-hand side in Fig. 14) increases with increasing . However, we stress that care should be taken in extrapolating this trend to higher . More data are required for a conclusive assessment of this issue which is therefore left for future study.
The increase of the pressure level on the base of the controlled cylinder results from the downstream displacement of the vortex core as illustrated in Fig. 14. The main consequence of this phenomenon is the reduction of the drag force. In order to evaluate the efficiency of the control system, the drag coefficient ( with the drag force) has been measured by means of static load balance in both the uncontrolled and the controlled configurations. Fig. 17 shows the evolution of as a function of . It is worth noticing that the values reported in this study are not corrected for the blockage effect (see e.g. [22]). However, we have checked that the differences between the uncontrolled and the controlled cases are not affected by these corrections. This can be explained by the fact that the control system does not change the blockage ratio as evidenced by the velocity profiles shown hereinbefore.
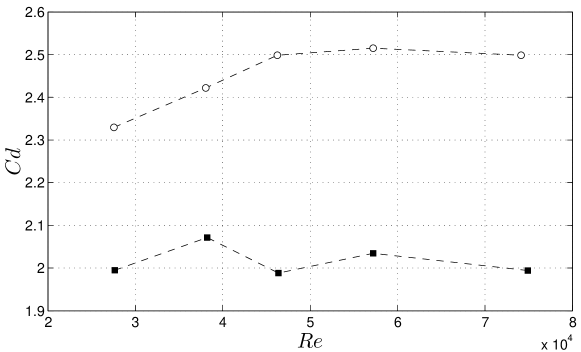
Fig. 17 evidences that the control system developed in this study improves significantly the aerodynamics of the square cylinder. Indeed, the drag reduction equals about 22% in average over the entire range of used in this study. This value is comparable to that reported by Shao and Wei [5] for similar . Furthermore, these results confirm that the control seems more efficient with increasing .
6 Conclusions
An original passive control system consisting in a couple of porous flaps has been developed and fitted on a square cylinder in such a way that the flaps can freely rotate around their leading edge. These flaps have been designed to mimic the main features of bird’s feathers, i.e. the stiffness of the shaft coupled with the porosity of the vane. This goal has been achieved by assembling a rigid and light plastic skeleton with a porous fabric.
The device developed here can be assimilated to a self-adaptive passive control system as it is activated by the vortex induced by the flow separation arising on the side of the square cylinder. Due to a suction effect, the flaps depart from the cylinder walls and flutter around a mean position. The dynamics of the movable flaps has been investigated with respect to the Reynolds number. It has been shown that the amplitude of the flap motion increases with increasing Reynolds number. Furthermore, for low Reynolds number the rotation frequency of both flaps is slightly higher than that of the natural vortex shedding even though their motion seems asynchronous. However, the study of the relative motion of both flaps has revealed that for high enough Reynolds number the flaps rotate in phase at a frequency almost twice as small than the natural vortex shedding frequency. The spectral analysis performed in the near wake of the cylinder has exhibited a lock-in coupling between the flow and the movable flaps.
The efficiency of the control system has been evaluated by investigating the drag force. Comparing both the uncontrolled and the controlled cases, about 22% drag reduction has been obtained over the entire range of Reynolds numbers tested in this study. The investigation of the pressure distribution measured around the square cylinders have evidenced that this enhancement of the aerodynamic performances can be accounted for the increase of the pressure level on the base of the controlled cylinder. A simple mechanisms accounting for this phenomenon has been suggested. In this scenario, the pressure drop across the porous fabric induces an increase of the pressure level downstream the flaps. As a consequence, the vortex core of the recirculation region in the wake is expected to move downstream resulting in the increase of the base pressure. This scenario is supported by the evolution of the mean velocity reported in the wake.
Even though the results presented in this study are encouraging, further works are required to get a better understanding of the control system and the flow. For that purpose, the influence of relevant parameters such as the fabric porosity, for instance, will be investigated in future.
Acknowledgements
The authors are grateful to Mr. S. Loyer for his assistance concerning the experiments.
References
- [1] H. Choi, W.P. Jeon, J. Kim, Control of flow over a bluff body, Ann. Rev. Fluid Mech. 40 (2008) 113-139.
- [2] M. Gad-el Hak, Flow Control: Passive, Active and Reactive Flow Management, Cambridge University Press, London (2000).
- [3] P.W. Bearman, J.C. Owen, Reduction of bluff-body drag and suppression of vortex shedding by the introduction of wavy separation lines, J. Fluids Structs. 12 (1998) 123-130.
- [4] J.C. Owen, P.W. Bearman, A.A. Szewczyk, Passive control of VIV with drag reduction, J. Fluids Structs. 15 (2001) 597-605.
- [5] C.P. Shao, Q.D. Wei, Control of vortex shedding from a square cylinder, AIAA Journal 46 (2008) 397-407.
- [6] D.W. Bechert, M. Bruse, W. Hage, R. Meyer, Fluid mechanics of biological surfaces and their technological application, Naturwissenchaften 87 (2000) 157-171.
- [7] F.E. Fish, G.V. Lauder, Passive and active flow control by swimming fishes and mammals, Ann. Rev. Fluid Mech. 38 (2006) 193-224. 247 266.
- [8] S. Alben, M. Shelley, J. Zhang, Drag reduction through self-similar bending of a flexible body, Nature 420 (2002) 479-481.
- [9] F.P. Gosselin, E. de Langre, B.A. Machado-Almeida, Drag reduction of flexible plates by reconfiguration, J. Fluid Mech. 650 (2010) 319-341.
- [10] J. Favier, A. Dauptain, A. Basso, A. Bottaro, Passive separation control using a self-adaptive hairy coating, J. Fluid Mech. 627 (2009) 451-483.
- [11] F.P. Gosselin, E. de Langre, Drag reduction by reconfiguration of a poroelastic system, J. Fluids Structs. (2011) in press.
- [12] M. Schatz, T. Knacke, F. Thiele, R. Meyer, W. Hage, D.W. Bechert, Separation control by self-activated movable flaps, AIAA Paper (2004) 2004-1243, Reno.
- [13] D.A. Lyn, W. Rodi, The flapping shear layer formed by flow separation from the forward corner of a square cylinder, J. Fluid Mech. 261 (1994) 353-316.
- [14] A. Roshko, On the wake and drag of bluff bodies, J. Aerosp. Sci. 22 (1955) 124-132.
- [15] C. Norberg, Flow around rectangular cylinders: pressure forces and wake frequencies, J. Wind Eng. Ind. Aero. 49 (1993) 187-196.
- [16] P.W. Bearman, E.D. Obasaju, An experimental study of pressure fluctuations on fixed and oscillating square-section cylinders, J. Fluid Mech. 119 (1982) 297-321.
- [17] E. de Langre, Frequency lock-in is caused by coupled-mode flutter, J. Fluids Structs. 22 (2006) 783-791.
- [18] T.L. Morse, C.H.K. Williamson, Prediction of vortex-induced vibration response by employing controlled motion, J. Fluid Mech. 634 (2009) 5 39.
- [19] M. Pastoor, L. Henning, B.R. Noack, R. King, G. Tadmor, Feedback shear layer control for bluff body drag reduction, J. Fluid Mech. 608 (2008) 161-196.
- [20] E.M. Laws, J.L. Livesey, Flow through screens, Ann. Rev. Fluid Mech. 10 (1978) 247 266.
- [21] J. Groth, A.V. Johansson, Turbulence reduction by screens, J. Fluid Mech. 197 (1988) 139 155.
- [22] E.C. Maskell, A theory of the blockage effects on bluff bodies and stalled wings in a closed wind tunnel, R.A.E. Aero. Rep. no. 2685. (1963).