Atomistic simulations of electrolyte solutions and hydrogels with explicit solvent models
1 Introduction
Two of the most challenging tasks in molecular simulation consist in capturing the properties of systems with long-range interactions (e.g. electrolyte solutions), and of systems containing large molecules such as hydrogels. These tasks become particularly demanding when explicit solvent models are used. Therefore, massively parallel supercomputers are needed for both tasks.
For the development and optimization of molecular force fields and models, a large number of simulation runs have to be evaluated to obtain the sensitivity of thermodynamic properties with respect to the model parameters. This requires both an efficietn work flow and, obviously, even more computational resources. The present work discusses the force field development for electrolytes regarding thermodynamic properties of their solutions. Furthermore, simulation results for the volume transition of hydrogels in solution containing electrolytes are presented. Both applications are of interest for engineering. It is shown that the properties of these complex systems can be reasonably predicted by molecular simulation.
2 Development of force fields for alkali and halogen ions in aqueous solution
2.1 Outline
The simulation of electrolyte systems is computationally very expensive due to the long-range interactions, which have to be taken into account by suitable algorithms. Examples of such algorithms are the classical Ewald summation Ewald1921 and its derivatives like particle mesh Ewald summation Darden1993 or the particle particle/particle mesh method Eastwood1980 .
Early efforts in this research area were mainly directed to the development of ion force fields, which were capable of reproducing static structural properties of solutions Rao1990 ; Fumi1964 ; Dang2002 . Recently, however, these models have been proven to be too inaccurate for the prediction of basic thermodynamic properties Hess2006 ; Walter2010 . Since the models were parameterized solely at short distances, long distance effects are underestimated. These effects can be seen in particular in the density and the activity of electrolyte solutions.
In the present work new atomistic models for alkali and halogen ions are presented, which accurately describe not only structural properties of aqueous electrolyte solutions but also basic thermodynamic properties like their density. The main focus of the model development is placed on transferability, i.e. the ion models are intended to describe solution properties independently of the cation/anion combination.
The ions were modeled as Lennard-Jones (LJ) spheres with superimposed charges of ±1 in units of elementary charges, located in the center of mass. For the solvent water, the SPC/E model Berendsen1987 was used, which consists of one LJ site and three point charges.
2.2 Simulation details
All simulations in Section 2 were performed using the Monte-Carlo technique in the isobaric-isothermal () ensemble at 20 ∘C and 0.1 MPa. The simulation volume contained a total of 1000 molecules and ions, respectively. The electrostatic long-range interactions were calculated using the Ewald summation with an Ewald parameter of 5.6/, where denotes the length of the cubic simulation volume. The dispersive and repulsive long-range contributions were approximated using the assumption of an homogeneous fluid beyond the cut-off distance of 11.9 Å. The simulation program employed was an extended version of deublein2011 .
2.3 Solvent model and reduced properties
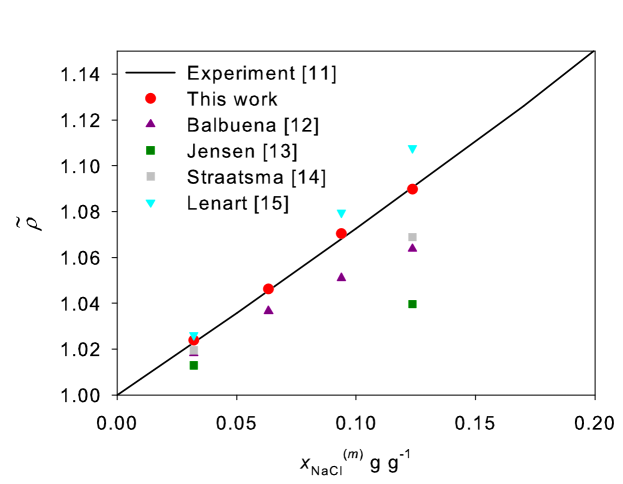
For the calculation of aqueous electrolyte solutions, the model for water is crucial, since it represents the largest fraction in the mixture. The SPC/E Berendsen1987 water model was employed, which reproduces the density and other thermodynamic properties at chosen conditions in good agreement with experimental data ( = 999.5 g/l). To minimize the influence of errors in the solvent model on the parameterization of the ion force fields, the reduced density of the aqueous solution was chosen as objective function, which is defined as the fraction of the density of the electrolyte solution and the density of the pure solvent at the same temperature and pressure
| (1) |
Figure 1 shows a typical plot of the reduced density of an aqueous electrolyte solution as a function of salt mass fraction using sodium chloride as an example. The dependence of with is almost linear. It can also be seen from Figure 1 that electrolyte force fields from the literature predict this linear correlation, but with a wrong slope. Note also that the solvent activity (or activity coefficient) can be regarded as a normalized property. However, a similar approach fails for properties like the ion self-diffusion coefficient.
2.4 Ion force field
A global parameterization strategy was used in the present study. Due to the simple model for the ions, the overall parameter space is small. It contains the two LJ parameters and for each ion. The position and magnitude of the charges are constant. In a preliminary analysis, the sensitivity of the reduced density on the Lennard-Jones parameters was evaluated. It shows that the influence of the LJ energy parameter on is very small. Therefore, the parameters were determined by a fit to the reduced density, while the parameters were set here to a constant value, i.e. 200 K for sodium and chloride, based on results of a study on the water activity in the electrolyte solution, which is not described in detail here.
The objective function of the optimization used to determine the LJ parameters is the slope of the reduced density with increasing salt mass fraction at
| (2) |
In molecular simulations, these slopes were systematically derived for varying values of and . The data were smoothed by a two dimensional polynomial fit. The ion parameters for all alkali and halogen ions were chosen such that the sum of the squared deviations between the functional fit and the experimental data is minimized.
2.5 Results
New atomistic models for alkali and halogen ions were determined that describe the reduced density of the aqueous electrolyte solution in good agreement with experiments. As an example the force field for sodium chloride is shown in Table 1. Figure 1 shows the excellent agreement between the simulation using the new model and the experimental results.
| Ion | / Å | / K | |
|---|---|---|---|
| Na+ | 1.88 | 200 | |
| Cl- | 4.41 | 200 |
The new atomistic models for alkali and halogen ions were investigated regarding the representation of structural properties of aqueous solution. Radial distribution functions were used for the characterization which are defined by
| (3) |
Here is the density of component as a function of the distance between two ions of component and , respectively, and is the number density of component in the bulk phase. For the characterization of aqueous electrolyte solutions, the radial distribution function of water around the ions is of particular interest. In this case, water is represented by the position of the oxygen atom. For a solution of sodium chloride in water, is shown in Figure 2.
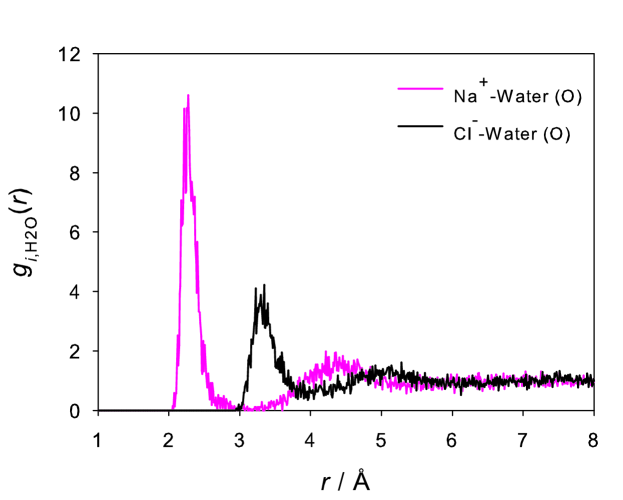
The locations of the first maximum and minimum, respectively, for both ions are in good agreement with experimental measurements Marcus1988 , as shown in Table 2. The hydration shell of the cation is more attached to the ion than of the anion, which is represented by the height of the first peak in the distribution function.
| Ion | / Å | / Å | / Å | / Å | |
|---|---|---|---|---|---|
| Na+ | 2.2 | 2.3 | 3.0 | 3.0 | |
| Cl- | 3.4 | 3.3 | 3.9 | 4.0 |
The attraction of the solvent to the cation is also visible in the hydration number around the ions, which describes the number of solvent molecules in the closest vicinity to the solute and is defined by
| (4) |
Here, defines the number density of component and the distance up to which the hydration number is calculated. For the first shell, the value of is chosen to be the distance of the first minimum in the radial distribution function. For sodium chloride for example, the calculation of hydration numbers reproduces experimental results in good agreement, cf. Table 3.
| Ion | |||
|---|---|---|---|
| Na+ | 5.6 | 5 - 6 | |
| Cl- | 7.5 | 7 - 8 |
2.6 Computational demands
Typical simulations to generate data points for the studies discussed in Section 2 were carried out on 16 CPUs running for 72 hours. For the prediction of other thermodynamic data like activity coefficients, up to 32 CPUs running for 72 hours depending on the system are required. For these simulations a virtual ram of 216 MB was required.
3 Self-diffusion coefficients of solutes in electrolyte systems
3.1 Outline
The self-diffusion coefficient is, in comparison to the density, an individual property of the different solute species and
the solvent in electrolyte systems. Self-diffusion coefficients of anions and cations in aqueous solution are experimentally accessible and numerous experimental data are available in the literature dna_wang ; dcl_nielsen . Therefore, it is worthwhile trying to fit model parameters of ion force fields to self-diffusion coefficient data. As a suitable strategy for determining the size parameters is available (cf. Section 2), the question may be raised whether self-diffusion coefficient data are useful for determining the energy parameters .
In molecular simulations, the self-diffusion coefficient is usually determined by time and memory consuming methods, which require simulations of large systems. Examples for such methods in equilibrium molecular dynamics are the mean square displacement mean_square and the Green-Kubo formalism green ; kubo . In this formalism, the self-diffusion coefficient is related to the time integral of the velocity auto-correlation function. The calculation of self-diffusion coefficients of solutes in electrolyte systems are computationally expensive due to additional time consuming algorithms (e.g. Ewald summation Ewald1921 ) that allow for a truncation of ionic interactions in molecular simulations.
In aqueous solution, the cations and anions are surrounded by a shell of strongly bonded water molecules (hydration shell).
These hydrated ions diffuse within a bulk fluid, which is itself also highly structured. Therefore, the mobility and accordingly the self-diffusion coefficient of ions is strongly related to the structure of the water molecules around the ions structure_koneshan .
3.2 Methods
The investigated solution consisted of sodium and chloride ions as solutes and explicit water as solvent. The ions were modeled as Lennard-Jones spheres with a central charge. Size parameters for different ion force fields were determined as discussed in Section 2. The energy parameter was modified in a range of 50 to 250 K. Water models were taken from the literature.
First, the density of the solution was determined in an isobaric-isothermal (NpT) molecular dynamics (MD) simulation at a desired temperature and pressure. Then, the velocity auto-correlation function and, according to the Green-Kubo formalism green ; kubo , the self-diffusion coefficients were determined in an isochoric-isothermal (NVT) MD simulation at this temperature and density. The sampling length of the velocity auto-correlation function was set to 11 ps and the time span between the origin of two auto-correlation functions was 0.06 ps. The separation between the time origins was chosen such that all autocorrelation functions have decayed at least to 1/e of their normalized value. For both NpT and NVT simulations, the molecular dynamics unit cell with periodic boundary condition included 4420 water molecules, 40 sodium and 40 chloride ions. The long-range charge-charge interactions were calculated using Ewald summation Ewald1921 . The simulation program employed was an extended version of ms2 deublein2011 , which is developed by our group.
3.3 Results
The self-diffusion coefficients of anions and cations determined in molecular simulation largely depend on the used molecular model of water, as the mobility of the ions is influenced by the hydration shell and the structure of the surrounding water.
Self-diffusion coefficient of water models
The accuracy of the estimated self-diffusion coefficients of pure water for different water models is verified with respect to experimental data waterexp . The self-diffusion coefficients were determined with the Green-Kubo formalism green ; kubo in molecular dynamics simulations at a temperature of 25 ∘C and a pressure of 0.1 MPa. For this study, three commonly used rigid nonpolarizable molecular water models of united-atom type, namely SPC/E Berendsen1987 , TIP4P tip4p and TIP4P/2005 tip4p2005 , were chosen.
| Model | SPC/E | TIP4P | TIP4P/2005 | Experiment |
| [] | 26.2 (1) | 36.7 (2) | 21.9 (1) | 22.3 (-) |
The determined self-diffusion coefficients of the different water models vary over a wide range, cf. Table 4. For TIP4P/2005, the self-diffusion coefficient of pure water is in good agreement with the experimental value. In contrast, both the SPC/E and the TIP4P model overestimate the mobility of water molecules in pure water. The obtained values for the self-diffusion coefficient are in good agreement with the results published by other authors waterguevara .
Model development
For fitting the energy parameter of the ion force fields to experimental self-diffusion coefficients of anions and cations in aqueous solution, the influence of on the determined self-diffusion coefficients in molecular simulations was investigated. In this study, the above mentioned three water models were used.
However, it turned out that the number for the energetic parameter has no significant influence on the self-diffusion coefficient. This study is not discussed here in detail. In the following, = 200 K is used. The results for both sodium and chloride are shown in Figure 3.
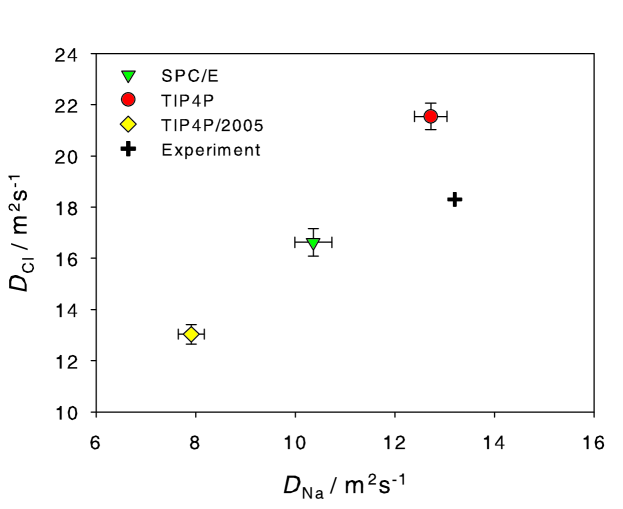
As can be seen in Table 4 and Figure 3, there is no correlation between the accuracy of the determined self-diffusion coefficient of pure water and the accuracy of the estimation of ion mobility for the different water models. For example, the TIP4P model significantly overestimates the self-diffusion coefficient of pure water, whereas the simulation results for the self-diffusion coefficients of the sodium and the chloride ion are in fair agreement with experimental data (deviation for sodium of 4%; deviation for chloride of 18%).
All water models overestimate the interaction between the water molecules in the hydration shell, the sodium ion and the bulk fluid. Hence, the cation mobility is too low. The same is true for the chloride ion only for SPC/E and TIP4P/2005 water models, whereas the TIP4P underestimates the interaction in the hydration shell.
3.4 Computational demands
All molecular simulations in Section 3 were carried out with the MPI based molecular simulation program ms2, which is developed in our group. The total computing time for determining self-diffusion coefficients of ions in electrolyte systems was 216 hours on 36 CPUs (72 hours for the NpT run and 144 hours for the NVT run). These simulations require large systems as the accuracy of the Green-Kubo formalism for ions increases with increasing number of solutes and, at the same time, an infinite dilution is aspired. For these simulation a maximum virtual memory of 1.76 GB was used.
4 Hydrogels in electrolyte solutions
4.1 Outline
Hydrogels are three-dimensional hydrophilic polymer networks. Their most characteristic property is their swelling in aqueous solutions by absorbing the solvent, which is influenced by various factors. Hydrogels can be used in many applications like e.g. superabsorbers such as in diapers Rehim_2005 and contact lenses Pavlyuchenko_2009 . To fully exploit the potential of hydrogels in all these applications, it is important to understand, describe and predict their swelling behavior.
The hydrogel which is studied in the present work is built up of poly(N-isopropylacrylamide) (PNIPAAm) cross-linked with N,N’-methylenebisacrylamide (MBA). PNIPAAm is one of the most extensively studied hydrogels in the scientific literature and is mainly used in bioengineering applications Rzaev_2007 . The degree of swelling in equilibrium of PNIPAAm is significantly influenced by many factors Huether_2004_2 ; Huether_2006 ; Mukae_1993 ; Crowther_1998 . On the one hand, the swelling depends on the structure of the hydrogel itself, like the type of the monomer, but also the amount and type of cross-linker and of co-monomers. On the other hand, the environment conditions like temperature, type of solvent, solvent composition, electrolyte concentration or pH-value of the solvent influence the swelling. Varying these factors, the hydrogel typically shows a region where it is swollen and a region where it is collapsed. In between those two regions lies the region of volume transition. The solvent composition which is characteristic for that transition is called -solvent here. The -solvent mainly depends on the environmental factors and the nature of the polymer chain but not on the amount of cross-linker.
For the quantitative description of the swelling of hydrogels, various types of models are used Wu_2004 . It is normally not possible to quantitatively predict the swelling of hydrogels or its dependence on factors the models were not adjusted to. With molecular simulation it is possible to predict the swelling of different hydrogels upon varying any environmental factor, as was shown in a previous study Walter_2010_2 .
In the present work, the swelling of PNIPAAm hydrogel is studied with atomistic molecular dynamics simulation. The results for the -solvent are compared to experimental data of PNIPAAm hydrogel as a function of the temperature in water Zhang_2005 . The experimental data shows that the -solvent of PNIPAAm in different electrolyte solutions follows the Hofmeister series. For this study the electrolyte sodium chloride (NaCl) was considered.
4.2 Models
For the molecular dynamics simulations of PNIPAAm in aqueous solutions, the OPLS-AA force field Jorgensen_1988 ; Jorgensen_1996 was employed to describe PNIPAAm. It was combined with the SPC/E water model Berendsen1987 . In previous studies, it was shown that this combination allows predicting the volume transition of PNIPAAm in water as function of the temperature Walter_2010_2 . Different NaCl models from the literature were used and compared to the NaCl model developed in this work. The used electrolyte models from the literature are GROMOS-96 53A6 (G53A6) Oostenbrink_2004_2 and KBFF Weerasinghe_2003 .
4.3 Simulation details
Molecular simulations of PNIPAAm single chains were carried out with version 4.0.5 of the GROMACS simulation package Spoel_2005 ; Hess_2008 . Simulations with PNIPAAm in aqueous NaCl solutions at 25 ∘C were performed in order to find the best NaCl model for the simulation of the volume transitions of PNIPAAm in NaCl solutions.
In a previous study, it was shown that the amount of cross-linker of the hydrogel has no significant influence on the -solvent of the hydrogel and that this value is the same as for the PNIPAAm polymer Walter_2010_2 . Therefore, the simulations can be performed with a single PNIPAAm chain. For equilibration, single PNIPAAm chains in water were simulated in the isobaric-isothermal ensemble ( over 1 to timesteps. The pressure was 0.1 MPa and was controlled by the Berendsen barostat Berendsen_1984 , the temperature was controlled by the velocity rescaling thermostat Bussi_2007 and the timestep was 1 fs for all simulations. Newton’s equations of motion were numerically solved with the leap frog integrator Hockney_1974 . For the long-range electrostatic interactions, particle mesh Ewald Essmann_1995 with a grid spacing of 1.2 Å and an interpolation order of four was used. A cutoff radius of Å was assumed for all interactions. After equilibration, to production time steps were carried out with constant simulation parameters. Note that the production steps include the conformation transition as well as the simulation of the equilibrium.
In order to analyze the results, the radius of gyration was calculated
| (5) |
which characterizes the degree of stretching of the single chain, where is the mass of site and is the norm of the vector from site to the center of mass of the single chain. The radius of gyration in equilibrium was calculated as the arithmetic mean over the last time steps of the simulation together with its standard deviation.
4.4 Results and discussion
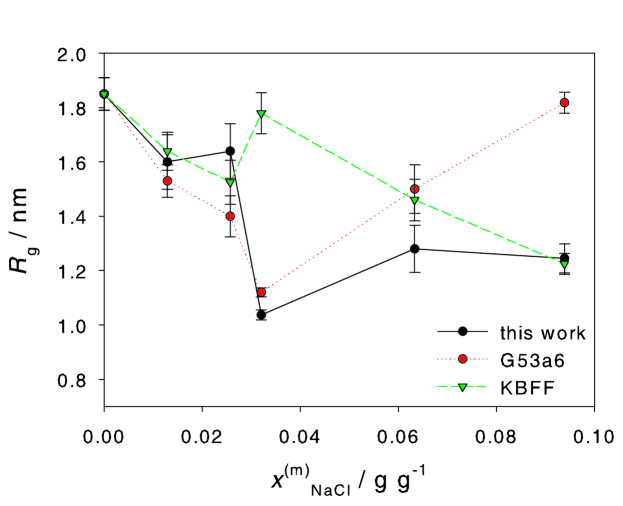
For the temperature of 25 ∘C, the hydrogel is swollen in pure water and collapsed above the NaCl concentration of about 0.03 gg-1 Zhang_2005 . Therefore, the single chain should be stretched in pure water and low electrolyte concentrations and collapsed at electrolyte concentrations above 0.03 gg-1. Figure 4 shows the simulation results as the radius of gyration over the NaCl concentration. The NaCl model from this work and G53A6 are able to predict the -solvent of PNIPAAm at a NaCl concentration of 0.03 gg-1. The NaCl model KBFF does not yield the fully collapsed conformation. The models, that show the -solvent at 0.03 gg-1 also show a more or less stretched single chain at electrolyte concentrations above this point. The model with the best results here is the one from this work, for it only yields a slightly stretched conformation of the chain at electrolyte concentrations above the -solvent.
It is therefore clearly possible to obtain qualitative predictions for the swelling of PNIPAAm hydrogels in electrolyte solutions of NaCl by molecular simulation of a single chain. For the -solvent in NaCl solutions, it was even possible to quantitatively reproduce experimental data. First studies on the volume transition of PNIPAAm hydrogels in electrolyte solutions of sodium sulfate Na2SO4 were currently carried out (results not shown here). By comparing the results of the two electrolyte solutions NaCl and Na2SO4 in water, it is also possible to determine the effect of the Hofmeister series on the solubility of PNIPAAm in aqueous electrolyte solutions. The Hofmeister series leads to a -solvent of PNIPAAm in Na2SO4 solutions at a lower concentration than in NaCl solutions Zhang_2005 . This correlation could be reproduced by the molecular simulations. In summary, this is an unexpectedly favorable agreement between predictions by molecular simulation and experimental data, especially when considering that the force fields were not adjusted to any such data.
4.5 Computational demands
All simulations presented in Section 4 were carried out with the MPI based molecular simulation program GROMACS. The parallelization of the molecular dynamics part of GROMACS is based on the eighth shell domain decomposition method Hess_2008 . With GROMACS, typical simulation runs to determine the radius of gyration in equilibrium employ 128 CPUs running for 24–72 hours. For these simulations very large systems must be considered comprising typically about 58 800 interaction sites. For these simulations a maximum memory of 284 MB and a maximum virtual memory of 739 MB was used.
5 Conclusion
This work covers the development of ion force fields for describing the thermodynamic properties of electrolyte solutions and the applications of these force fields for predicting the volume transition of hydrogels by atomistic molecular simulations with explicit solvent models
The present work proves that alkali and halogen ions can be reliably modeled by a LJ sphere with a superimposed charge located at the center of mass. The developed force fields allow predicting structural properties like the radial distribution function and the hydration number as well as thermodynamic properties like the density.
The self-diffusion coefficient of pure water was determined using various well known molecular models of water. The agreement with experimental data is often poor. Furthermore, ion self-diffusion coefficients were determined in simulations using these different water models. No correlation was observed between the accuracy of the self-diffusion coefficients of pure water and the accuracy of the self-diffusion coefficients of the ions. Further research effort in developing a new water model is needed to gain accurate preditions of transport properties in aqueous electrolyte systems. In addition, the study shows that the self-diffusion coefficient of ions in aqueous solutions is almost independent of the LJ energy parameter of the ion.
With the developed electrolyte models, it was possible to predict the volume transition of hydrogels in electrolyte solutions qualitatively and in some cases even quantitatively. The results also reproduce the effect of the Hofmeister series on the swelling of hydrogels.
Acknowledgements.
The computer simulations were performed on the supercomputer HP XC4000 at the Steinbuch Centre for Computing in Karlsruhe (Germany) under the grant LAMO. This work was carried out under the auspices of the Boltzmann-Zuse Society for Computational Molecular Engineering (BZS).References
- (1) P. P. Ewald. Die Berechnung optischer und elektrostatischer Gitterpotentiale. Annalen der Physik, 64:253–287, 1921.
- (2) T. Darden, D. York, and L. Pedersen. Particle mesh Ewald - an Nlog(N) method for Ewald sums in large systems. Journal of Chemical Physics, 98:10089–10092, 1993.
- (3) J. W. Eastwood, R. W. Hockney, and D. N. Lawrence. P3M3DP - the 3-dimensional periodic particle-particle/particle-mesh program. Computer Physics Communications, 19:215–261, 1980.
- (4) B. G. Rao and U. C. Singh. A free-energy perturbation study of solvation in methanol and dimethyl-sulfoxide. Journal of the American Chemical Society, 112:3803–3811, 1990.
- (5) F. G. Fumi and M. P. Tosi. Ionic sizes + Born repulsive parameters in NaCl-type alkali halides. I. Huggins-Mayer + Pauling Forms. Journal of Physics and Chemistry of Solids, 25:31–44, 1964.
- (6) L. X. Dang and T. M. Chang. Molecular mechanism of ion binding to the liquid/vapor interface of water. Journal of Physical Chemistry B, 106:235–238, 2002.
- (7) B. Hess, C. Holm, and N. van der Vegt. Osmotic coefficients of atomistic NaCl (aq) force fields. Journal of Chemical Physics, 124:164509, 2006.
- (8) J. Walter, S. Deublein, J. Vrabec, and H. Hasse. Development of models for large molecules and electrolytes in solution for process engineering. High Performance Computing In Science and Engineering ’09, pages 165–176, 2010.
- (9) H. J. C. Berendsen, J. R. Grigera, and T. P. Straatsma. The missing term in effective pair potentials. Journal of Physical Chemistry, 91:6269–6271, 1987.
- (10) S. Deublein, B. Eckl, J. Stoll, S.V. Lishchuk, G. Guevara-Carrión, C. W. Glass, T. Merker, M. Bernreuther, H. Hasse, and J. Vrabec. ms2: A molecular simulation tool for thermodynamic properties. Computer Physics Communications, in press, doi:10.1016/j.cpc.2011.04.026, 2011.
- (11) R. C. Weast, editor. Handbook of Chemistry and Physics. CRC Press, 68 edition, 1987.
- (12) P. B. Balbuena, K. P. Johnston, and P. J. Rossky. Molecular dynamics simulation of electrolyte solutions in ambient and supercritical water. 1. Ion solvation. Journal of Physical Chemistry, 100:2706–2715, 1996.
- (13) K. P. Jensen and W. L. Jorgensen. Halide, ammonium, and alkali metal ion parameters for modeling aqueous solutions. Journal Of Chemical Theory And Computation, 2:1499–1509, 2006.
- (14) T. P. Straatsma and H. J. C. Berendsen. Free-energy of ionic hydration - analysis of a thermodynamic integration technique to evaluate free-energy differences by molecular-dynamics simulations. Journal Of Chemical Physics, 89:5876–5886, 1988.
- (15) P. J. Lenart, A. Jusufi, and A. Z. Panagiotopoulos. Effective potentials for 1 : 1 electrolyte solutions incorporating dielectric saturation and repulsive hydration. Journal of Chemical Physics, 126:044509, 2007.
- (16) Y. Marcus. Ionic-radii in aqueous-solutions. Chemical Reviews, 88:1475–1498, 1988.
- (17) J. H. Wang and S. Miller. Tracer diffusion in liquids. II. The self-diffusion as sodium ion in aqueous sodium chloride solutions. Journal of the American Chemical Society, 74:1611–1612, 1952.
- (18) J. M. Nielsen, A. W. Adamson, and J. W. Cobble. The self-diffusion coefficient of the ions in aqueous sodium chloride and sodium sulfate at 25∘C. Journal of the American Chemical Society, 74:446–451, 1952.
- (19) R. Zwanziger. Time correlation functions and transport coefficients in statistical mechanics. Annual Review of Physical Chemistry, 16:67–102, 1965.
- (20) M. S. Green. Markoff random processes and statistical mechanics of time-dependent phenomena. Journal of Chemical Physics, 22:398, 1954.
- (21) R. Kubo. Statistical-mechanical theory of irreversible processes: I. General theory and simple applications to magnetic and conduction problems. Journal of the Physical Society of Japan, 12:570, 1957.
- (22) S. Koneshan, J. C. Rasaiah, R. M. Lynden-Bell, and S. H. Lee. Solvent structure, dynamics and ion mobility in aqueous solutions at 25∘C. Journal of Physical Chemistry, 102:4193–4202, 1998.
- (23) K. T. Gillen, D. C. Douglass, and M. J. R. Hoch. Self-diffusion in liquid water to -31∘C. Journal of Chemical Physics, 57:5117–5119, 1972.
- (24) W. L. Jorgensen, J. Chandrasekhar, and J. D. Madura. Comparison of simple potential functions for simulating liquid water. Journal of Chemical Physics, 79:926–935, 1983.
- (25) J. L. F. Abascal and C. Vega. A general purpose model for the condensed phases of water: TIP4P/2005. Journal of Chemical Physics, 123:234505, 2005.
- (26) G. Guevara-Carrión, J. Vrabec, and H. Hasse. Prediction of self-diffusion coefficient and shear viscosity of water and its binary mixtures with methanol and ethanol by molecular simulations. Journal of Chemical Physics, 134:074508, 2011.
- (27) H. A. Abd El-Rehim. Swelling of radiation crosslinked acrylamide-based microgels and their potential applications. Radiation Physics and Chemistry, 74:111–117, 2005.
- (28) V. N. Pavlyuchenko, O. V. Sorochinskaya, S. S. Ivanchev, S. Y. Khaikin, V. A. Trounov, V. T. Lebedev, E. A. Sosnov, and I. V. Gofman. New silicone hydrogels based on interpenetrating polymer networks comprising polysiloxane and poly(vinyl alcohol) networks. Polymers for Advanced Technologies, 20:367–377, 2009.
- (29) Z. M. O. Rzaev, S. Dinçer, and E. Pişkin. Functional copolymers of N-isopropylacrylamide for bioengineering applications. Progress in Polymer Science, 32:534–595, 2007.
- (30) A. Hüther, X. Xu, and G. Maurer. Swelling of N-isopropyl acrylamide hydrogels in water and aqueous solutions of ethanol and acetone. Fluid Phase Equilibria, 219:231–244, 2004.
- (31) A. Hüther, X. Xu, and G. Maurer. Swelling of N-isopropyl acrylamide hydrogels in aqueous solutions of sodium chloride. Fluid Phase Equilibria, 240:186–196, 2006.
- (32) K. Mukae, M. Sakurai, S. Sawamura, K. Makino, S. W. Kim, I. Ueda, and K. Shirahama. Swelling of poly(N-isopropylacrylamide) gels in water-alcohol (C1-C4) mixed solvents. Journal of Physical Chemistry, 97:737–741, 1993.
- (33) H.M. Crowther and B. Vincent. Swelling behavior of poly-n-isopropylacrylamide microgel particles in alcoholic solutions. Colloid Polymer Science, 276:46–51, 1998.
- (34) S. Wu, H. Li, J. P. Chen, and K. Y. Lam. Modeling investigation of hydrogel volume transition. Macromolecular Theory and Simulations, 13:13–29, 2004.
- (35) J. Walter, V. Ermatchkov, J. Vrabec, and H. Hasse. Molecular dynamics and experimental study of conformation change of poly(N-isopropylacrylamide)-hydrogels in water. Fluid Phase Equilibria, 296:164–172, 2010.
- (36) Y. Zhang, S. Furyk, D. E. Bergbreiter, and P. S. Cremer. Specific ion effects on the water solubility of macromolecules: PNIPAM and the Hofmeister series. Journal of the American Chemical Society, 127:14505–14510, 2005.
- (37) W. L. Jorgensen and J. Tirado-Rives. The OPLS potential functions for proteins. Energy minimizations for crystals of cyclic peptides and crambin. Journal of the American Chemical Society, 110:1657–1666, 1988.
- (38) W. L. Jorgensen, D. S. Maxwell, and J. Tirado-Rives. Development and testing of the opls all-atom force field on conformational energetics and properties of organic liquids. Journal of The American Chemical Society, 118:11225–11236, 1996.
- (39) C. Oostenbrink, T. A. Soares, N. F. A. van der Vegt, and W. F. van Gunsteren. Validation of the 53a6 GROMOS force field. European Biophysical Journal, 34:273–284, 2005.
- (40) S. Weerasinghe and P. E. Smith. A Kirkwood-Buff derived force field for sodium chloride in water. Journal of Chemical Physics, 119:11342–11349, 2003.
- (41) D. van der Spoel, E. Lindahl, B. Hess, G. Groenhof, A. E. Mark, and H. J. C. Berendsen. GROMACS: Fast, flexible, and free. Journal of Computational Chemistry, 26:1701–1718, 2005.
- (42) B. Hess, C. Kutzner, D. van der Spoel, and E. Lindahl. GROMACS 4: Algorithms for highly efficient, load-balanced, and scalable molecular simulation. Journal of Chemical Theory and Computation, 4:435–447, 2008.
- (43) H. J. C. Berendsen, J. P. M. Postma, W. F. van Gunsteren, A. DiNola, and J. R. Haak. Molecular dynamics with coupling to an external bath. Journal of Chemical Physics, 81:3684–3690, 1984.
- (44) G. Bussi, D. Donadio, and M. Parrinello. Canonical sampling through velocity rescaling. Journal of Chemical Physics, 126:014101, 2007.
- (45) R. W. Hockney, S. P. Goel, and J. W. Eastwood. Quiet high-resolution computer models of a plasma. Journal of Computational Physics, 14:148–158, 1974.
- (46) U. Essmann, L. Perera, M. L. Berkowitz, T. Darden, H. Lee, and L. G. Pedersen. A smooth particle mesh Ewald method. Journal of Chemical Physics, 103:8577–8592, 1995.