Impurity-trapped excitons and electron traps in CaF2:Yb2+ and SrF2:Yb2+ probed by transient photoluminescence enhancement
Abstract
CaF2:Yb2+ and SrF2:Yb2+ crystals have been investigated by a two-color UV + IR transient photoluminescence enhancement technique. The enhancement gives information about both changes in internal energy levels of the excitons and liberation of electrons from traps in the crystals.
keywords:
rare-earth , Yb2+ , CaF2 , two-color spectroscopy , exciton , electron trap1 Introduction
Impurity-trapped excitons in rare-earth doped materials play an important role in both radiative and non-radiative decay processes of the excited configurations of the rare-earth ions. Theoretical [1] and experimental [2] studies suggest that non-radiative decay of the excited configuration to the ground configuration can be mediated by trapped exciton states, where the electron becomes delocalized. Radiation from exciton states is observed in some Eu2+ and Yb2+ materials. The broad, red-shifted emission is often referred to as “anomalous” luminescence [3].
Excitonic emission in CaF2 and SrF2 doped with Yb2+ has been the subject of a number of studies [4, 5, 6]. Yb2+-doped CaF2, SrF2, and BaF2 form an interesting series. Though their absorption spectra are similar, with absorption starting in the UV, the CaF2:Yb2+ emission peak is in the visible, SrF2:Yb2+ in the infra-red, and BaF2:Yb2+ does not radiate.
CaF2:Yb2+ and SrF2:Yb2+ have ground-state electronic configuration . UV excitation can promote one of the electrons to a orbital, giving the excited configuration . The electron rapidly becomes delocalized onto the next-nearest-neighbor Ca2+ or Sr2+ ions. The Yb2+ is then effectively ionized to Yb3+, with electronic configuration , i.e. one hole. This trivalent ion attracts the F- nearest neighbors more strongly than a divalent ion, leading to a large contraction of bond length. Emission from the exciton states to the ground state involves a large change in bond length, and therefore a broad, structureless, red-shifted vibronic emission band [3]. Recent ab-initio calculations have given valuable insight into the quantum physics of exciton formation [1]. However, the broad bands yield no detailed information and experimental information on the structure of impurity-trapped excitons has only been deduced from indirect measurements such as temperature dependencies [4, 5], pressure dependencies [2], and photoconductivity [6].
We have recently showed that it is possible to study the internal structure of trapped excitons in CaF2:Yb2+ by using a two-color photoluminesence-enhancement technique [7]. By irradiating the crystal with IR radiation after exciting it with UV radiation we induce transitions between exciton states. Since some of the excited states have much higher radiative rates than the lowest exciton state we can detect the excited-state absorption by monitoring photoluminescence enhancement. In this work we compare CaF2 and SrF2 doped with Yb2+.
Photoionization is known to occur when these materials are excited with UV radiation [4, 5, 6], and the mobile electrons may be trapped by crystal defects, possibly clusters of trivalent cations [8]. IR radiation is known to be capable of liberating electron traps [9]. Our enhanced photoluminescence measurement has a component that we interpret as trap-liberation, and we find that the trap-liberation spectrum is very similar for both CaF2:Yb2+ and SrF2:Yb2+.
2 Experimental
CaF2:Yb2+ and SrF2:Yb2+ crystals were grown using the vertical Bridgmann technique. The Yb concentration was 0.05% and 0.1% respectively and the purity of the starting materials was at least 99.9%. The UV component of our two-color excitation was made using UV output of a Quantronix TOPAS traveling-wave optical parametric amplifier (OPA) providing 3 ps pulses tunable in the 250-400 nm region of interest in this work at a repetition rate of 1 kHz. Pulsed infrared excitation was achieved using the Dutch FEL (FELIX) in Nieuwegein. The optical output of FELIX consists of a 4-6 s macropulse at a repetition rate of 10 Hz, containing micropulses at 25 MHz. FELIX is continuously tunable from 3 to 250 m. The OPA was synchronized to the FEL and the electronic timing between the two lasers could be varied. The UV and IR beams were spatially (but not temporally) overlapped on the sample, held at cryogenic temperatures within an Oxford instruments microstat helium flow cryostat. Subsequent UV/visible fluorescence was then detected using a TRIAX 320 spectrometer equipped with a C31034 photomultiplier.
3 Results
3.1 CaF2:Yb2+
Excitation with 365 nm pulsed UV excitation of CaF2:Yb2+ gives results consistent with previous work [4, 5], which reported strongly red-shifted fluorescence having a single-exponential decay with a lifetime of 15 ms at 4.2 K that reduces at higher temperatures.
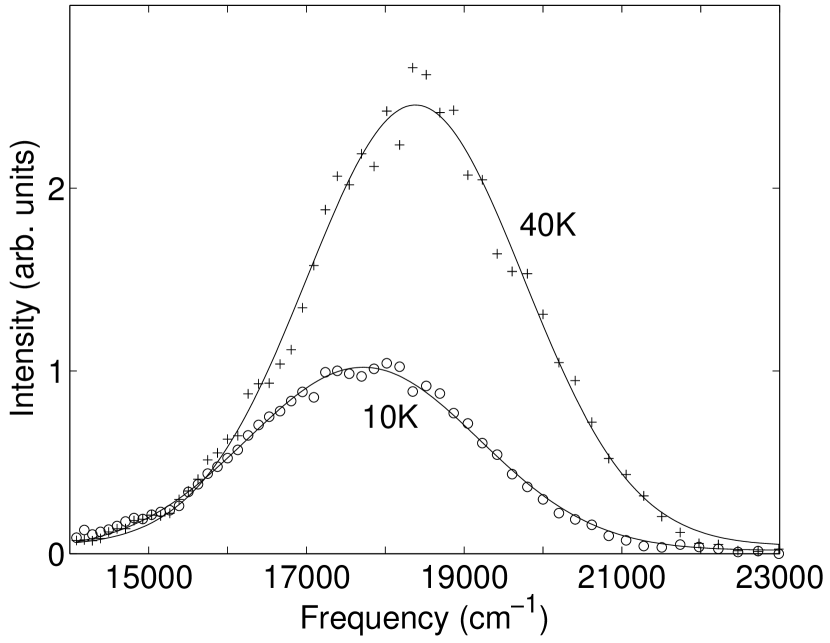
The fluorescence spectra for CaF2:Yb2+ at 10 K and 40 K are shown in Fig. 1. At 10 K the band center and width (FWHM) are 17720, 3460 cm-1. At 40 K the intensity increases by a factor of 2.5 and the band center and width are 18380, 3240 cm-1. Previous analysis of the temperature dependence [4] suggests that the emission is from two states separated by about 40 cm-1, with very different radiative lifetimes, 15 ms for the lower state and 260 s for the upper state.
Bond-length changes may be estimated from the emission bandwidths. The change in bond length between the lowest exciton state and the ground state has been calculated to be 0.17 Å [4]. The calculation is approximate because it uses an effective phonon frequency, which must be estimated from the phonon spectrum [10]. A frequency of 325 cm-1 gives 0.17 Å for the lowest exciton state (from our 10 K data) and 0.16 Å for the first excited state (from our 40 K data). The first excited state thus has a longer bond length, closer to the ground state bond length.
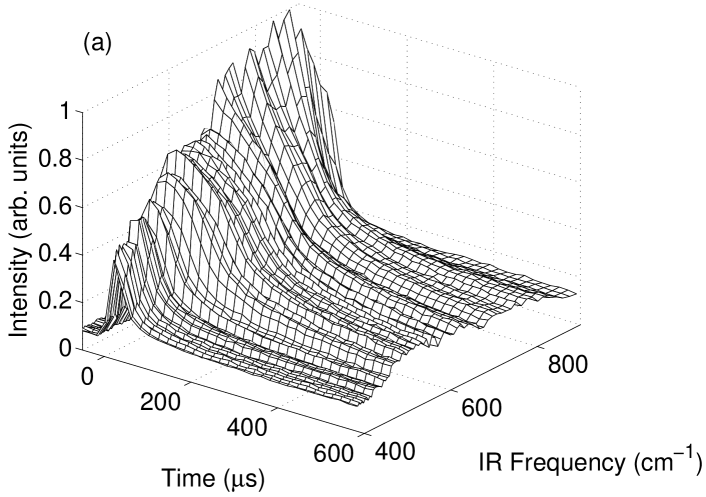
Two-color transient measurements at 10 K are illustrated in Fig. 2(a), which shows the result of irradiating the system with IR pulses with frequencies between 400 and 900 cm-1, delayed from the UV excitation by 100 s. The application of the IR pulse yields significant enhancement of the emission on short timescales. This is because we now populate excited excitonic states that have significantly faster radiative rates.
Fig. 2(b) shows the time evolution for frequencies of 400, 600, and 800 cm-1. For 400 and 800 cm-1 IR excitation the rise and decay times are similar. The temporal behavior for 600 cm-1 excitation is very different. The decay is clearly not a single exponential and the rise time is much longer than for 400 and 800 cm-1 IR excitation. Several hundred s after the IR excitation there is still a significant enhancement, suggesting that there are many more ions radiating than before the IR excitation.
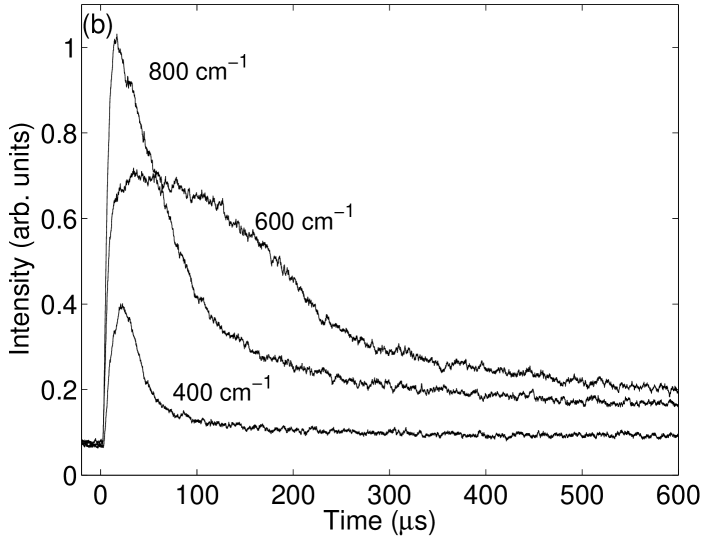
We may integrate the IR enhancement of the photoluminescence to construct an IR-induced excitation spectrum. This is shown in Fig. 3. Note that this spectrum has been constructed from three separate FEL scans. The spectrum consists of a broad band centered at 650 cm-1 and two sharper peaks at 250 cm-1 and 1145 cm-1, with linewidths of 35 and 20 cm-1 respectively. Dips in the broad band and the lower sharp peak correlate with atmospheric absorption of the FEL radiation which can distort the lineshape, despite purging of the IR beam path with dry N2 gas.
As discussed above, the temporal dynamics of the IR-induced signal are strongly dependent on the excitation wavelength. This is clear from Fig. 2 which reveals that IR excitation from about 450 to 650 cm-1 gives significantly longer decay times than the lower- and higher-frequency regions.
There are two possible mechanisms for two-color photoluminescence enhancement in these materials. One is that the IR pulse changes the exciton to a state with a higher radiative rate. This will be most apparent at short times. The other is that the IR pulse liberates a trapped electron, which recombines with a Yb3+ ion. This will result in more excitons radiating, an enhancement that will persist at long time scales. Trap liberation should also have a longer rise time than transition between exciton states. We therefore conclude that the low-energy IR excitation spectrum as dominated by trap liberation and the high-energy by exciton transitions.
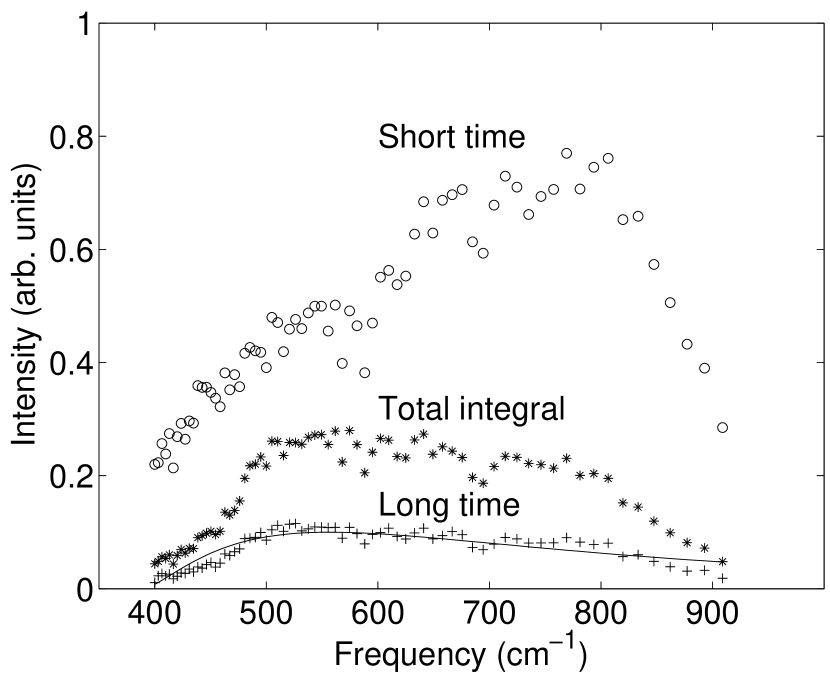
This interpretation may be made more quantitative by integrating the data of Fig. 2(a) over various time windows. The result is shown in Fig. 4, where the upper trace is for short times, the middle an integration over the entire time-scale (as in Fig. 3) and the bottom trace for long times.
The long-time spectrum is presumed to come entirely from trap liberation. A phenomenological model of a Coulomb trap having a threshold of 390 cm-1 gives an asymmetric spectrum with a width of approximately 400 cm-1 ([9] Eqn. (3)). This curve is included in Fig. 4, and it gives a reasonable representation of the long-time spectrum, though it does not fall off at high energy as fast as the experimental data.
The excitonic states may be modeled in a similar way to the excited states of Yb2+ [11, 12], with the electron replaced by a more delocalized orbital. The broad band from 650 to 950 cm-1 may be attributed to transitions from the lowest exciton state that involves a change in the orbital of the delocalized electron, giving a change in bonding and therefore vibronic broadening. The width of this band is similar to the width of the phonon spectrum in CaF2 [10], which implies that the bond-length change for the transition is small, similar to the change in bond-length between the lowest two exciton states calculated above (0.01 Å). An accurate calculation of the position and width of this band should be possible with a detailed ab-initio approach, as in Ref. [1].
The sharp excitation features observed at 250 and 1145 cm-1 cannot involve a change in bonding. We therefore assign them to changes in the wavefunction of the localized hole or the relative spin of the hole and delocalized electron. The former is a “crystal field” interaction and the latter is associated with an exchange Coulomb interaction. The calculations of Ref. [1] suggest that the excitons involve a linear combination of and orbitals with totally symmetric () character. Detailed calculations for CaF2:Yb3+ are not available. In Ref. [7] we have modeled the sharp lines with a simple semi-empirical model by constructing a “crystal field” Hamiltonian for an electron and a hole in a cubic crystal field. The 250 cm-1 splitting is simply the crystal-field splitting of the configuration of a Yb3+ ion in a cubic site, whereas the 1145 cm-1 splitting also involves the exchange interaction between the and delocalized electrons.
3.2 SrF2:Yb2+
We now turn to SrF2:Yb2+. The red shift of the exciton emission in this material is very large, with the peak emission in the near infra-red, and non-radiative processes are much more rapid than in CaF2:Yb2+ [4, 5]. Since the proportion of ions that decay radiatively is lower, and the detection was not optimized for IR radiation, the the noise levels for measurements in this material are much higher.
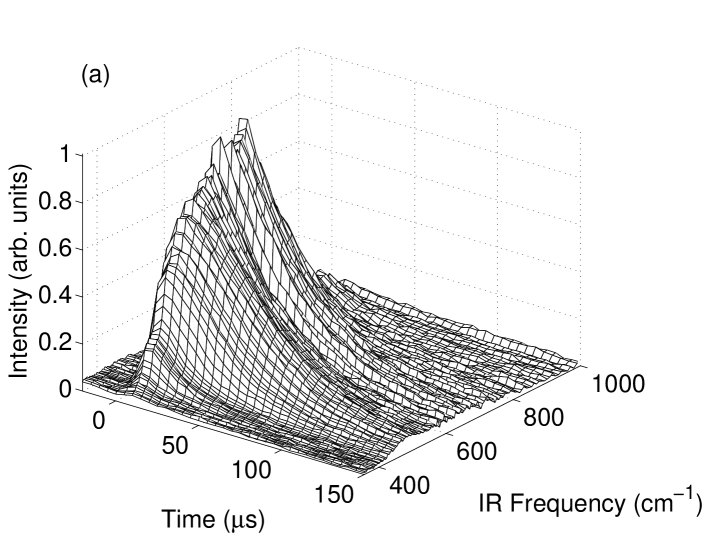
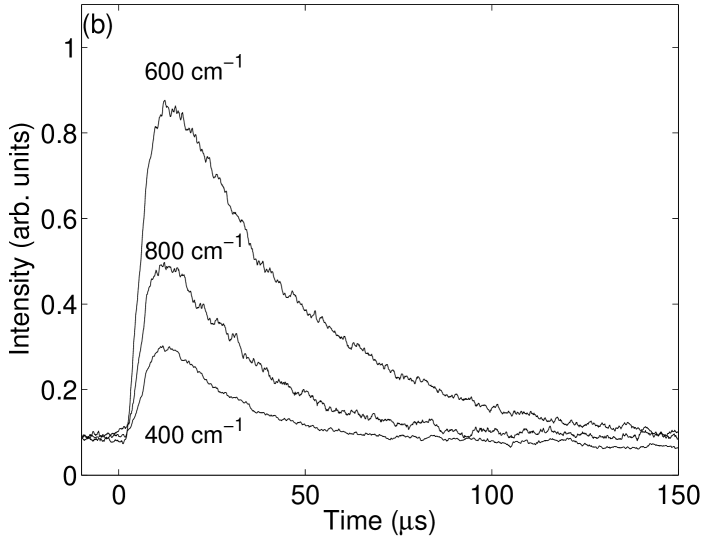
Fig. 5(a) shows the result of irradiating the system with IR pulses with frequencies from 350 to 1000 cm-1, delayed from the UV excitation by 100 s. Fig. 5(b) shows the trace for frequencies of 400, 600, and 800 cm-1. In contrast to the CaF2:Yb2+ case, there is much less variation across the spectrum, but there an increase in decay time in the middle of the broad band.
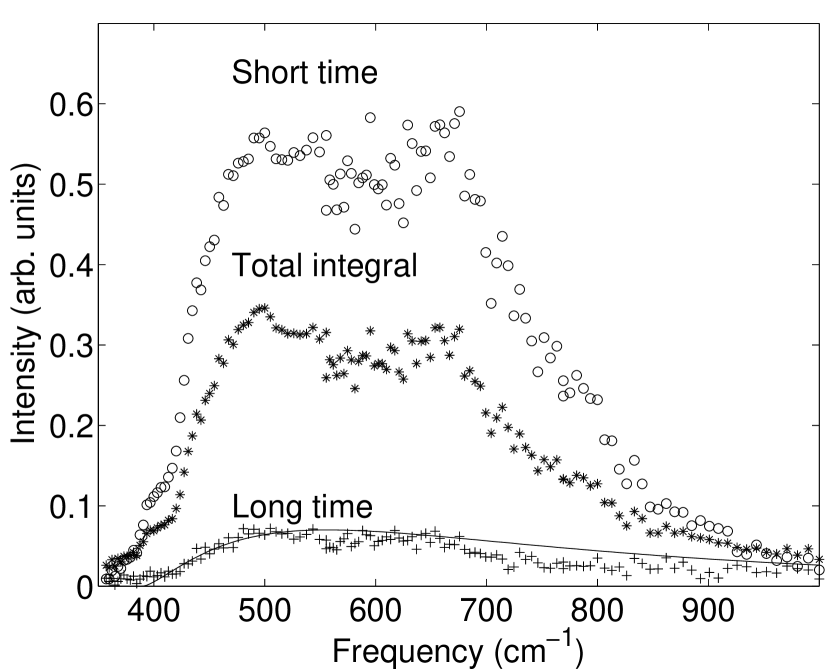
Fig. 6 shows spectra derived from the time-resolved excitation spectrum of Fig. 2(a). The top trace is for short times, the middle an integration over the entire time-scale, and the bottom trace for long times. The theoretical curve for a Coulomb trap matches the long-time spectrum quite well.
Comparison of the short and long time spectra suggest that there is an exciton peak at about 670 cm-1, and we conclude that in the larger SrF2 lattice the energy difference between exciton levels is smaller than in SrF2. We have not yet observed any sharp lines in the SrF2:Yb2+ IR excitation spectrum. However, the noise levels make detection difficult in the region where a high-energy peak might be expected (1000—1100 cm-1). We expect that measurements at lower IR energies will reveal similar crystal-field splitting as for CaF2.
3.3 Comparison of trap liberation in CaF2:Yb2+ and SrF2:Yb2+
The results CaF2:Yb2+ and SrF2:Yb2+ presented above suggest that the trap-liberation spectrum for both materials is very similar. This is further illustrated in Fig. 7, which shows the long-time two-color spectra for both CaF2:Yb2+ and SrF2:Yb2+, along with the Coulomb-trap model curve. Unlike the exciton spectra there is apparently little variation of the trap-liberation spectra with lattice constant. This would be expected if the traps are clusters of trivalent ions [8].
4 Conclusions
A two-color selective fluorescence-enhancement technique has been used to investigate CaF2:Yb2+ and SrF2:Yb2+. We have demonstrated that it is possible to use this technique to probe both the internal structure of exciton states and trap-liberation processes.
The spectra show both broad-band and sharp-line absorptions within the exciton, which will provide stringent tests of ab-initio calculations such as [1]. They also provide information about the dynamics of relaxation within the exciton that are not available from one-color measurements.
Trap-liberation processes are also probed by our measurements. The spectra are in reasonable agreement with a simple Coulomb-trap model. The trap spectra in CaF2:Yb2+ and SrF2:Yb2+ are similar, which is to be expected if the electron traps are clusters of cations.
Acknowledgements
This work was supported by the Marsden fund of the Royal Society of New Zealand via grant 09-UOC-080. We thank the Dutch FOM organization for providing FELIX beamtime and thank the FELIX staff for their assistance. Mr P. S. Senanayake acknowledges the support of the University of Canterbury via a PhD studentship.
References
- Sánchez-Sanz et al. [2010] G. Sánchez-Sanz, L. Seijo, Z. Barandiarán, J. Chem. Phys. 133 (2010) 114509.
- Grinberg and Mahlik [2008] M. Grinberg, S. Mahlik, J. Non-Cryst. Sol. 354 (2008) 4163.
- Dorenbos [2003] P. Dorenbos, J. Phys. Condensed Matter 15 (2003) 2645.
- Moine et al. [1989] B. Moine, B. Courtois, C. Pedrini, J. de Physique 50 (1989) 2105.
- Moine et al. [1991] B. Moine, B. Courtois, C. Pedrini, J. Luminescence 48-49 (1991) 501.
- Pedrini et al. [2007] C. Pedrini, M. F. Joubert, D. S. McClure, J. Luminescence 125 (2007) 230.
- Reid et al. [2011] M. F. Reid, P. S. Senanayake, J. P. R. Wells, G. Berden, A. Meijerink, A. J. Salkeld, C. K. Duan, R. J. Reeves, Phys. Rev. B 84 (2011) 113110.
- Beck et al. [1998] W. Beck, V. V. Fedorov, D. Ricard, C. Flytzanis, T. T. Basiev, J. Luminescence 79 (1998) 241.
- Izeddin et al. [2007] I. Izeddin, M. A. J. Klik, N. Q. Vinh, M. S. Bresler, T. Gregorkiewicz, Phys. Rev. Lett. 99 (2007) 077401.
- Hayes et al. [1973] W. Hayes, M. C. K. Wiltshire, W. J. Manthey, D. S. McClure, J. Phys. C 6 (1973) L273–L276.
- Pan et al. [2008] Z. Pan, C. K. Duan, P. A. Tanner, Phys. Rev. B 77 (2008) 085114.
- Reid et al. [2010] M. F. Reid, L. Hu, S. Frank, C. K. Duan, S. Xia, M. Yin, Eur. J. Inorg. Chem 2010 (2010) 2649 – 2654.