The discovery of geomagnetically trapped cosmic ray antiprotons
Abstract
The existence of a significant flux of antiprotons confined to Earth’s magnetosphere has been considered in several theoretical works. These antiparticles are produced in nuclear interactions of energetic cosmic rays with the terrestrial atmosphere and accumulate in the geomagnetic field at altitudes of several hundred kilometers. A contribution from the decay of albedo antineutrons has been hypothesized in analogy to proton production by neutron decay, which constitutes the main source of trapped protons at energies above some tens of MeV. This Letter reports the discovery of an antiproton radiation belt around the Earth. The trapped antiproton energy spectrum in the South Atlantic Anomaly (SAA) region has been measured by the PAMELA experiment for the kinetic energy range 60–750 MeV. A measurement of the atmospheric sub-cutoff antiproton spectrum outside the radiation belts is also reported. PAMELA data show that the magnetospheric antiproton flux in the SAA exceeds the cosmic-ray antiproton flux by three orders of magnitude at the present solar minimum, and exceeds the sub-cutoff antiproton flux outside radiation belts by four orders of magnitude, constituting the most abundant source of antiprotons near the Earth.
1 Introduction
The PAMELA collaboration has recently reported the cosmic ray (CR) antiproton spectrum and antiproton-to-proton ratio measurements in the kinetic energy range 60 MeV–180 GeV (Adriani et al., 2009a, 2010a). These data significantly improve those from previous experiments thanks to the high statistical significance and wide energy interval. The results agree with models of purely secondary production where antiprotons are produced through interactions of CRs with the interstellar medium.
Antiprotons are also created in pair production processes in reactions of energetic CRs with Earth’s exosphere. Some of the antiparticles produced in the innermost region of the magnetosphere are captured by the geomagnetic field allowing the formation of an antiproton radiation belt around the Earth. The particles accumulate until they are removed due to annihilation or ionization losses. The trapped particles are characterized by a narrow pitch angle111The pitch angle is the angle between particle velocity vector and geomagnetic field line. distribution centered around 90 deg and drift along geomagnetic field lines belonging to the same McIlwain -shell222An -shell is the surface formed by azimuthal rotation of a dipole field line. In a dipole, is the radius where a field line crosses the equator; in case of the Earth dipole, it is measured in units of Earth radii. McIlwain’s coordinates (McIlwain, 1961), and (the magnetic field strength), are pairs describing how far away from the equator a point is located along a given magnetic line at the distance from the Earth. where they were produced. Due to magnetospheric transport processes, the antiproton population is expected to be distributed over a wide range of radial distances.
According to the so-called CRAND (Cosmic Ray Albedo Neutron Decay) process (Walt et al., 1978; Albert et al., 1998), a small fraction of neutrons escapes the atmosphere and decays within the magnetosphere into protons, which become trapped if they are generated with a suitable pitch angle. Such a mechanism is expected to produce antineutrons (through pair production reactions such as ) which subsequently decay to produce antiprotons (CRANbarD). This source is expected to provide the main contribution to the energy spectrum of stably trapped antiprotons and the resulting flux is predicted to be up to several orders of magnitude higher than the antiproton flux from direct pair production in the exosphere (Fuki et al., 2005; Selesnick et al., 2007).
The magnetospheric antiproton flux is expected to exceed significantly the galactic CR antiproton flux at energies below a few GeV. However, predictions differ and suffer from large uncertainties, especially regarding contributions from the CRANbarD process. A measurement by the Maria-2 instrument (Voronov et al., 1990) on board the “Salyut-7” and “MIR” orbital stations allowed an upper limit on the trapped antiproton-to-proton ratio of to be established below 150 MeV. This Letter describes the first detection of antiprotons trapped in the inner radiation belt, using the PAMELA satellite-borne experiment.
2 The PAMELA experiment
PAMELA was launched from the Baikonur Cosmodrome on 2006 June 15 on board the “Resurs-DK1” satellite. The instrument was designed to accurately measure the spectra of charged particles (including light nuclei) in the cosmic radiation, over an energy interval ranging from tens of MeV to several hundred GeV. In particular, PAMELA is optimized to identify the small component of CR antiparticles. Since launch, PAMELA has collected an unprecedented number of antiprotons and positrons, as reported in recent publications (Adriani et al., 2009a, 2010a, b, 2010b).
PAMELA is built around a permanent magnet spectrometer equipped with a tracking system consisting of six double-sided micro-strip silicon sensors, which allows the determination of the particle charge and rigidity (momentum/charge) with high precision. A sampling electromagnetic calorimeter, composed of 44 silicon planes interleaved with 22 plates of tungsten absorber, is mounted below the spectrometer. A time-of-flight (ToF) system, made of three double layers of plastic scintillator strips, allows velocity and energy loss measurements, and provides the main trigger for the experiment. Particles leaving the PAMELA acceptance due to scattering or interactions are rejected by the anticoincidence system. A further scintillator plane and a neutron detector are placed below the calorimeter, in order to provide additional information about the shower extension and to improve lepton/hadron discrimination. A detailed description of the PAMELA apparatus along with an overview of the entire mission can be found elsewhere (Picozza et al., 2007).
The satellite orbit (70∘ inclination and 350–610 km altitude) allows PAMELA to perform a very detailed measurement of the cosmic radiation in different regions of Earth’s magnetosphere, providing information about the nature and energy spectra of sub-cutoff particles (Adriani et al., 2009c). The satellite orbit passes through the South Atlantic Anomaly (SAA), allowing the study of geomagnetically trapped particles in the inner radiation belt.
3 Antiproton identification
A clean sample of antiprotons was identified using information combined from several PAMELA subdetectors. Antiprotons are measured in the presence of a considerably larger flux of protons. It is therefore important that particle trajectories are well reconstructed by the tracking system, allowing reliable charge sign separation and a precise estimate of rigidity (Adriani et al., 2009a). Strict conditions were placed on the number of position measurements along a track and on the associated with the track fit procedure, in order to reject protons which were wrongly reconstructed as negatively charged particles due to scattering and to minimize uncertainties on the rigidity measurement.
Selections based on the interaction topology in the calorimeter allow antiproton/electron discrimination. Antiprotons in the selected energy range are likely to annihilate inside the calorimeter, thus leaving a clear signature. The longitudinal and transverse segmentation of the calorimeter is exploited to allow the shower development to be characterized. These selections are combined with measurements from individual strips in the silicon detector planes to allow electromagnetic showers to be identified with very high accuracy.
The particle velocity measurement provided by the ToF and the ionization losses in both the tracker and the ToF planes were used to discard electrons and secondary particles, mostly , produced by CRs interacting in the 2 mm thick aluminum pressurized container in which PAMELA is housed or at the support structures in the upper parts of the apparatus. Further rejection was provided by requiring no activity in the anticoincidence systems and exploiting the ToF and the tracking systems segmentation: in particular, an upper limit was applied on the number of hits close to the reconstructed track, in the two top ToF scintillators and in the tracker planes. The residual contamination was estimated with simulations to be negligible below 1 GV, while it is about 10% in the rigidity range 1–3 GV (Adriani et al., 2009a; Bruno, 2008).
Measured antiproton distributions were corrected by means of simulations to take into account losses due to ionization and multiple scattering inside the apparatus and, mainly, due to inelastic interactions (annihilation) in the dome. The correction factor decreases with increasing energy, ranging from 14% to 9%. Selection efficiencies were determined using flight data, which naturally include detector performances. Test beam and simulation data were used to support and cross-check these measurements. The total systematic error on the measured spectrum includes uncertainties on efficiency estimation, gathering power, livetime, contamination, ionization, and interaction losses. Additional details of the analysis can be found in Adriani et al. (2010a).
4 Instrument response
The factor of proportionality between the antiproton flux and the number of detected antiproton candidates, corrected for selection efficiencies and acquisition time, is by definition the gathering power of the apparatus. This quantity depends both on the angular distribution of the flux and the detector geometry. In presence of an isotropic particle flux, the gathering power depends only on the detector design, and it is usually called the geometrical factor. For the PAMELA apparatus, this factor depends also on particle rigidity, due to the influence of the spectrometer on particle trajectories.
Fluxes in radiation belts present significant anisotropy since particles gyrate around field lines while moving along them, bouncing back and forth between mirror points. This results in a well-defined pitch-angle distribution. A dependence on the local magnetic azimuthal angle is observed as consequence of the east-west effect. Positively (negatively) charged particles arriving from the east (west) originate from guiding centers located at lower altitudes than PAMELA and thus their flux is significantly reduced by the atmospheric absorption, while the opposite is valid for particles from western (eastern) directions. The resulting asymmetry is more evident for higher rigidity particles since it scales with the particle gyroradius which ranges from 50 km for a 60 MeV (anti)proton, up to 250 km for a 750 MeV (anti)proton.
The flux angular distributions, needed for the estimate of the apparatus gathering power, were evaluated using a trapped antiproton model (Selesnick et al., 2007). The calculation was performed using simulations according to the method described in Sullivan (1971). The dependency of the directional response function on the satellite orbital position and on its orientation relative to the geomagnetic field was taken into account. Pitch angle distributions were evaluated at more than 300 points along the orbit of the Resurs-DK1 satellite in the SAA region and for most probable orientations of PAMELA relative to the magnetic field lines. The geomagnetic field was estimated on an event-by-event basis using the IGRF-10 model (Maus et al., 2005). A mean gathering power, averaged over all PAMELA orbital positions and orientations, was derived. The dependence of the instrument response on particle rigidity was studied by estimating the gathering power at 10 rigidity values in the range of interest. The apparatus gathering power was calculated to be significantly reduced with respect to the geometric factor (3%), ranging from cm2sr at 60 MeV to cm2sr at 750 MeV.
| Rigidity | Mean kinetic | Observed | flux | ratio |
|---|---|---|---|---|
| range (GV) | energy (GeV) | events | (m-2s-1sr-1GeV-1) | () |
| 0.35-0.46 | 0.08 | 3 | 8.8 | 0.25 |
| 0.46-0.61 | 0.14 | 9 | 15.3 | 0.76 |
| 0.61-0.81 | 0.23 | 9 | 22.3 | 1.44 |
| 0.81-1.07 | 0.38 | 5 | 43 | 6.3 |
| 1.07-1.41 | 0.60 | 2 | 31 | 10.1 |
5 Results
During about 850 days of data acquisition (from 2006 July to 2008 December), 28 trapped antiprotons were identified within the kinetic energy range 60–750 MeV. Events with geomagnetic McIlwain coordinates (McIlwain, 1961) in the range and G were selected, corresponding to the SAA. The fractional livetime spent by PAMELA in this region amounts to the 1.7% ( s).
The propagation of each antiproton candidate was checked using simulation tools which allowed particle trajectories to be traced through the Earth’s magnetosphere (Clem et al., 2010; Desorgher et al., 2004). All the identified antiprotons, characterized by a pitch angle near 90 deg, were found to spiral around field lines, bounce between mirror points, and also perform a slow longitudinal drift around the Earth, for a total path length amounting to several Earth radii.
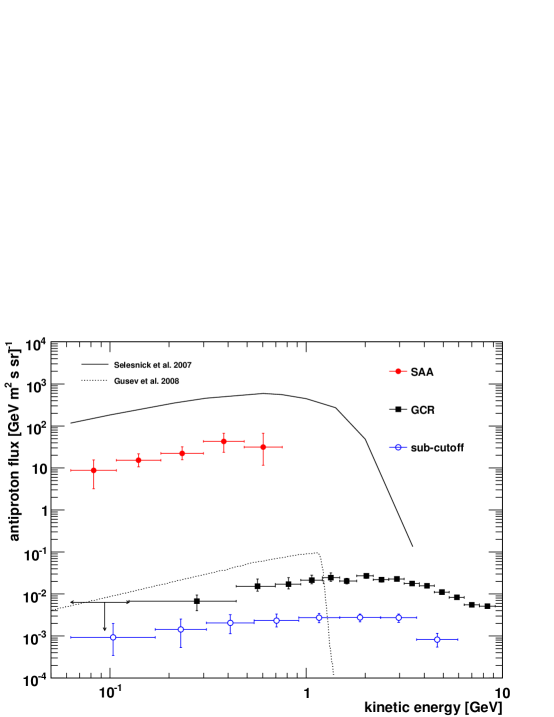
The spectrum of trapped antiprotons measured by PAMELA in the SAA region is reported in Table 1 and Figure 1. Predictions from a CRANbarD model by Selesnick et al. (2007) for the PAMELA orbit, and an independent calculation by Gusev et al. (2008) at =1.2, are also shown. Indeed, the estimated magnetospheric antiproton flux is compared with the galactic CR antiproton spectrum (Adriani et al., 2010a), and with the mean spectrum of sub-cutoff antiprotons measured by PAMELA outside the radiation belts ( G). The latter result was obtained by selecting particles with a rigidity value lower than 0.8 times the corresponding Störmer vertical cutoff333The vertical cutoff rigidity is the lowest rigidity for which a particle arriving from the zenith direction can access to a given location within the geomagnetic field. It is estimated on an event-by-event basis using orbital parameters according to the Störmer formalism: .. Furthermore, a nearly isotropic flux distribution was assumed. The measured SAA-trapped antiproton flux exceeds the sub-cutoff flux detected outside radiation belts and the galactic CR antiproton flux at the current solar minimum (negative phase ), by four and three orders of magnitude, respectively.
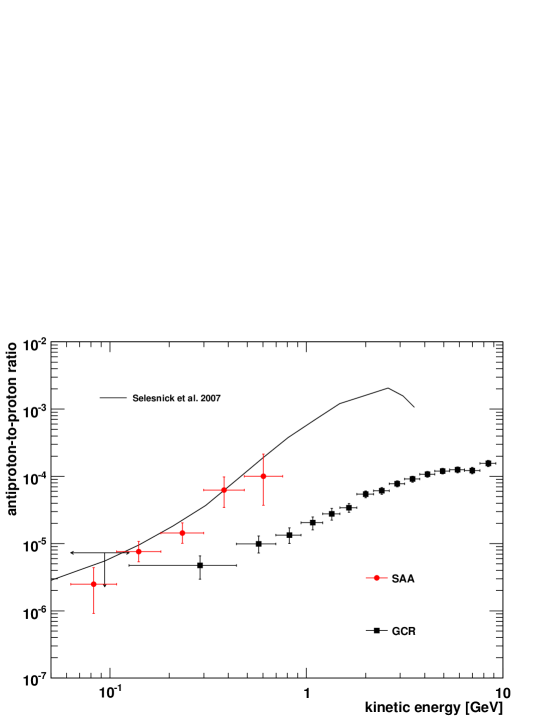
The trapped antiproton-to-proton ratio measured in the SAA is shown in Figure 2, where it is compared with theoretical predictions by Selesnick et al. (2007) and the antiproton-to-proton ratio measured by PAMELA for galactic particles. The trend reflects the high energy threshold of the pair production mechanism, with values similar to that of the albedo antineutron-to-neutron ratio (Selesnick et al., 2007).
6 Conclusions
Antiprotons trapped in Earth’s inner radiation belt have been observed for the first time by the PAMELA satellite-borne experiment. The antiparticle population originates from CR interactions in the upper atmosphere and subsequent trapping in the magnetosphere. PAMELA data confirm the existence of a significant antiproton flux in the SAA below 1 GeV in kinetic energy. The flux exceeds the galactic CR antiproton flux by three orders of magnitude at the current solar minimum, thereby constituting the most abundant antiproton source near the Earth. A measurement of the sub-cutoff antiproton spectrum outside the SAA region is also reported. PAMELA results allow CR transport models to be tested in the terrestrial atmosphere and significantly constrain predictions from trapped antiproton models, reducing uncertainties concerning the antiproton production spectrum in Earth’s magnetosphere.
Acknowledgements
We gratefully thank Prof. J. Clem for his assistance and support in adapting the “TrajMap” simulation program (Clem et al., 2010) and Prof. R. Selesnick for helpful discussions. We acknowledge support from The Italian Space Agency (ASI), Deutsches Zentrum fr Luftund Raumfahrt (DLR), The Swedish National Space Board, The Swedish Research Council, The Russian Space Agency (Roscosmos) and The Russian Foundation for Basic Research.
References
- Adriani et al. (2009a) Adriani, O., et al., “A new measurement of the antiproton-to-proton flux ratio up to 100 GeV in the cosmic radiation”, 2009a, Phys. Rev. Lett. 102, 051101.
- Adriani et al. (2009b) Adriani, O., et al., “An anomalous positron abundance in cosmic rays with energies 1.5-100 GeV”, 2009b, Nature, Vol 458, Pages: 607-609.
- Adriani et al. (2009c) Adriani, O., et al., “Measurements of quasi-trapped electron and positron fluxes with PAMELA”, 2009c, J. Geophys. Res., 114, A12218.
- Adriani et al. (2010a) Adriani, O., et al., “PAMELA results on the cosmic-ray antiproton flux from 60 MeV to 180 GeV in kinetic energy”, 2010a, Phys. Rev. Lett. 105, 121101.
- Adriani et al. (2010b) Adriani, O., et al., “A statistical procedure for the identification of positrons in the PAMELA experiment”, 2010b, Astropart. Phys. 34, 1-11.
- Albert et al. (1998) Albert, J. M., Ginet, G. P., and Gussenhoven, M. S., “CRRES observations of radiation belt proton 1. Data overview and steady radial diffusion”, 1998, J. Geophys. Res., 103: 9261.
- Bruno (2008) Bruno, A., 2008, Ph.D. thesis, University of Bari, Bari, Italy, http://pamela.roma2.infn.it/.
- Clem et al. (2010) Clem, J., and Owocki, K., “Earth Magnetosphere Charged-Particle Trajectory Mapping”, 2005, 2010, available from: http://www.bartol.udel.edu/clem/magtraj/. The technique used in the trajectory code is based on the algorithm in the following paper: Lin, Z., Bieber, J. W. and Evenson, P., “Electron Trajectories in a Model Magnetosphere: Simulation and Observation under Active Conditions”, 1995, J. Geophys. Res., 100, 23,543-23,549.
- Desorgher et al. (2004) Desorgher, L., Flckiger, E. O., Btikofer, R., and Moser, M. R., Proceedings of 28th International Cosmic Ray Conference, 4281 (2003).
- Fuki et al. (2005) Fuki, M., “Cosmic-ray antiproton spatial distributions computed in magnetosphere”, 2005, International Journal of Modern Physics A, 20, 6739–6741, doi: 10.1142/S0217751X05029976.
- Gusev et al. (2008) Gusev, A., Pugacheva, G., Pankov, V., Bickford, J., Spjeldvik, W., Jayanthi, U., and Martin, I., “Antiparticle content in the magnetosphere”, 2008, Advances in Space Research, Volume 42, Issue 9, p. 1550-1555.
- Maus et al. (2005) Maus, S., Macmillan, S., et al., the International Association of Geomagnetism and Aeronomy (IAGA), Division V, Working Group VMOD, “The 10th Generation International Geomagnetic Reference Field”, 2005, Phys. Earth Planet Int., 151, 320-322.
- McIlwain (1961) McIlwain, C. E., “Coordinates for mapping the distribution of magnetically trapped particles”, 1961, J. Geophys. Res., 66: 3681.
- Picozza et al. (2007) Picozza, P., et al., “PAMELA - A Payload for Antimatter Matter Exploration and Light-nuclei Astrophysics”, 2007, Astropart. Phys., Vol 27, Pages: pp. 296-315.
- Selesnick et al. (2007) Selesnick, R. S., Looper, M.D., Mewaldt, R. A., Labrador, A. W., “Geomagnetically trapped antiprotons”, 2007, Geophys. Res. Lett., 34, 20.
- Sullivan (1971) Sullivan, J. D., “Geometrical factor and directional response of single and multi-element particle telescopes”, 1971, Nucl. Instr. and Meth. 95, 5.
- Voronov et al. (1990) Voronov, S. A., Galper, A. M., Koldashov, S. V., Maslennikov, L. V., Mikhailov, V. V., and Popov., A. V., “Antiprotons in the Earth radiation belt”, 1990, Kosmicheskie issledovaniya (rus), Vol. 28, 4, p. 632.
- Walt et al. (1978) Walt, M., and Farley, T. S., “The physical mechanisms of the inner Van Allen belt. In The Earth; 1, The Upper Atmosphere, Ionosphere and Magnetosphere”, 1978, Handbook of Astronomy, Astrophysics and Geophysics, Edited by C. Gordon et al., Vol. 1, pp 303-412, Gordon & Breach, New York.