Glass transition and random close packing above three dimensions
Abstract
Motivated by a recently identified severe discrepancy between a static and a dynamic theory of glasses, we numerically investigate the behavior of dense hard spheres in spatial dimensions 3 to 12. Our results are consistent with the static replica theory, but disagree with the dynamic mode-coupling theory, indicating that key ingredients of high-dimensional physics are missing from the latter. We also obtain numerical estimates of the random close packing density, which provides new insights into the mathematical problem of packing spheres in large dimension.
Studying physical theories upon varying the dimensionality of space has illuminated a variety of problems over the last century. Unifying fundamental forces through general relativity and string theories immediately come to mind, but so does the treatment of critical phenomena through the renormalization group approach. Similar contemplations may now benefit another grand challenge of condensed matter, that of describing glass formation Anderson (1995). Including within the set of control parameters nicely complements two- and three-dimensional experiments and simulations by, first, surmounting some of the technical challenges encountered in low dimensions Charbonneau et al. (2010); and, second, by bringing the problem in contact with rich mathematical fields, such as coding theory Conway and Sloane (1988). Obtaining a complete and consistent high-dimensional theory of amorphous states would also crucially pave the way for a more systematic understanding of finite dimensional effects, and ultimately provide a reliable theory of the glass transition, jamming, and related phenomena.
The Random First Order Transition (RFOT) theory has emerged as one of the main contenders in the quest for a complete description of the glass transition. Its foundation was posed in the late eighties, when it was realized that a class of mean-field spin models share the phenomenology of glass formers Kirkpatrick et al. (1989). These models are very abstract and do not obviously present the microscopic features of particle-based systems, but they helped turn RFOT theory into a quantitative method for studying glasses, thanks to the development of the dynamic mode-coupling theory (MCT) Götze (2009) and the static replica theory (RT) Mézard and Parisi (1999). The two quantitative theories of the glass transition are intimately related Kirkpatrick and Wolynes (1987); Szamel (2010), but make use of different approximations in order to obtain closed-form structures Szamel (2010). Diverging physical descriptions result. The predictions of MCT Ikeda and Miyazaki (2010); Schmid and Schilling (2010) and RT Parisi and Zamponi (2010) indeed strongly disagree in the limit of large , with MCT suggesting that the glass transition happens at densities much larger than that of random close packing provided by RT. This situation is particularly worrying Bouchaud (2010). Because RFOT theory is based on a mean-field description, it should be exact in large . If MCT is really the dynamic part of RFOT theory, then MCT and RT should lead to identical predictions, as proposed in Kirkpatrick and Wolynes (1987). Whether MCT is really a mean-field theory, however, has been questioned KS91 . In order to test the quality of the approximations and to clarify the connection with the original mean-field models, one ought to understand the source of the discrepancy, and to obtain a controlled limit of particle systems in which RFOT becomes exact.
Independently from this issue, packing spheres in high dimensions is intimately related to several important mathematical problems, notably in the context of signal digitalization and of error correcting codes Conway and Sloane (1988). It has been suggested that for large disordered packings may be more efficient than lattice-based versions Torquato and Stillinger (2006). Although lattice geometries are strongly dependent, the fluid structure and properties have been suggested to be much less sensitive to , once (see e.g. Ref. van Meel et al. (2009)). A general understanding of disordered packings in arbitrary would thus also clarify the density scaling of amorphous packings and their potential mathematical role.
In this letter, we compare simulations of hard spheres up to with the predictions of RT and MCT. The results suggest that while RT offers a satisfying description of dimensionality MCT fails at the task, which calls for a modified formulation of the dynamical theory of RFOT. The results also provide the “random close-packed” density in several and give a hint of the scaling of this quantity for large , which should allow comparisons with the results of other theoretical treatments Song et al. (2008).
Numerical simulations -
We employ a modified Lubachevsky-Stillinger algorithm to densify a low-density gas of identical hard spheres of diameter , enclosed in a periodic box of volume , by growing the particles at a constant rate , reported here in standard reduced units Skoge et al. (2006); foo (a). Time evolution stops when the system reaches a high reduced pressure measured by rescaling the mechanical pressure by the number density and the inverse temperature , which is thermostated to unity. The packing fraction is , where is the volume of a -dimensional ball of radius . Our event-driven molecular dynamics scheme complements Ref. Skoge et al. (2006)’s earlier implementation of cubic blocking of space with spherical nearest-neighbor lists donev:2005b . Because the volume of a ball inscribed in a cube tends to zero with growing , remarkable efficiency gains are obtained from considering collisions with fewer neighbors. Up to , particles are grown at rates as low as , while rates of and are attained in and , respectively. Systems with are simulated for and larger ones for – appendix . These sizes ensure that even when the system is in its densest state the box edge remains larger than , which prevents a particle from ever having two direct contacts with another one. There are strong reasons to believe that although relatively small these nonetheless provide a reliable approximation of bulk behavior. First, with increasing the box edge becomes less representative of the overall box size. The largest diagonals are larger and there are many more diagonals than edges. Second, by analogy to spin systems, mean-field arguments indicate that for , a hypercube of side two is sufficient to capture the full thermodynamic behavior. Even at the critical point, finite-size corrections are proportional to , where the exponent is model dependent (e.g. 1/2 at the ferromagnetic transition), and do not directly involve the edge length Parisi (1998). Similar results hold for dimensions greater than the upper critical dimension, where the exponents coincide with the mean field ones. Third, the fluid structure is expected to become uniform at ever smaller distances with increasing Parisi and Slanina (2000); Skoge et al. (2006). Nearest-neighbor ordering should thus mainly be influenced by particles in contact or nearly so, with the rest of the fluid acting as a continuum. Indeed, in the fluid phase, finite volume corrections are proportional to the pair correlation , and at fixed , goes to zero exponentially with Parisi and Slanina (2000). The validity of these rationalizations, which are consistent with the decorrelation property of high sphere packings proposed in Torquato and Stillinger (2006), are satisfactorily tested by simulations in appendix .
Numerical results -
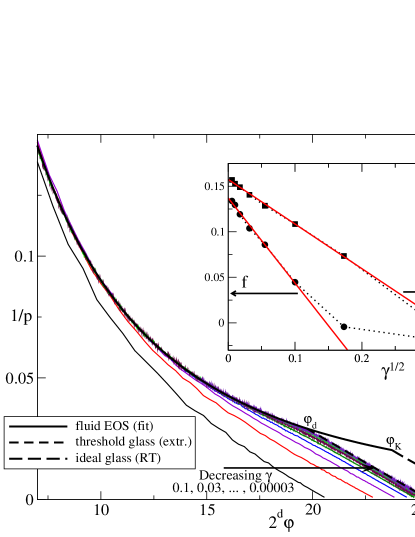
The compression results for shown in Fig. 1 are representative of the behavior observed for all , where crystallization is not observed on the time scale accessible to present computers Skoge et al. (2006); van Meel et al. (2009); in crystallization is observed at small leading to a drop in the pressure at intermediate density Skoge et al. (2006). The system first follows the equilibrium fluid equation of state (EOS) at low density and falls out of equilibrium at high density. Beyond this point, the pressure increases faster than in the equilibrium fluid and ultimately diverges at packing fraction . A Carnahan-Starling form
| (1) |
captures well the pressure growth with in the fluid regime (Fig. 1), provided, for each , that one fits to the data from the slowest compression rate available foo (b). Note that the coefficients are not identical to adjusted to recover the correct third virial coefficient Song et al. (1989) (see appendix ), but the values are quite close, and in any case this contribution vanishes with increasing .
In the high-density non-equilibrium regime, compaction runs with different follow separate branches along which the pressure evolution is dominated by the expulsion of free volume Donev et al. (2005); Kamien and Liu (2007). Upon approaching jamming, the pressure is well approximated by
| (2) |
where both and are extracted from fitting the simulation data for (see the table in appendix ). Very close to jamming (), can be interpreted as the fraction of “rattlers” present, but in the regime where the fluid first becomes non-ergodic, caging heterogeneity results in a larger effective Donev et al. (2005). We find that with decreasing , converges to values of order , with only a weak dependence (Fig. 1).
Data analysis -
The numerical results qualitatively agree with the RFOT scenario (see Ref. Parisi and Zamponi (2010) for details). According to the theory, the glassy states for moderately small should converge as a power law to a “threshold” glass that eventually jams at . The dynamical transition density footnoted separates the equilibrium fluid from this glass Mari and Kurchan (2011), but at much slower compaction rates, , RFOT theory also predicts that activated events allow the system to remain in equilibrium up to higher densities. In this regime we expect a crossover to a logarithmic dependence of the glass EOS on , e.g., of the form . As long as crystallization remains suppressed Skoge et al. (2006); van Meel et al. (2009), an extrapolation to in this regime allows to identify a second order phase transition to an “ideal” glass, at a density that corresponds to the Kauzmann point. This ideal glass then jams at the glass close-packed (GCP) density . Hence, from this mean-field treatment, stable amorphous packings should exist in the interval Parisi and Zamponi (2010).
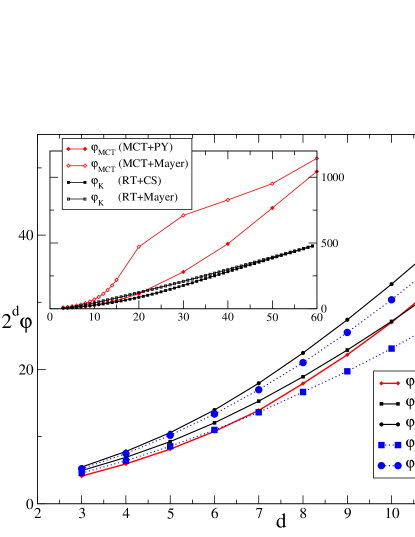
Based on this description, it is clear that the activated regime of RFOT is inaccessible in high dimensions. We therefore focus on the power-law regime and on the threshold glass. In the inset of Fig. 1, the reported and are both linear as functions of with . The exponent is expected to weakly depend on dimensionality, especially at low , but this value is within the numerically reasonable range for all systems studied. Because the subsequent analysis is rather insensitive to the precise value of , for simplicity it is kept constant. Extrapolating the results to gives the parameters and for the threshold glass free volume EOS reported in Fig. 1. Its intersection with the fluid EOS then provides a numerical estimate for . These values are very close to previous numerical estimates in Brambilla et al. (2009) and Charbonneau et al. (2010), and the results for agree with the results of Refs. Skoge et al. (2006); foo (c), which demonstrates the coherence of our analysis in low dimensions. The numerical results reported in Table 1 and plotted in Fig. 2 further show that the dimensional evolution of and is smooth. Interestingly, dimensions where the crystal structure is singularly dense, such as and Conway and Sloane (1988), do not present any echo of that singularity, which illustrates the smooth dependence of the fluid structure.
Theory -
The numerical results can also be quantitatively compared with the analytical estimates for the RFOT critical densities. Although a reliable calculation of and has not yet been obtained within RT, the latter gives results for and Parisi and Zamponi (2010), taking the Carnahan-Starling EOS with parameter as input. As we mentioned above, the fitted values are slightly different, but that difference only weakly perturbs the results. Because is only available for , we use instead from Ref. Parisi and Zamponi (2010). As expected from RFOT theory, and , and the values follow a similar trend with (Table 1).
| (RT+CS) | (RT+CS) | (MCT+PY) | |||
| 3 | 0.571 | 0.651 | 0.618 | 0.684 | 0.516 |
| 4 | 0.401 | 0.467 | 0.432 | 0.487 | 0.371 |
| 5 | 0.267 | 0.319 | 0.289 | 0.331 | 0.254 |
| 6 | 0.172 | 0.209 | 0.189 | 0.219 | 0.169 |
| 7 | 0.106 | 0.133 | 0.120 | 0.140 | 0.109 |
| 8 | 0.0648 | 0.0821 | 0.0738 | 0.0875 | 0.0699 |
| 9 | 0.0385 | 0.0498 | 0.0447 | 0.0535 | 0.0434 |
| 10 | 0.0226 | 0.0297 | 0.0266 | 0.0319 | 0.0264 |
| 11 | 0.0131 | 0.0174 | 0.0155 | 0.0187 | 0.0158 |
| 12 | 0.0075 | 0.0101 | 0.00891 | 0.0108 | 0.00964 |
The MCT analysis follows the approach of Refs. Ikeda and Miyazaki (2010); Schmid and Schilling (2010) using the Percus-Yevick (PY) structure factor calculated iteratively with a numerical Hankel transformation of order . Using instead the hypernetted chain (HNC) input for the structure factor does not strongly affect the results. For the dynamical and static theories to be consistent, the transition density predicted by MCT, reported in Table 1 and plotted in Fig. 2, should coincide with . It is not the case. The MCT transition at increases too fast with and around will likely cross the numerical estimate of . This situation is paradoxical, because the liquid should fall out of equilibrium well before jamming occurs. The usual suggestion that activated events may improve the consistency by increasing would here make things worse.
The inset in Fig. 2 presents and for larger dimensions. Both curves approach the results obtained by neglecting all structure for the liquid Parisi and Slanina (2000), which amounts to using the van der Waals’ expression for the fluid EOS and the Mayer function for the direct correlation function Ikeda and Miyazaki (2010); Schmid and Schilling (2010). This treatment is exact for , a fact that is also consistent with our simulation results for the fluid EOS. In this asymptotic large regime, MCT predicts Ikeda and Miyazaki (2010); Schmid and Schilling (2010), while RT predicts Parisi and Zamponi (2010). The simulation results at intermediate thus give supporting evidence that the scaling predicted by MCT is incorrect.
Conclusions -
Our numerical results extend previous estimates of the glass transition density Brambilla et al. (2009); Charbonneau et al. (2010) and of the amorphous packing density Skoge et al. (2006) up to . These results are obtained partly thanks to methodological improvements donev:2005b over the approach of Ref. Skoge et al. (2006). Reassuringly, our procedure for the data analysis, which is grounded in the RFOT scenario Parisi and Zamponi (2010), produces results that are consistent with estimates obtained through alternate routes. Two key features arise from the work. First, our numerical estimates of are slightly smaller than the values of predicted by RT and follow a similar trend, indicating that RT provides a reliable prediction for the jamming density of hard spheres in high dimensions. In particular, the random close-packed state of frictionless hard spheres, which is expected to be protocol dependent Krzakala and Kurchan (2007); Parisi and Zamponi (2010), should fall within the range of densities predicted by the RFOT scenario . We thus expect our numerical results for to be good estimates of that density, irrespective of the protocol used. Second, our results for the dynamical (glass) transition are slightly smaller than the ideal glass (Kauzmann) transition predicted by RT, as it should be. But at the same time, the MCT prediction does not coincide with , unlike what the RFOT scenario suggests. The two quantities additionally show very different trends with dimension and the discrepancy increases at large , which suggests that the standard MCT formulation Götze (2009); Ikeda and Miyazaki (2010); Schmid and Schilling (2010) is not exact at large . Echoing and amplifying the call of Ref. Ikeda and Miyazaki (2010), a new theory should be constructed, in order to interpolate between MCT in and the large mean-field regime.
Whether this theory will be a minor modification of MCT or a completely new theory remains an open question. Indeed, mean-field models displaying a RFOT are described by MCT-like equations Kirkpatrick et al. (1989); Kirkpatrick and Wolynes (1987), and MCT itself has been described as a type of Landau theory of the dynamical transition Bouchaud (2010); Andreanov et al. (2009). It is thus possible that a modified MCT with a similar structure might be exact in large . Steps in this direction have been already taken Mari and Kurchan (2011); Jacquin and van Wijland (2011). Constructing a complete RFOT theory that includes both RT and a modified MCT would be an important intellectual advance, as it would be the first complete theory of the glass and jamming transitions for particle-based systems. This advance would open the way towards a more systematic construction of RFOT, through a large expansion or a renormalization group approach. Some of the approximations underlying the construction of MCT might also be better justified, leading to a fully predictive glass theory for .
Acknowledgements.
We thank J. Kurchan, R. Mari, K. Miyazaki and R. Schilling for stimulating discussions. PC acknowledges NSF support No. DMR-1055586.References
- Anderson (1995) P. W. Anderson, Science 267, 1615 (1995).
- Charbonneau et al. (2010) P. Charbonneau, A. Ikeda, J. A. van Meel, and K. Miyazaki, Phys. Rev. E 81, 040501(R) (2010).
- Conway and Sloane (1988) J. H. Conway and N. J. A. Sloane, Sphere Packings, Lattices and Groups (Springer-Verlag, New York, 1988); H. Cohn, Proceedings of the international congress of mathematicians (ICM 2010), 2416 (arXiv:1003.3053).
- Kirkpatrick et al. (1989) T. R. Kirkpatrick, D. Thirumalai, and P. G. Wolynes, Phys. Rev. A 40, 1045 (1989).
- Götze (2009) W. Götze, Complex Dynamics of Glass-Forming Liquids, International Series of Monographs on Physics, Vol. 143 (Oxford University Press, Oxford, 2009).
- Mézard and Parisi (1999) M. Mézard and G. Parisi, Phys. Rev. Lett. 82, 747 (1999).
- Kirkpatrick and Wolynes (1987) T. R. Kirkpatrick and P. G. Wolynes, Phys. Rev. A 35, 3072 (1987).
- Szamel (2010) G. Szamel, Europhys. Lett. 91, 56004 (2010).
- Schmid and Schilling (2010) B. Schmid and R. Schilling, Phys. Rev. E 81, 041502 (2010); R. Schilling and B. Schmid, Phys. Rev. Lett. 106, 049601 (2011).
- Ikeda and Miyazaki (2010) A. Ikeda and K. Miyazaki, Phys. Rev. Lett. 104, 255704 (2010); Phys. Rev. Lett. 106, 049602 (2011).
- Parisi and Zamponi (2010) G. Parisi and F. Zamponi, Rev. Mod. Phys. 82, 789 (2010).
- Bouchaud (2010) J.-P. Bouchaud, “The mode-coupling theory of supercooled liquids: Does it wear any clothes?” http://www.condmatjournalclub.org/?p=1022 (2010).
- (13) W. Kob and R. Schilling, J. Phys.: Condens. Matter 3, 9195 (1991).
- Torquato and Stillinger (2006) S. Torquato and F. H. Stillinger, Exp. Math. 15, 307 (2006).
- van Meel et al. (2009) J. A. van Meel, B. Charbonneau, A. Fortini, and P. Charbonneau, Phys. Rev. E 80, 061110 (2009).
- Song et al. (2008) C. Song, P. Wang, and H. A. Makse, Nature 453, 629 (2008); Y. Jin et al. Phys. Rev. E 82, 051126 (2010).
- Skoge et al. (2006) M. Skoge, A. Donev, F. H. Stillinger, and S. Torquato, Phys. Rev. E 74, 041127 (2006).
- foo (a) In contrast to the original implementation, a canonical definition of temperature is here used, which rescales the time unit for particles of unit mass .
- (19) L. Verlet, Phys. Rev. 159, 98 (1967); A. Donev, S. Torquato, F. H. Stillinger, J. Comp. Phys. 202, 765 (2005).
- Parisi and Slanina (2000) G. Parisi and F. Slanina, Phys. Rev. E 62, 6554 (2000).
- (21) See Appendix to this paper for numerical details, finite-size studies, and error analysis.
- Parisi (1998) G. Parisi, Statistical Field Theory (Perseus Group, 1998).
- foo (b) The many virial coefficients known for hard spheres, e.g., Ref. Bishop et al. (2008), insufficiently capture the equation of state near the onset density of the non-ergodic regime.
- Song et al. (1989) Y. Song, E. A. Mason, and R. M. Stratt, J. Phys. Chem. 93, 6916 (1989).
- Donev et al. (2005) A. Donev, S. Torquato, and F. H. Stillinger, Phys. Rev. E 71, 011105 (2005).
- Kamien and Liu (2007) R. D. Kamien and A. J. Liu, Phys. Rev. Lett. 99, 155501 (2007).
- (27) We use the canonical notation for the dynamical transition , but the reader should not confuse this “d” subscript with dimensionality .
- Mari and Kurchan (2011) R. Mari and J. Kurchan, arXiv:1104.3420 (2011).
- Brambilla et al. (2009) G. Brambilla et al. , Phys. Rev. Lett. 102, 085703 (2009)
- foo (c) Within RFOT, the “maximally random jammed” packing discussed in Ref. Skoge et al. (2006) should be very close to Parisi and Zamponi (2010).
- Krzakala and Kurchan (2007) F. Krzakala and J. Kurchan, Phys. Rev. E 76, 021122 (2007); S. Torquato and F. H. Stillinger, Rev. Mod. Phys. 82, 2633 (2010).
- Andreanov et al. (2009) A. Andreanov, G. Biroli, and J.-P. Bouchaud, Europhys. Lett. 88, 16001 (2009).
- Jacquin and van Wijland (2011) H. Jacquin and F. van Wijland, Phys. Rev. Lett. 106, 210602 (2011); Y. Elskens and H. L. Frisch, Phys. Rev. A 37, 4351 (1988) .
- Bishop et al. (2008) M. Bishop, N. Clisby, and P. A. Whitlock, J. Chem. Phys. 128, 034506 (2008).
I Appendix
| Ref. Song et al. (1989) | (RT+CS) | (RT+CS) | (MCT+PY) | |||||||
| 3 | 8000 | 0.5 | 0.5 | 0.03 | 0.11(2) | 4.57(6) | 5.21(1) | 4.94 | 5.47 | 4.13 |
| 4 | 8000 | 0.114 | -0.051 | 0.02 | 0.12(1) | 6.41(6) | 7.48(1) | 6.91 | 7.79 | 5.94 |
| 5 | 8000 | -1.086 | -1.625 | 0.02 | 0.124(5) | 8.56(5) | 10.20(1) | 9.26 | 10.6 | 8.13 |
| 6 | 8000 | -3.900 | -4.910 | 0.02 | 0.128(6) | 10.99(8) | 13.37(2) | 12.1 | 14.0 | 10.8 |
| 7 | 8000 | -9.294 | -11.06 | 0.02 | 0.130(4) | 13.6(1) | 16.98(4) | 15.3 | 17.9 | 13.9 |
| 8 | 1400 | -19.38 | -22.03 | 0.02 | 0.14(2) | 16.5(3) | 20.92(5) | 18.9 | 22.4 | 17.9 |
| 8 | 2500 | -19.38 | 0.02 | 0.136(7) | 16.6(2) | 21.02(5) | ||||
| 8 | 8000 | -19.38 | 0.02 | 0.135(4) | 16.6(1) | 21.00(4) | ||||
| 8 | 32768 | -19.38 | 0.02 | 0.133(3) | 16.6(1) | 21.02(5) | ||||
| 9 | 8000 | -35.46 | -41.10 | 0.02 | 0.137(4) | 19.7(2) | 25.51(7) | 22.9 | 27.4 | 22.2 |
| 10 | 20000 | -62.50 | -73.83 | 0.02 | 0.139(4) | 23.1(2) | 30.37(8) | 27.2 | 32.7 | 27.0 |
| 11 | 50000 | -107.0 | -129.6 | 0.015 | 0.141(1) | 26.9(2) | 35.64(9) | 31.7 | 38.3 | 32.4 |
| 12 | 125000 | -176.0 | -224.3 | 0.015 | 0.145(6) | 30.6(5) | 41.3(2) | 36.5 | 44.2 | 39.5 |
Error analysis -
From the simulation results, the error on is found to be very small and, for all practical purposes, the quantity is here considered exact. While the error on and are estimated by taking three times the error on the linear regression coefficients, for , a standard error propagation is conducted starting from its definition. Indeed is the intersection of the fluid EOS and the threshold glass EOS defined by the extrapolation of the free volume equation to :
| (3) |
Defining , we then get that
| (4) |
Finite-size effects -
The finite-size arguments that we presented in the main text are tested by comparing systems with K, K, K and K. Although the number of particles increases by nearly per dimension over this sequence, the compaction curves are almost indistinguishable except for a slight finite size effect for the largest . The results of our data analysis coincide within numerical errors, estimated as discussed in the previous paragraph (Table 2).