Observations of the December 13 and 14, 2006, Solar Particle Events in the 80 MeV/n - 3 GeV/n range from space with PAMELA detector.
Abstract
We present the space spectrometer PAMELA observations of proton and helium fluxes during the December 13 and 14, 2006 solar particle events. This is the first direct measurement of the solar energetic particles in space with a single instrument in the energy range from 80 MeV/n up to 3 GeV/n. In the event of December 13 measured energy spectra of solar protons and helium were compared with results obtained by neutron monitors and other detectors. Our measurements show a spectral behaviour different from those derived from the neutron monitor network. No satisfactory analytical fitting was found for the energy spectra. During the first hours of the December 13 event solar energetic particles spectra were close to the exponential form demonstrating rather significant temporal evolution. Solar He with energy up to 1 GeV/n was recorded on December 13. In the event of December 14 energy of solar protons reached 600 MeV whereas maximum energy of He was below 100 MeV/n. The spectra were slightly bended in the lower energy range and preserved their form during the second event. Difference in the particle flux appearance and temporal evolution in these two events may argue for a special conditions leading to acceleration of solar particles up to relativistic energies.
1 Introduction
The PAMELA spectrometer (Picozza et al., 2007) is a space instrument designed for the study of primary charged particles and antiparticles in a wide energy interval, mainly from tens of MeV to 1.2 TeV for protons. It was launched in an elliptical orbit at an altitude between 350 and 610 km and inclination of 70 degree in June 2006. The main scientific goal of PAMELA is the measurement of the particle and antiparticle component in galactic cosmic rays (Adriani et al., 2009a, b), the study of galactic cosmic ray modulation by solar activity, and solar energetic particles (Casolino et al., 2006a; De Simone et al., 2009). This paper reports the PAMELA measurements of the solar proton and helium fluxes in the energy range from below 100 MeV/n to several GeV/n during the December 13 and 14, 2006 solar particle events.
The problem concerning mechanism and site of solar energetic particles (SEP) acceleration remains an open question. Certainly, SEP may be produced after powerful explosive events on the Sun, accompanied by solar flares, Coronal Mass Ejections (CME), bursts of solar X /gamma-rays and radio emission (Reames, 1999). It is clear that not a single mechanism is involved into the SEP generation. Stochastic acceleration, shock acceleration, and acceleration by the DC electric fields in the process of magnetic reconnection are the main candidates. Acceleration of SEP may take place in the flare region, solar corona and even in the interplanetary space. It should be kept in mind that SEP themselves, while propagating, create conditions for the energy redistribution (Tylka, 2001; Lee, 2005). Therefore, the energy spectrum of SEP provides valuable information for study of solar and interplanetary plasma processes. Most energetic particles are usually (not always) accelerated during short time close to the energy explosion, thus the first particles arriving at the observer site keep more information about the primary acceleration process. Less energetic SEP may be accelerated during hours and even days. Conditions for particle acceleration in the corona and interplanetary space are determined by temporal and spatial evolution of a shock (e.g. Ellison & Ramaty, 1985).
Since the energy range of SEP extends over more than 5 orders of magnitude, and the SEP fluxes occupy more than 8 orders of magnitude, the SEP energy spectrum has never been measured by a single instrument. The bulk of the SEP observations has been performed on spacecraft and covers the particle energy below several hundreds MeV/n, whereas the relativistic solar particles have been observed by ground-based installations and remain less elucidated. This kind of observations and associated modeling can also be used to issue radiation alerts to be used by manned and unmanned missions. A multi-detector study of the solar particle event occurring in 2005 and the corresponding GLE69 was performed on-ground using NM and SREM radiation environment units in space Papaioannou et al. (2011)
It is not yet clear if relativistic solar particles require a special scenario for their generation. Some authors believe that relativistic solar protons have two components - the fast and the delayed ones. The fast component is initially accelerated in the flare region (e.g. Vashenyuk et al., 2006, 2008a, 2008b; McCracken & Moraal, 2008), probably via magnetic field reconnection, whereas another mechanism, probably shock or stochastic acceleration, generates the second particle component. Bieber et al. (2004, 2005) argue against two components and in favour of the CME-driven shock as a main accelerator of the whole SEP population. A wide variety in concomitant acceleration conditions supports the point that various mechanisms play the main role in different SEP events (Bombardieri et al., 2008; Bazilevskaya, 2009). Detailed studies of more solar particle spectra in wide energy range are needed to resolve this problem.
Since ground-based instruments can only detect secondary cosmic rays, knowledge of response to the primary particles is necessary in order to find SEP fluxes in space. Some methods were developed (Shea & Smart, 1982; Cramp et al., 1997; Bieber et al., 2004; Plainaki et al., 2007; Vashenyuk et al., 2006) to derive energy spectra and angular anisotropy of solar particles using the enhancements in the count rates of neutron monitors. Nevertheless, the particle fluxes derived from the neutron monitor data are model dependent.
Before the PAMELA launch, direct measurements of the relativistic solar particles were not fulfilled. The aim of this paper is to present the results of the first direct measurements by a single instrument of the solar protons in the energy range from 80 MeV to several GeV and the helium nuclei from 75 MeV/n up to 700 MeV/n during the SEP events of December 13 and 14, 2006. The absolute intensities and energy spectra are compared with the results of direct (GOES, ACE) and indirect (neutron monitors, IceTop) measurements.
2 Instrument Description
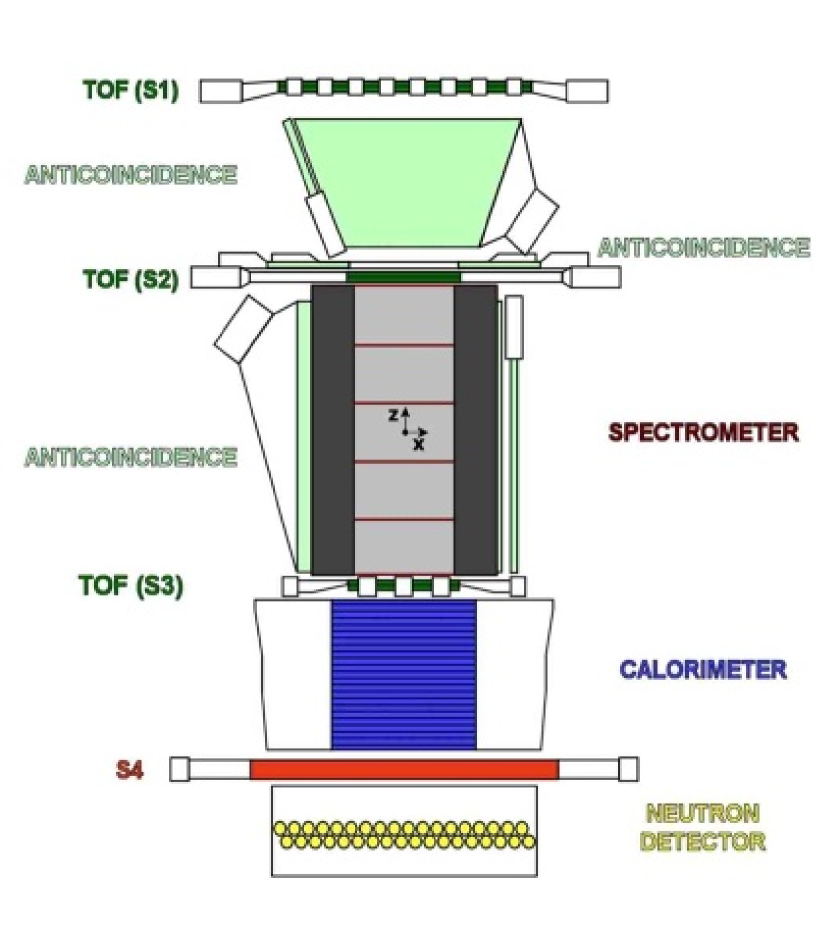
The PAMELA spectrometer (Figure 1) consists of a number of highly redundant detectors capable of particles detection trough the determination of their charge, mass, rigidity and velocity over a very wide energy range. Total weight of PAMELA is 470 kg; power consumption is 355 W.
A more detailed description of the device and the data handling can be found in (Picozza et al., 2007; Casolino et al., 2006b, c). The core of the instrument is a spectrometer, constituted by permanent magnet with a silicon microstrip tracker providing momentum and charge (with sign) information (Adriani et al., 2003). The permanent magnet is 43.66 cm high and constructed of 5 modules with high residual magnetic induction (0.43 T) providing an almost constant magnetic field value in the cavity. The tracking system (Ricciarini, 2007) is composed of 6 planes of high-precision Si microstrip detectors, positioned between the 5 magnetic modules of the tower, with uniform vertical spacing of 8.9 cm. Each silicon plane performs measurements of energy release and track position with a precision of about (X - bending view) and (Y view).
A scintillator system (Barbarino et al., 2003) provides trigger, charge and time of flight (TOF) information. It is composed of three double layers S1, S2, and S3, divided in various bars for a total of 48 scintillator paddles. It is also used to reject albedo particles which cross the detector from bottom to top.
An anticoincidence system (CARD, CAT, and CAS) is used to reject spurious events in the off-line phase.
A silicon-tungsten calorimeter (Boezio et al., 2002) is used to perform hadron/lepton separation. It is composed of 44 silicon layers interleaved by tungsten planes for a total of (radiation lengths) and (nuclear interaction lengths).
A shower tail catcher S4 and a neutron detector at the bottom of the apparatus are used to increase lepton/hadron separation.
Around the detectors are housed the readout electronics, the interfaces with the CPU and all primary and secondary power supplies. All systems are redundant with the exception of the CPU which is more tolerant to failures. The system is enclosed in a pressurized container located on one side of the Resurs-DK1 satellite.
3 Data Selection and Analysis Criteria
3.1 Geometrical Factor and Top of the Payload correction
The Geometrical factor () of the detector has been evaluated defining a fiducial area consisting of a frame of from the walls of the wide magnetic cavity. Only particles inside this fiducial area have been selected. This reduced volume ensures that all particles entering the magnetic cavity cross the scintillators and do not hit the magnet walls. The value of , constant within , has been estimated with a numerical calculation and cross-checked with a Monte Carlo simulation where all the physical interaction processes are inactive, with the exclusion of particle bending in the magnetic field. The two values of have been found in agreement within .
Interactions losses, due to local interactions where taken into account as a scale factor added to the Geometrical Factor. Protons and helium nuclei may be lost due to scattering and/or hadronic interactions in the Al thick pressurized container in which PAMELA is housed or in the top of the detector. Correction factors amounts to for protons and for He due to the different cross section of the two species.
3.2 Trigger system
In low radiation regions, close to the geomagnetic equator and outside the South Atlantic Anomaly, where PAMELA crosses the trapped protons of the inner Van Allen belt, particles must cross at least one of the two layers of the three scintillator systems (, , ) to provide a valid trigger. In low cutoff regions or in the Van Allen belts, where particle rate is higher, signal is not required to avoid random triggers due to the high number of particles. Given the low energy of solar particles compared to the galactic nuclei, in this analysis we have used particles selected in high latitude regions and thus taken with only ( and ) configuration.
3.3 Live Time
The live time of the apparatus is evaluated using the scintillator and trigger system. The counters for the live and dead time (, ) are cross-checked with the on-board time of the CPU, measuring the acquisition time (), to remove possible systematic errors due the counting method. The error associated with clock resolution is negligible compared to other sources of systematic errors.
3.4 Event Selection
3.4.1 Time of flight system selection
In this analysis we have selected events that do not produce secondary particles in the and scintillators and in the tracker, requiring a single fitted track within the spectrometer fiducial acceptance and a maximum of one paddle hit in and matching the extrapolated from the tracker trajectory.
Particles interacting in the satellite can produce showers with different secondaries hitting the scintillator pads. These showers may produce random coincidences in the scintillators: they are rejected by means of anticoincidence and TOF cuts. We require the absence of hits in the anticoincidences around the empty area between and and around the top magnetic cavity (CARD and CAT respectively). No constraints on the anticoincidences around the magnet (CAS) and have been put, since they are more often hit by backscattered secondaries produced in the calorimeter. The probability for such particles to hit CARD and CAT has been estimated with experimental data and cross-checked with Monte Carlo simulations. This efficiency has been included in the proton flux estimation. No constraints on the anticoincidence have been imposed for helium.
The timing information of the TOF scintillator paddles along the extrapolated trajectory is used to evaluate the of the particle. Albedo particles crossing the detector from bottom to top are discarded by requiring a positive .
3.4.2 Proton and Helium identification
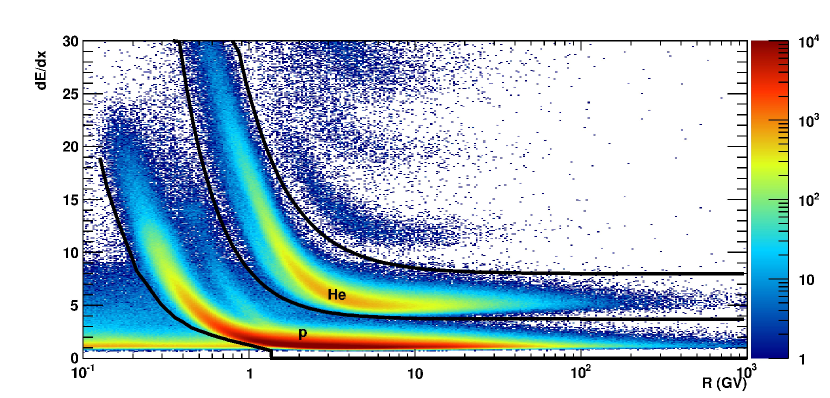
Since average energy loss of a charged particle through matter follows Bethe Bloch formula, (neglecting logarithmic terms), the measurement of the average energy released in the tracker planes for a given event at a given rigidity can be used to identify different particles. Proton and helium candidates have been selected requiring energy loss in the tracker planes compatible with Z=1 and Z=2 nuclei.
Cuts in the energy loss (dE/dx) vs. rigidity remove positrons, pions and particles with as shown in Figure 2. The bands in the Figure due to protons and helium nuclei which have energy loss in the tracker times protons, are identified. Events with small energy losses below 1 GV are due to positrons, relativistic also at low rigidities and the background of secondary pions. The contribution from these two particles are negligble respect to protons above 1 GV. The black lines show the rigidity dependent cuts used to select the proton and helium samples. From the same figure the deuterium contribution at low rigidities can also be identified, resulting in a band with energy releases higher than protons. In this work we did not discriminated between isotopes.
Using the redundancy of energy loss measurements in tracker and TOF, residual contamination of protons in the helium sample has been found to be below 0.5 in the energy range used for this work.
3.4.3 Geomagnetic Selection
The high inclination () orbit of the Resurs-DK1 satellite allows particles of different origin and nature to be studied. To separate the primary (solar and galactic) component from the reentrant albedo component (particles produced in cosmic ray interactions with the atmosphere below the cutoff and propagating along Earth’s magnetic field line), we evaluated the local geomagnetic cutoff in the Störmer approximation (Shea et al., 1987). The value of - valid for vertically incident particles - is estimated calculating the McIlwain shell with IGRF magnetic field model along the orbit (NOAA, 2011b). Particles were selected requiring to remove any effect due to directionality in the detector and Earth’s penumbral regions.
3.4.4 Tracker selection
Particle rigidity is obtained fitting it’s track in the spectrometer. In this analysis we selected events with a single track fully contained inside the fiducial acceptance.
For each particle, the tracking system provides up to 12 position measurements (6 in the bending view), which are interpolated with a trajectory evaluated by integrating the equations of motion in the magnetic field. At low rigidies (below ) we have corrected for the energy loss in the detector.
The Maximum Detectable Rigidity (MDR) for a given detector is defined as the rigidity for which the relative error on the rigidity and varies between 200 GV and 1.5 TV, depending on delta-ray production and event’s topology. In this analysis, therefore, the particle rigidity is well below the MDR and thus is no MDR requirements have been applied.
3.4.5 Selection efficiencies and residual contamination
The tracker efficiency has been measured selecting a sample of events which leave straight tracks in the calorimeter and do not interact hadronically. These tracks were propagated back through PAMELA acceptance and tracker efficiency has been evaluated.
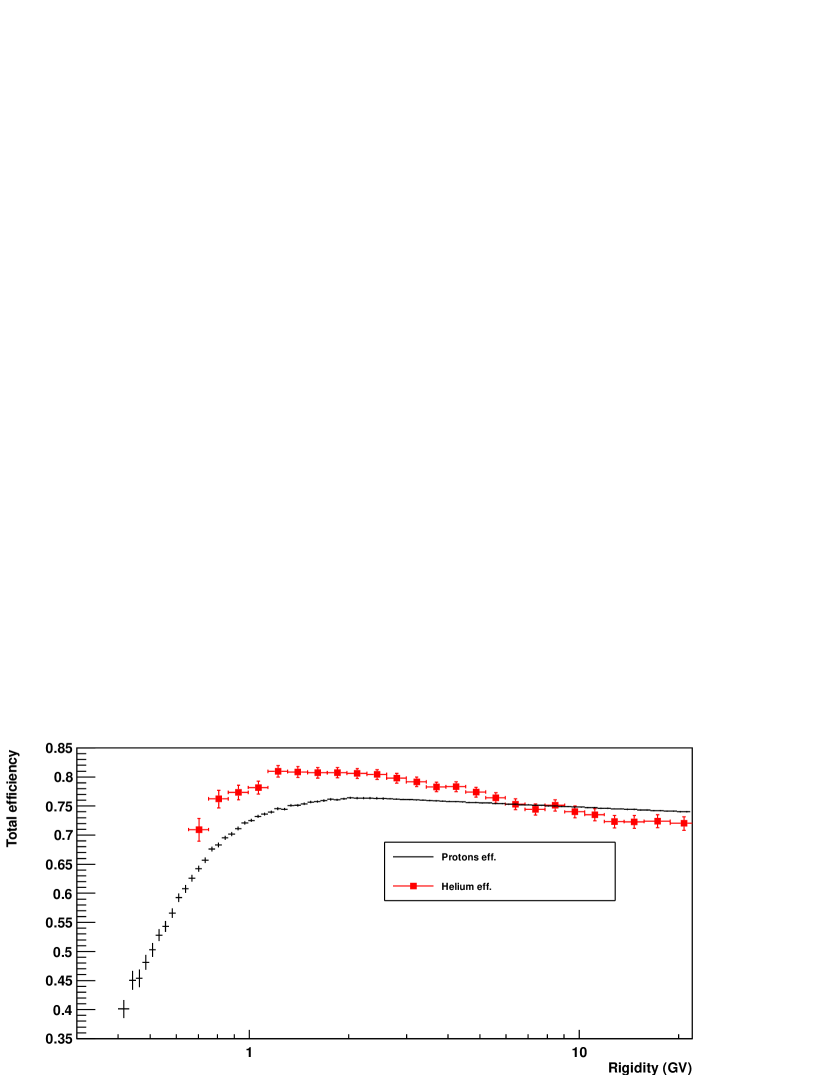
The total selection efficiencies for both species has been obtained as a product of Tracker, TOF (anticoincidence) efficiencies. The resulting efficiencies for proton and helium nuclei after all above mentioned cuts are shown in Figure 3. For a detail discussion see Adriani et al. (2011).
Although we put strong requirements on Tracker, TOF and anticoincidence systems, nevertheless there is residual contamination of secondary particles produced on the top of the payload entering the PAMELA acceptance window and passing selection cuts. The maximum contribution to the background for protons comes from secondary single-charge particles (positrons and pions). In case of helium, rejection power of our selection cuts is enough to make residual contamination negligible. In order to estimate this contamination we carried out a Monte Carlo simulation of the protons and helium nuclei hitting the PAMELA pressurized container. Two different hadronic interactions packages, based on Fluka (Battistoni et al., 2007; Ferrari et al., 2005) and Geant 4 (Allison et al., 2006; Agostinelli et al., 2003), have been employed to simulate these interactions. This background decreases with increasing energy and amounts to less than few percents at 1 GV. Flux attenuation was estimated with an energy dependent simulation and it is constant above several GV.
4 December 13 and 14, 2006 Solar Particle Events
4.1 General description
The most significant SEP fluxes detected by PAMELA were started on December 6, 13 and 14, 2006 and originated from the active region NOAA 10930. December 6 event originated at the East limb resulting in a gradual proton event reaching the Earth on December 7 and lasting until the events of December 13 and 14. Due to a scheduled maintenance procedure, no data were collected by PAMELA tracker during December 6 event, requiring a different analysis approach that will be discussed in a forthcoming paper. On December 13 2006, at 0214 UT an X3.4/4B solar flare occurred in the same active region NOAA 10930 (S06W23) (NOAA - STP, 2006). The intensity of the event was quite unusual for a solar minimum condition. This event produced also a full-halo Coronal Mass Ejection (CME) with the sky plane projected speed of 1774 km/s (Laboratory, 2011). The forward shock of the CME reached Earth at 1438 UT on December 14, causing a Forbush decrease of galactic cosmic ray intensities which lasted for several days.
The flare X1.5 (S06W46) at 2107 UT on December 14 gave start to a new growth of particle intensity as recorded by PAMELA and other satellites. The maximum energy of protons was below 1 GeV, therefore no ground level enhancement (GLE) was recorded. The corresponding CME had a velocity of 1042 km/s.
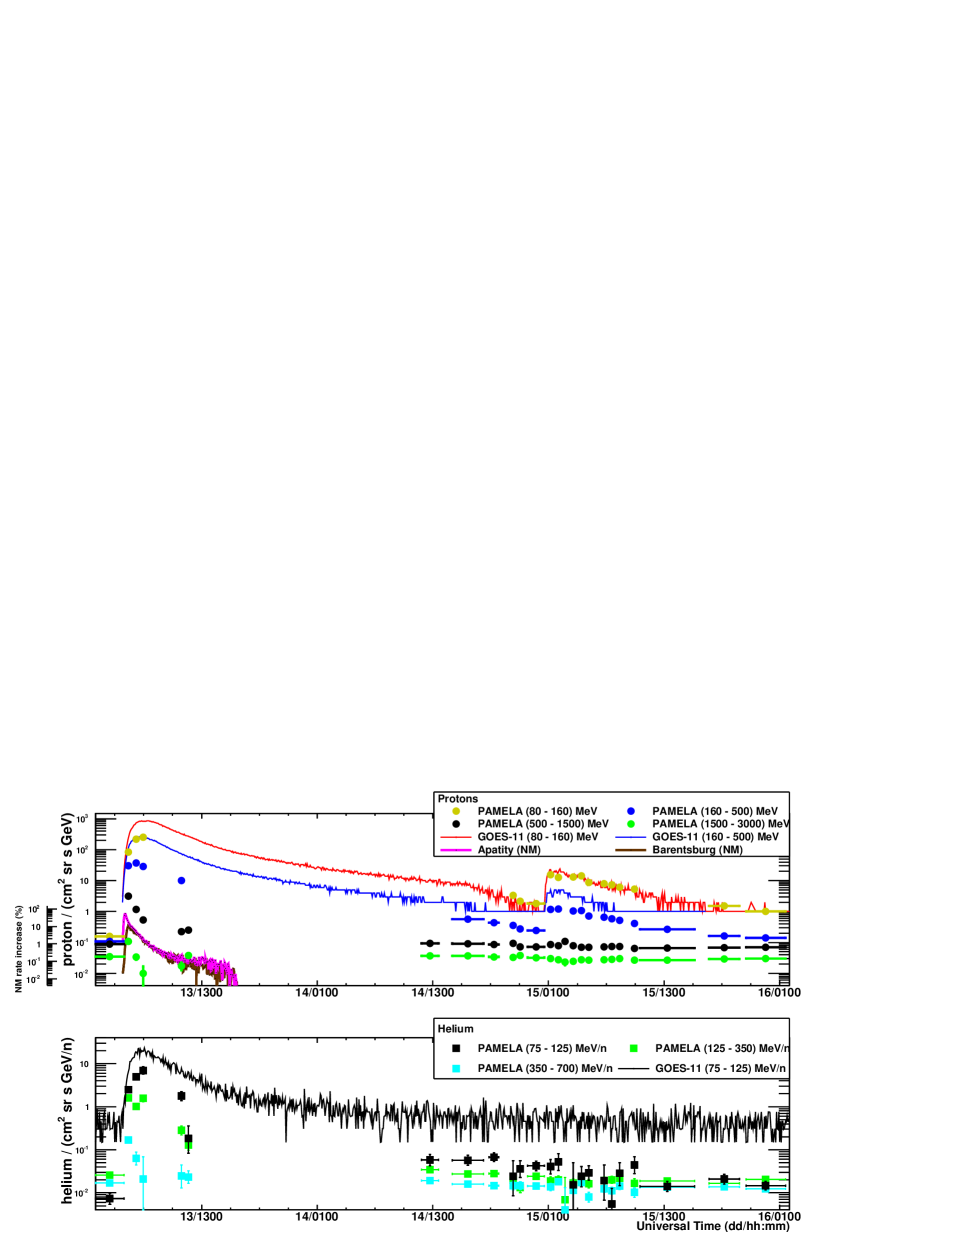
Figure 4 shows the solar particles intensity time profiles with various energies as observed by the PAMELA spectrometer, GOES-11 and neutron monitors. Ground-based neutron monitors started recording of SEP at 0248 UT, while the near-Earth satellites responded later to SEP of lower energies. First solar protons arrived at the Earth’s orbit with anisotropic pitch-angular distribution which resulted in different intensity-time profiles at neutron monitors situated at location with the same geomagnetic cutoff but different asymptotic directions of incoming particles. A highly collimated bunch of relativistic solar particles was observed by the muon hodoscope URAGAN at 0256-0304 UT (Timashkov et al., 2008). Anisotropy vanished by 0430 UT (Vashenyuk et al., 2008a).
The whole energy range of SEP detectable by the PAMELA spectrometer can only be taken in the high latitude regions, where the geomagnetic cutoff is lower than the rigidity of solar particles. Measurements were performed during 5 passages of PAMELA through the polar regions on December 13. Data were missed from 1000 UT of December 13 till 0914 UT of December 14 because of onboard system reset of the satellite.
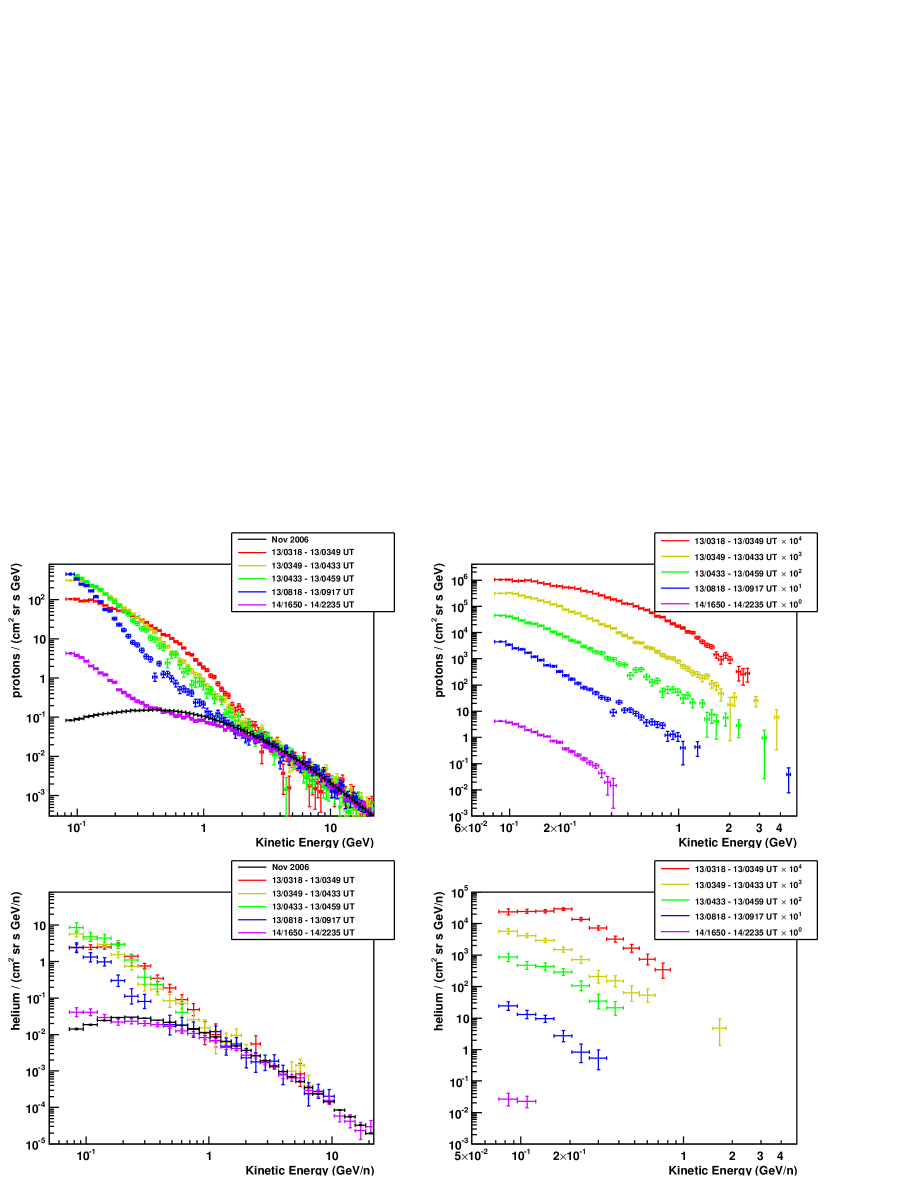
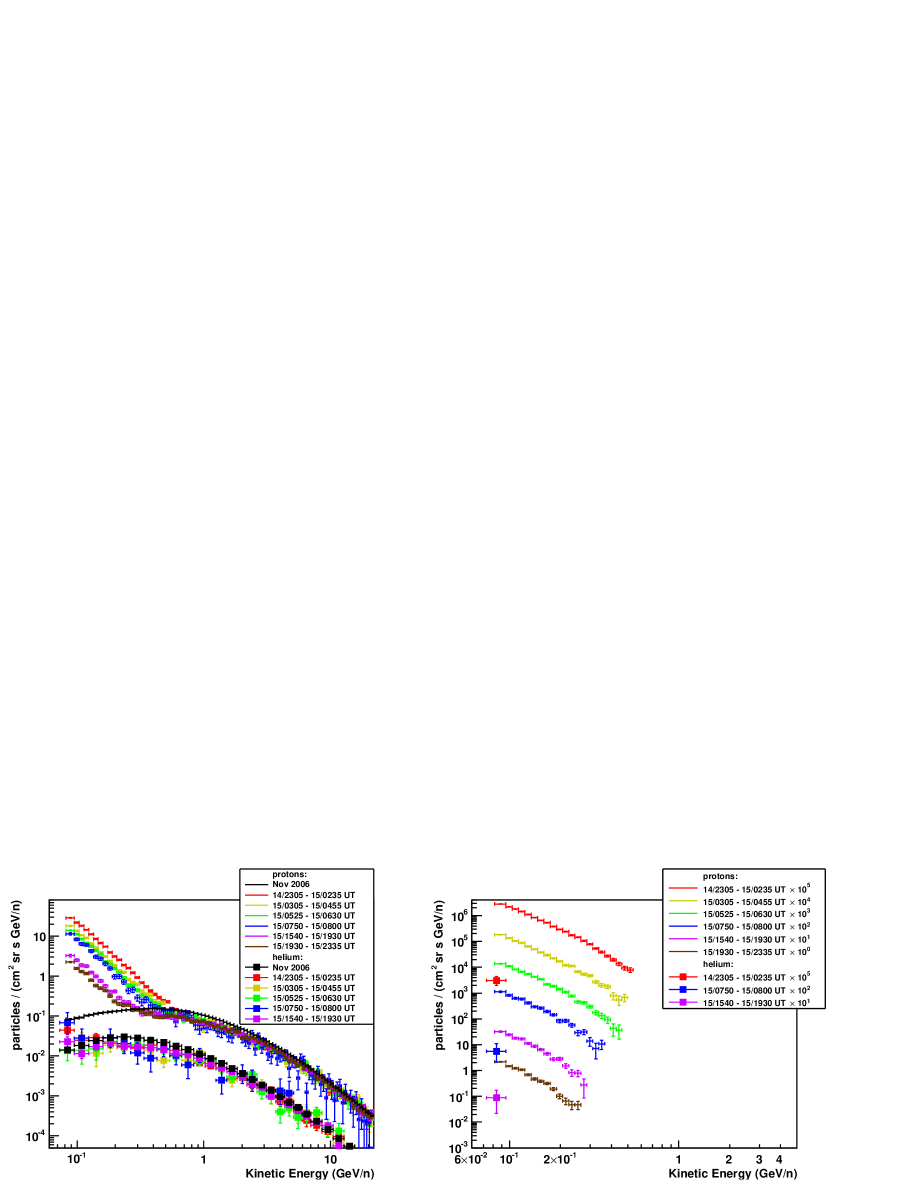
The results of PAMELA measurement during the December 13 and 14, 2006 SEP events are shown in Figure 5 and 6 respectively. The quiet time galactic spectra were measured in November 2006. The first (southern) polar passage of PAMELA started at 0318 UT and showed strongly flattening of p and He spectra at energies 200 MeV/n. The helium spectrum in the initial phase of the December 13 event is almost similar in shape to the proton one, but flatter at energies below 200 MeV/n. In the event of December 13 the initial spectra were rather hard and changed significantly at least till 1000 UT. Further evolution of the proton and helium spectra was rather smooth even in spite of a Forbush effect in the middle of December 14, until arrival at 2300 UT of the SEP accelerated in the flare at 2107 UT on December 14. The intensity of 100 MeV protons firstly increased till 0400 UT on December 13 and stayed at almost the same level for at least 4 hours, while higher energy particles were rather rapidly removed from the Earth’s vicinity. After that, the particle intensity decreased, but the spectrum shape was almost constant. Flux intensity did not decrease to the solar quiet levels because of the onset of December 14 event. During this event spectral form slightly flattened in the lower energy part thus remaining quasi-exponential. The highest proton energy for this event was around 500 MeV.
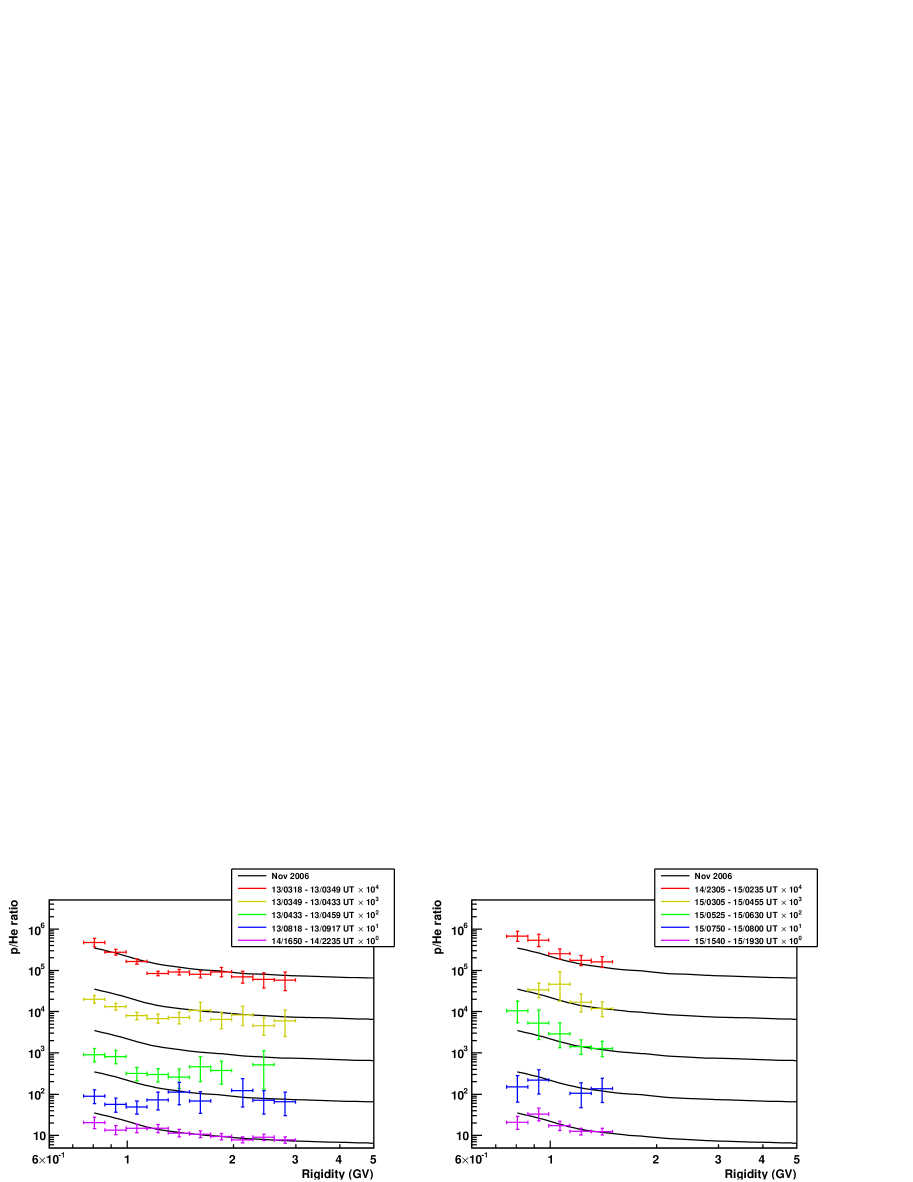
We have examined temporal behavior of proton-to-helium ratio in the both solar events. For this analysis the rigidity spectra were evaluated with rigidity intervals chosen in accordance with Adriani et al. (2011). Figure 7 presents the proton-to-helium ratio obtained in selected time intervals. The galactic background was not subtracted and is shown as a black curves. It is seen in the left panel of Figure 7 that at the beginning of the December 13 event the ratio was almost the same as for GCR (note that SEP intensity was highest at that time). The subsequent measurements showed the enhancement of He relative to protons up to the late December 14 when the high rigidity He virtually disappeared after subtraction of the galactic flux. Such a behavior may to a first approximation be interpreted as a result of faster removing of solar protons from the Earth’s orbit. Protons have higher velocity than He of the same rigidity therefore the diffusion coefficient of He at the same rigidity is smaller and protons leave faster. Further analysis needs a particle propagation modeling. Right panel of Figure 7 clearly shows that no solar helium with rigidity above 1 GV was observed in the event of December 14.
No analysis directed to search of and has been performed yet. No electrons or positrons of solar origin were found by the PAMELA. However, it should be noted that the energy threshold of PAMELA is at 50 MeV, therefore rather high for solar electrons.
4.2 Initial phase of the December 13, 2006 event
The first arriving particles are objects of special interest because they provide more information about mechanism and conditions of acceleration. As it was mentioned, solar particles at the initial phase of the December 13 event demonstrated highly anisotropic angular distribution. In such conditions the asymptotic directions of particles arriving at PAMELA should be taken into account.
The geomagnetic field acts not only as rigidity analyzer but also as an angular analyzer of charged particles coming from space. Because of declining in the geomagnetic field a particle with certain rigidity above the geomagnetic cutoff can arrive at a given site only from a definite direction outside the magnetosphere (asymptotic direction). Therefore, at any point of its orbit PAMELA accepted particles with certain rigidity from only one asymptotic direction.
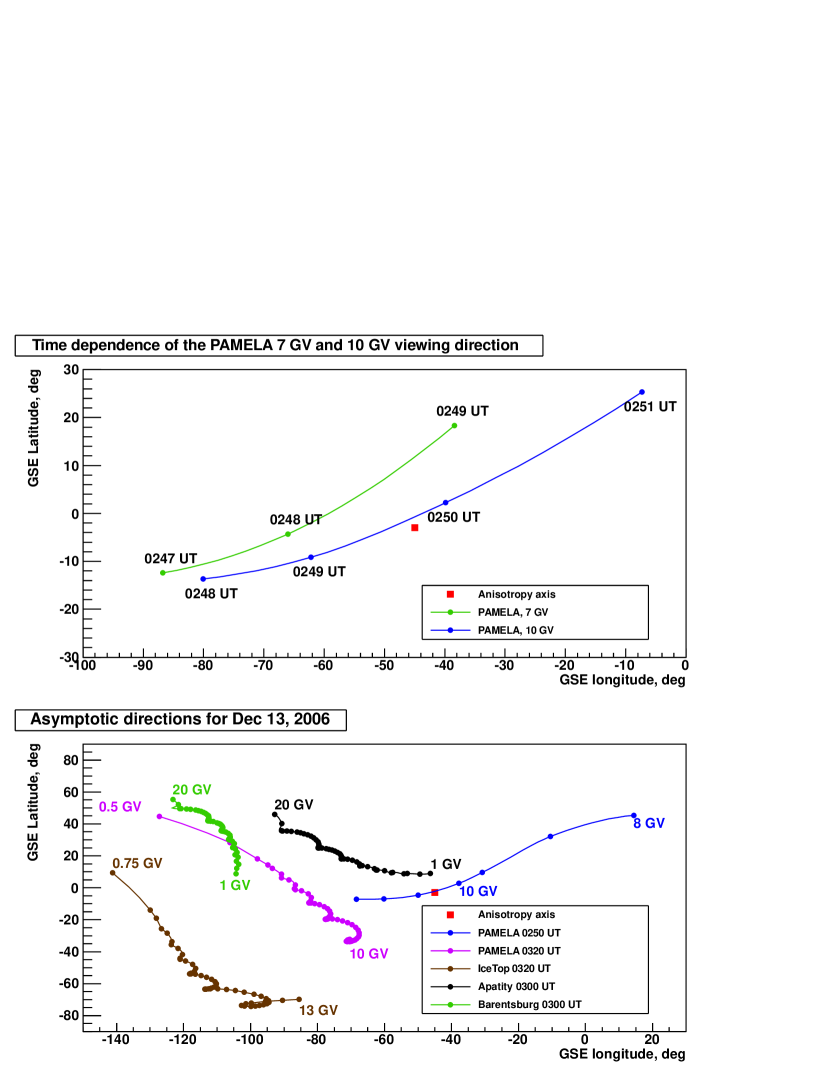
At the moment of the first particle arrival PAMELA was at the latitude of 40N moving to the equator. Therefore the low energy particles could not reach the PAMELA detector. In addition, viewing directions of PAMELA were changed rapidly while the spacecraft moved along the orbit. This can be seen in the upper panel of Figure 8 where the asymptotic directions of 7 GV and 10 GV protons arriving at PAMELA are shown for the initial phase of the SEP event. The asymptotic viewing directions of PAMELA has been calculated with the program of Gvozdevsky (2009) using the back-tracing of solar particle trajectories and the magnetospheric model of Tsyganenko (2002). It is in reasonable agreement with Plainaki et al. (2009b) obtained with the Tsyganenko 1989 model. The direction of the SEP anisotropy axis, i.e. direction from which the bulk of SEP comes is also plotted (Vashenyuk et al., 2008a). According to Figure 8, PAMELA viewing directions at the early phase of the SEP event would allow the solar protons in the range of 7-10 GV to be recorded by PAMELA at 0248-0250 UT as these particles arrived within a 30 degree cone around the SEP flux axis. However, above 3 GeV the statistic is poor and we have found no increase of proton flux there. Changes in the viewing directions of PAMELA resulted in rapid receding of its favorable direction of acceptance from the solar proton anisotropy axis. By 0256 UT (when a collimated particle bunch was observed by Timashkov et al. (2008)) the geomagnetic cutoff of PAMELA was 12 GV and only protons with rigidity between 15 and 17 GV could come from directions close to the anisotropy axis.
The lower panel of Figure 8 shows the asymptotic directions of particles with different energies arriving at PAMELA in the beginning of the event and at the most optimal time of observation when the energy spectrum of particles with energies above 80 MeV/n was measured. For comparison, the asymptotic directions for the Apatity neutron monitor and for the IceTop installation (Abbasi et al., 2008) are shown in Figure 8.
4.3 Comparison with other data
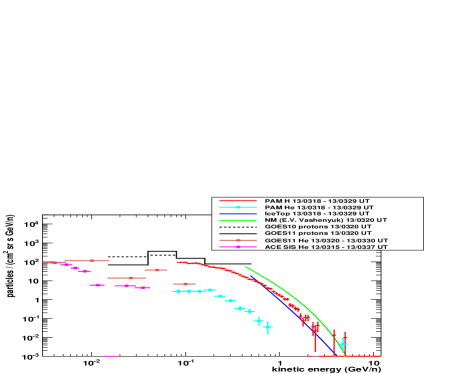
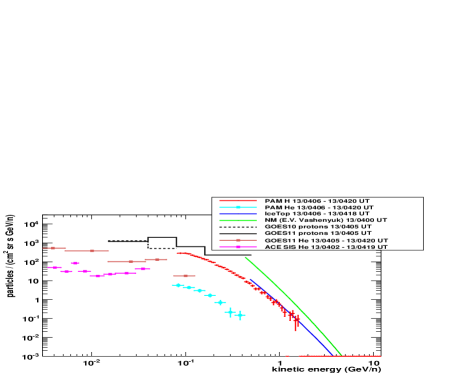
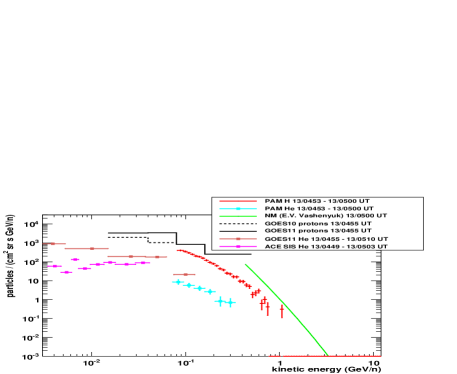
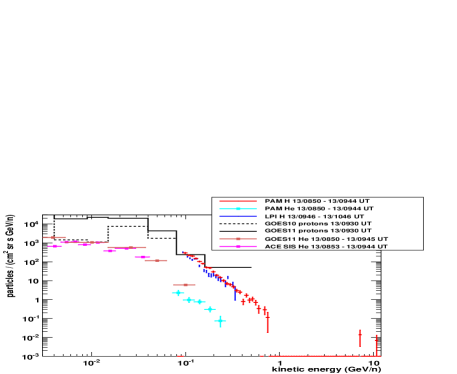
In Figure 9 the differential spectra of PAMELA with the galactic background subtracted are compared with other experiments. Each panel corresponds to different time period.
In the low-energy range PAMELA particle fluxes can be compared with other spacecraft measurements. The GOES (NOAA, 2011a) fluxes are in moderate agreement with PAMELA ones, with exception for the most energetic GOES band (160-500 MeV) where GOES fluxes are several times higher. The same is true for GOES helium spectra. This could be due to contamination of lower energy particles in these GOES channels. On the other hand, the PAMELA helium fluxes are in a good agreement with measurements, performed by ACE/SIS (ACE, 2011) in the adjacent energy interval.
At high energy, our data can be compared with the IceTop shower array (Abbasi et al., 2008) and the NM network(Vashenyuk et al., 2008a). The results of the IceTop shower array are plotted in Figure 9a, b specially taken at the time intervals of PAMELA observations (Kuwabara, 2009). The IceTop installation has detected secondary particles, generated by the solar energetic particles, i.e. the calculated yield functions have been used to reconstruct the primary SEP fluxes. The IceTop results are depicted only in the energy range over which this detector was actually seeing a significant number of particles. The SEP fluxes obtained by PAMELA and those obtained by IceTop is in relatively good agreement. However, at 0318-0329 UT (Figure 9a) the power-law shape of the IceTop spectrum does not match the PAMELA spectrum which is more exponential-like. At 0406-0420 UT (Figure 9b) the spectra of PAMELA and that of IceTop are virtually coincident in the overlapping energy range.
The energy spectra from the NM network have been derived from the early phase of the event (before 0300 UT on December 13) till 0500 UT on December 13 (Balabin, 2009). As already mentioned, PAMELA missed the early phase of the event and took the first measurement at 0318-0329 UT, during mildly anisotropic particle arrival (Figure 9a). A shape of the PAMELA proton spectrum is close to that derived from the neutron monitor network at energies between 700 MeV and 2 GeV. At lower energies the PAMELA spectrum is harder; at GeV the uncertainty in the PAMELA spectrum is high because of small statistics. The absolute intensities of protons from PAMELA are somewhat lower than those derived from neutron monitors even at energies above 1 GeV. To some extent, discrepancy between the PAMELA and neutron monitor spectra may be caused by the flux anisotropy.
The GLE parameters for this event have also been calculated using the NM-BANGLE model Plainaki et al. (2009a). The direct comparison of the particle fluxes is difficult since these data in Plainaki et al. (2009a) are given only for integral energy spectra (see their Figure 3). An estimation shows that the results of the NM-BANGLE model are very close to the spectra obtained by Vashenyuk et al. (2008a) and therefore differ from the PAMELA results in similar manner. Figure 4, shows that during the first polar passage of PAMELA (0318-0329 UT) the Apatity and Barentsburg neutron monitors demonstrated different rate enhancements, i.e. the SEP fluxes were still anisotropic. The neutron monitor spectrum refers to the direction of the anisotropy axis where the proton intensity is maximal. The PAMELA viewing directions for the protons below 3 GV (see lower panel of Figure 8) were not very close to the anisotropy axis, therefore the PAMELA fluxes may be lower than derived from neutron monitors. By the next PAMELA polar passage (0406-0420 UT) discrepancy between the PAMELA and neutron monitor spectra increased (Figure 9b). Since the flux anisotropy becames lower, one should expect better consistency between the PAMELA and neutron monitor data. On the contrary, observations show discrepancy which persisted at around 0500 UT (Figure 9c). Particle fluxes changed slowly at 0800-1000 UT, so in order to increase statistical significance, the PAMELA results were averaged over 0850-0944 UT (Figure. 9d). By this time the effect on the neutron monitor network was already too small for determining the solar proton spectrum. However, the PAMELA results were confirmed by an independent observation of the LPI balloon-borne detector (Stozhkov et al., 2007) which measured solar proton energy spectrum in the stratosphere at 0946-1046 UT. Energy of solar protons is determined in the LPI experiment from absorption of protons in the air, so this is also a direct measurement of solar protons although in the limited energy interval (Bazilevskaya et al., 2010). The good agreement between proton data of the two instruments in the energy range 90 MeV - 400 MeV is an additional check that our efficiency and systematics are under control.
5 The energy spectrum fitting
The observed spectral shape may give some indications on the acceleration mechanism (Casolino et al., 2008). The proton energy spectrum measured in the early phase of the event, which is most close to the time of primary acceleration (0318-0349 UT), was fitted by the functions representative of various acceleration processes:
| (1) | |||
| (2) | |||
| (3) | |||
| (4) |
where is the proton flux intensity, is kinetic energy, is magnetic rigidity, c is particle velocity, and is a modified Bessel function of order 2, with as free parameter ( representing an acceleration rate and the escape time from the acceleration region). An exponential in kinetic energy (1) or rigidity (2) function is typical for simple models of DC acceleration (Vashenyuk et al., 2006, 2008a, 2008b), a power law is indicative of shock acceleration (Axford, 1981; Krymskii, 1977; Ellison & Ramaty, 1985), and Bessel function is resulted from stochastic acceleration (McGuire & von Rosenvinge, 1984). The best fit parameters of approximation are presented in Table 1.
| Function | A, | Parameters | ||
| , MeV | 3.0 | |||
| , MV | 7.6 | |||
| , | 4.1 | |||
| 6.4 | ||||
It should be mentioned that even if the resulting fits reproduce rather nicely the spectral shape, values are high for all of them (see Table 1), showing that these analytical formulas do not correctly describe the spectrum in the whole energy range. The best fit is obtained for the exponential in kinetic energy function (1), however it fails to describe the highest and lowest energy tails where the observed spectrum is harder (in the and GV range). It proves that no single mechanism can describe the SEP energy spectrum in the wide energy interval. The previous successful attempts of the SEP spectra fitting (e.g. Cramp et al., 1997; Vashenyuk et al., 2008a) were possible only for narrower energy range.
6 Discussion and conclusion
The PAMELA spectrometer was the first instrument which directly measured the relativistic SEP in the near Earth space. It is important since all previous such measurements were fulfilled with the ground-based installation and the derived SEP fluxes depended on the instrument response functions. The spectra of solar protons in the energy range 80 MeV - 3 GeV and helium 75 MeV/n - 1 GeV/n were measured during the first polar PAMELA passage at 0318-0329 UT. There is a good agreement between the protons fluxes measured by PAMELA and those obtained by the IceTop installation (Abbasi et al., 2008; Kuwabara, 2009). Keeping in mind accuracy of estimation of absolute SEP intensities from the neutron monitor data (Vashenyuk et al., 2006; Plainaki et al., 2007; Bombardieri et al., 2008; Plainaki et al., 2009a), reasonable agreement can be stated between the PAMELA and neutron monitor SEP fluxes. However, the PAMELA spectra are always harder in the low-energy interval probably indicating that neutron monitor yield functions are underestimated below 700 MeV. During the second polar PAMELA passage the difference between the SEP fluxes taken from PAMELA and neutron monitors has become larger while agreement between PAMELA and IceTop remained very good. The correctness of the PAMELA observations was also confirmed by agreement with the direct SEP measurement on a balloon in the atmosphere.
Evolution of intensity and spectral shape of relativistic solar protons is often used to derive some information about SEP generation (Bombardieri et al., 2008; Vashenyuk et al., 2006, 2008a, 2008b; McCracken & Moraal, 2008; Moraal et al., 2008). The indications were found that the first arriving relativistic particles would be accelerated in the flare region and have an exponential spectrum whereas the latter particles would be accelerated by a CME-driven shock and have a power-law spectrum. In this case an appropriate dynamics of the energy spectrum could be observed by PAMELA. Being at the low latitudes PAMELA missed the earliest anisotropic phase of the event of December 13. The results of the first PAMELA observation around 0320 UT on December 13 confirmed existence of a hard quasi-exponential spectrum expected from the magnetic reconnection in the flare region. However, in spite of changes in the SEP intensity a quasi-exponential spectrum persisted, actually till the advent of the newly generated protons of the December 14 event. It should be noted that in the energy interval relevant to the neutron monitor observations ( 500 MeV) the spectrum could be fitted by a power law beginning from 1000 UT, however at lower energies the spectrum was flatter. We did not find any spectral form which would fit the observed spectra satisfactorily in the whole energy range and could prove a certain dominating mechanism of SEP acceleration. A quasi-exponential spectrum and fast temporal evolution of particle fluxes during several hours were present only in the event of December 13 when the relativistic protons were generated. In the event of December 14, without relativistic particles, a form of the solar proton energy spectra changed little and was almost power-law throughout the event. In addition, no Helium with energy above 100 MeV/n was observed in the December 14 event. This may be indicative of special conditions leading to acceleration of particles up to relativistic energy.
Acknowledgment
We acknowledge support from The Italian Space Agency (ASI), Deutsches Zentrum für Luft und Raumfahrt (DLR), The Swedish National Space Board, The Swedish Research Council, the Russian Space Agency (Roscosmos) and the Russian Foundation for Basic Research. We thank the IceTop team and the Polar Geophysical Institute cosmic ray group (Apatity) for providing the IceTop and the neutron monitor spectra at the times of PAMELA measurements, the ACE SIS instrument team and the ACE Science Center for providing the ACE data. Our thanks are also to all people who make their results accessible through the Internet.
References
- Abbasi et al. (2008) Abbasi, R., et al. 2008, The Astrophysical Journal, 689, L65–L68
- ACE (2011) ACE, C. 2011, ACE Level2 Data, http://www.srl.caltech.edu/ACE/ASC/level2/
- Adriani et al. (2011) Adriani, O. et al. 2011, Science, 332, 69
- Adriani et al. (2009a) ——. 2009a, Nature, 458, 607
- Adriani et al. (2009b) ——. 2009b, Physical Review Letters, 102, 051101
- Adriani et al. (2003) ——. 2003, Nuclear Physics B - Proceedings Supplements, 125, 308
- Agostinelli et al. (2003) Agostinelli, S., et al. 2003, Nuclear Instruments and Methods in Physics Research Section A: Accelerators, Spectrometers, Detectors and Associated Equipment, 506, 250
- Allison et al. (2006) Allison, J. et al. 2006, IEEE Transactions on Nuclear Science, 53, 270
- Axford (1981) Axford, W. I. 1981, Annals of the New York Academy of Sciences, 375, 297
- Balabin (2009) Balabin, Y. 2009, private communication
- Barbarino et al. (2003) Barbarino, G. et al. 2003, Nuclear Physics B - Proceedings Supplements, 125, 298
- Battistoni et al. (2007) Battistoni, G., Cerutti, F., Fasso, A., Ferrari, A., Muraro, S., Ranft, J., Roesler, S., & Sala, P. R. 2007, AIP Conference Proceedings, 896, 31
- Bazilevskaya (2009) Bazilevskaya, G. 2009, Advances in Space Research, 43, 530
- Bazilevskaya et al. (2010) Bazilevskaya, G., Makhmutov, V., Stozhkov, Y., Svirzhevskaya, A., & Svirzhevsky, N. 2010, Advances in Space Research, 45, 603
- Bieber et al. (2005) Bieber, J. W., Clem, J., Evenson, P., Pyle, R., Ruffolo, D., & Saiz, A. 2005, Geophysical Research Letters, 32, L03502
- Bieber et al. (2004) Bieber, J. W., Evenson, P., Drge, W., Pyle, R., Ruffolo, D., Rujiwarodom, M., Tooprakai, P., & Khumlumlert, T. 2004, The Astrophysical Journal, 601, L103
- Boezio et al. (2002) Boezio, M., Bonvicini, V., Mocchiutti, E., Schiavon, P., Scian, G., Vacchi, A., Zampa, G., & Zampa, N. 2002, Nuclear Instruments and Methods in Physics Research Section A: Accelerators, Spectrometers, Detectors and Associated Equipment, 487, 407
- Bombardieri et al. (2008) Bombardieri, D. J., Duldig, M. L., Humble, J. E., & Michael, K. J. 2008, The Astrophysical Journal, 682, 1315
- Casolino et al. (2006a) Casolino, M. et al. 2006a, Advances in Space Research, 37, 1848
- Casolino et al. (2006b) ——. 2006b, Advances in Space Research, 37, 1857
- Casolino et al. (2006c) Casolino, M., Pascale, M. D., Nagni, M., & Picozza, P. 2006c, Advances in Space Research, 37, 1884
- Casolino et al. (2008) Casolino, M., et al. 2008, Two years of flight of the Pamela experiment: results and perspectives, http://adsabs.harvard.edu/abs/2008arXiv0810.4980C
- Cramp et al. (1997) Cramp, J. L., Duldig, M. L., Fluckiger, E. O., Humble, J. E., Shea, M. A., & Smart, D. F. 1997, Journal of Geophysical Research, 102, 24,237
- De Simone et al. (2009) De Simone, N., et al. 2009, in Proc. 31th ICRC
- Ellison & Ramaty (1985) Ellison, D. C., & Ramaty, R. 1985, The Astrophysical Journal, 298, 400
- Ferrari et al. (2005) Ferrari, A., Sala, P. R., Fassò, A., & Ranft, J. 2005, FLUKA: A Multi-Particle Transport Code, CERN Yellow Report
- Gvozdevsky (2009) Gvozdevsky, B. 2009, private communication
- Krymskii (1977) Krymskii, G. F. 1977, Akademiia Nauk SSSR Doklady, 234, 1306
- Kuwabara (2009) Kuwabara, T. 2009, private communication
- Laboratory (2011) Laboratory, U. N. R. 2011, Data on Coronal Mass Ejections, http://ares.nrl.navy.mil/cmelist.html
- Lee (2005) Lee, M. A. 2005, The Astrophysical Journal Supplement Series, 158, 38
- McCracken & Moraal (2008) McCracken, K. G., & Moraal, H. 2008, in Proc. 30th ICRC, Vol. 1, 269–272
- McGuire & von Rosenvinge (1984) McGuire, R. E., & von Rosenvinge, T. T. 1984, Advances in Space Research, 4, 117
- Moraal et al. (2008) Moraal, H., McCracken, K. G., & Stoker, P. H. 2008, in Proc. 30th ICRC, 265–268
- NOAA (2011a) NOAA. 2011a, Data of the GOES satellites, http://spidr.ngdc.noaa.gov/spidr
- NOAA (2011b) ——. 2011b, International Geomagnetic Reference Field, http://www.ngdc.noaa.gov/IAGA/vmod/igrf.html
- NOAA - STP (2006) NOAA - STP. 2006, X-ray solar flare data, ftp://ftp.ngdc.noaa.gov/STP/…/FLARES_XRAY/2006/xray2006
- Papaioannou et al. (2011) Papaioannou, A., Mavromichalaki, H., Gerontidou, M., Souvatzoglou, G., Nieminen, P., & Glover, A. 2011, Astrophysics and Space Sciences Transactions, 7, 1
- Picozza et al. (2007) Picozza, P. et al. 2007, Astroparticle Physics, 27, 296
- Plainaki et al. (2007) Plainaki, C., Belov, A., Eroshenko, E., Mavromichalaki, H., & Yanke, V. 2007, Journal of Geophysical Research, 112, A04102
- Plainaki et al. (2009a) Plainaki, C., Mavromichalaki, H., Belov, A., Eroshenko, E., & Yanke, V. 2009a, Advances in Space Research, 43, 474
- Plainaki et al. (2009b) ——. 2009b, Advances in Space Research, 43, 518
- Reames (1999) Reames, D. V. 1999, Space Science Reviews, 90, 413
- Ricciarini (2007) Ricciarini, S. 2007, Nuclear Instruments and Methods in Physics Research Section A: Accelerators, Spectrometers, Detectors and Associated Equipment, 582, 892
- Shea & Smart (1982) Shea, M., & Smart, D. 1982, Space Science Reviews, 32
- Shea et al. (1987) Shea, M. A., Smart, D. F., & Gentile, L. C. 1987, Physics of The Earth and Planetary Interiors, 48, 200
- Stozhkov et al. (2007) Stozhkov, Y., Svirzhevsky, N., azilevskaya, G., Svirzhevskaya, A., Kvashnin, A., Krainev, M., Makhmutov, V., & Klochkova, T. 2007, Preprint of Lebedev Physical Institute, Russian Academy of Sciences, Moscow
- Timashkov et al. (2008) Timashkov, D. A., Balabin, Y. V., Borog, V. V., & et al. 2008, in Proc. 30th ICRC, Vol. 1, 209–212
- Tsyganenko (2002) Tsyganenko, N. A. 2002, J. Geophys. Res., 107, 1176
- Tylka (2001) Tylka, A. J. 2001, Journal of Geophysical Research, 106, 25,333
- Vashenyuk et al. (2006) Vashenyuk, E. V., Balabin, Y. V., Gvozdevskii, B. B., & Karpov, S. N. 2006, Geomagnetism and Aeronomy, 46, 424
- Vashenyuk et al. (2008a) Vashenyuk, E. V., Balabin, Y. V., Gvozdevsky, B. B., & Shchur, L. I. 2008a, Geomagnetism and Aeronomy, 48, 149
- Vashenyuk et al. (2008b) Vashenyuk, E. V., Balabin, Y. V., Miroshnichenko, L. I., & et al. 2008b, in Proc. 30th ICRC, Vol. 1, 253–256