Revision of the 15N(p,)16O reaction rate and oxygen abundance in H–burning zones
Abstract
Context. The NO cycle takes place in the deepest layer of a H–burning core or shell, when the temperature exceeds K. The O depletion observed in some globular cluster giant stars, always associated with a Na enhancement, may be due to either a deep mixing during the RGB (red giant branch) phase of the star or to the pollution of the primordial gas by an early population of massive AGB (asymptotic giant branch) stars, whose chemical composition was modified by the hot bottom burning. In both cases, the NO cycle is responsible for the O depletion.
Aims. The activation of this cycle depends on the rate of the 15N(p,)16O reaction. A precise evaluation of this reaction rate at temperatures as low as experienced in H–burning zones in stellar interiors is mandatory to understand the observed O abundances.
Methods. We present a new measurement of the 15N(p,)16O reaction performed at LUNA covering for the first time the center of mass energy range 70–370 keV, which corresponds to stellar temperatures between 65 K and 780 K. This range includes the 15N(p,)16O Gamow–peak energy of explosive H–burning taking place in the external layer of a nova and the one of the hot bottom burning (HBB) nucleosynthesis occurring in massive AGB stars.
Results. With the present data, we are also able to confirm the result of the previous R–matrix extrapolation. In particular, in the temperature range of astrophysical interest, the new rate is about a factor of 2 smaller than reported in the widely adopted compilation of reaction rates (NACRE or CF88) and the uncertainty is now reduced down to the 10% level.
Key Words.:
physical data and processes: nuclear reactions, abundances1 Introduction
Hydrogen burning in stars proceeds through two different sets of nuclear reactions: the proton proton (pp) chain and the carbon nitrogen oxygen (CNO) cycle. While in low mass main sequence stars the energy supply is provided by the pp–chain111The pp–chain also dominates the H burning in extremely–metal–poor stars of any mass, due to the lack of C, N and O nuclei, the CNO cycle is the principal nuclear process in the core of high mass main sequence stars ( 1.2 ) as well as in the H–burning shell of giant stars Iben (1967). Furthermore, a hot CNO cycle may occur at the surface of H–accreting compact objects, like white dwarfs or neutron stars Jose & Hernanz (1998).
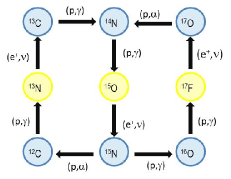
The set of nuclear reactions involved in the CNO cycle is illustrated in Fig. 1. Actually, it is a combination of two distinct cycles, called CN and NO, respectively. The proton capture on 15N results in two possible channels, the 15N(p,)12C and the 15N(p,)16O, respectively: the ratio of the rates provides the linkage between the CN and the NO cycles. The CN cycle becomes fully active when the temperature attains –222., while the NO cycle requires higher temperatures (–333 The activation temperatures of both the CN and the NO cycles depend on the actual amount of C, N and O nuclei and, therefore, on the stellar metallicity.). In case of an active NO cycle, this process determines the abundances of all the stable oxygen isotopes (16O, 17O, 18O). For this reason, a precise evaluation of the 15N(p,)16O reaction rate is needed to address several astrophysical problems, like deep mixing scenarios in red giant stars (see e.g. Sweigart & Mengel, 1979; Langer et al., 1886; Charbonnel & do Nascimento, 1998; Kraft et al., 1993; Bordeanu et al., 2008; Wasserburg et al., 1995; Denissenkov & VandenBerg, 2003; Palmerini et al., 2011), hot bottom burning nucleosynthesis in massive AGB stars Renzini & Voli (1981) or the H–burning nucleosynthesis in nova–like events Iliadis et al. (2002); Jose et al. (2007).
At low energies the cross section of the 15N(p,)16O reaction (–value = 12.127 MeV) is typically expressed in terms of the astrophysical S–factor defined for this reaction as:
| (1) |
where is the center of mass energy in keV.
In hydrostatic H–burning, the Gamow peak energy of this reaction ranges between 30 and 100 keV. Larger values, up to 300 keV, may be attained during explosive burning. In this energy range, the astrophysical S–factor is influenced by two resonances at = 312 and 964 keV444In the center of mass reference. Beam energies are given in the center of mass reference unless otherwise stated related to excited states in 16O at = 12440 and 13090 keV, respectively. The reaction rates reported in the NACRE Angulo et al. (1999) and the CF88 Caughlan & Fowler (1988) compilations are based on the direct measurement presented by Rolfs and Rodney (1974). However, more recent R–matrix studies Mukhamedzhanov et al. (2008); Barker (2008), which also take into account a previous ANC measurement Mukhamedzhanov et al. (2008), suggested a substantial reduction of the S(0) (i.e. the astrophysical factor at ). This result is in agreement with older direct measurements Hebbard (1960); Brochard et al. (1973).
This discrepancy prompted an in–depth study of the reaction at LUNA (Laboratory for Underground Nuclear Astrophysics). The LUNA facility has been designed to study nuclear reactions of astrophysical interest at the same energies of the stellar interiors, by taking advantage of the ultra–low background Bemmerer et al. (2005); Caciolli et al. (2009) of the INFN–Gran Sasso underground laboratory (a detailed description of LUNA and its experimental study of the pp chain and CNO cycle may be found in the following reviews: Costantini et al. (2009); Broggini et al. (2010)). First of all, a re–analysis of data taken with nitrogen gas target of natural isotopic composition (0.4% 15N) at = 90–230 keV has been performed Bemmerer et al. (2009). Then, a new measurement has been carried out at LUNA and Notre Dame LeBlanc et al. (2010). HPGe detectors and enriched TiN solid targets have been used to cover a wide energy range, namely: = 120–1800 keV. Although the minimum energy is still too high to study most of the stellar H–burning environments, thanks to the excellent accuracy (7%) and the wide energy range, this new experiment provided a dataset suitable for an R–matrix extrapolation toward lower energies.
In this paper, we present a third experiment performed at LUNA, designed to explore lower energies. The use a BGO detector, having a higher –detection efficiency compared to the HPGe detectors, allowed us to easily cover the 312 keV resonance region and to extend the direct measurements down to 70 keV. The aim of this further effort is twofold. First of all, the new data set covers the Gamow peak corresponding to the explosive burning in Novae as well as hot bottom burning in massive AGB stars. Furthermore, it provides an independent test of the low energy R–matrix extrapolation.
In the next section we illustrate the experiment, the data analysis and the results. In particular, a comparison of the present, independent measurement with the low energy predictions of the R–matrix analysis LeBlanc et al. (2010), leads to the conclusion that the 15N(p,)16O reaction rate is now known within a 10% confidence interval. A summary of the astrophysical studies requiring an accurate evaluation of the 15N(p,)16O reaction rate follows.
2 The new underground experiment
The target and the –ray detection set–up are those used in previous measurements and have been already extensively described elsewhere (for instance see Limata et al. (2010)). The proton beam (30–150 A) reaches the water cooled target after passing a 5 mm diameter collimator and a 1 m long copper tube, which is cooled to liquid nitrogen temperatures and works as a cold trap in order to prevent impurities scattered by the beam from depositing on the target surface. The pressure in the target chamber is mbar and no carbon deposition on the target is observed after the irradiation. This is checked by performing scans of the profile of the 14N(p,)15O resonance at = 278 keV. The target chamber works as a Faraday cup and provides the integral of the charge deposited, hence the average beam intensity, with an overall uncertainty of 2% (a 300 V high voltage is applied to the cold trap to suppress the secondary electron emission).
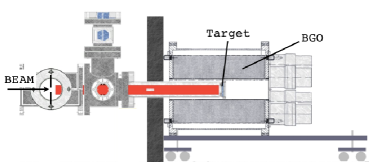
The target is surrounded by a 4–BGO summing crystal (28 cm long, 20 cm diameter, and 6 cm coaxial hole, Casella et al. (2002)). The 4–BGO is essential in order to increase the –detection efficiency, which is calculated with a simulation based on GEANT4 Agostinelli et al. (2003) and carefully checked with radioactive sources and with the –ray produced by the proton induced reaction 11B(p,)12C at the = 149 keV resonance. The simulation needs experimental inputs, such as the decay scheme and the angular distribution of the emitted –radiation. The decay branching ratios for transitions to the excited state of 16O have been measured by Rolfs and Rodney (1974), Bemmerer et al. (2009) and LeBlanc et al. (2010). The angular distribution has been found to be isotropic in a previous LUNA work LeBlanc et al. (2010). By considering all the contributions described above in the simulation code, the total uncertainty on the efficiency is 3%.
The TiN forming the target material, enriched in 15N, is deposited on a tantalum backing with the reactive sputtering technique Rigato et al. (2001). The target thickness is 100 nm, as verified through secondary neutral mass spectroscopy Vad et al. (2009) (the uncertainty on this measurement is included in the contribution to the target analysis in Table 2), corresponding to 15 keV energy loss at = 259 keV. The stoichiometry Ti/N, which ranges from 0.97 to 1.18 according to the target, is measured for each target with the high Z elastic recoil detection (ERD) technique Bergmaier et al. (1998). Isotopic abundances between 96% and 99%, according to the target, are deduced from the observed height of the plateau in the yield of the 14N(p,)15O resonance at = 259 keV, and from the ERD data. The results from these two methods agree within 2%. Finally, the target deterioration, caused by the impinging high–intensity proton beam has been studied by using the 430 keV resonance of 15N(p,)12C Marta et al. (2010). The targets have been analyzed by looking at the shape of the plateau in the yield distribution for the 430 keV resonance. The surface irradiated by the LUNA beam and the area outside the LUNA beam–spot are investigated, so that appropriate corrections for the target deterioration during measurements are derived.
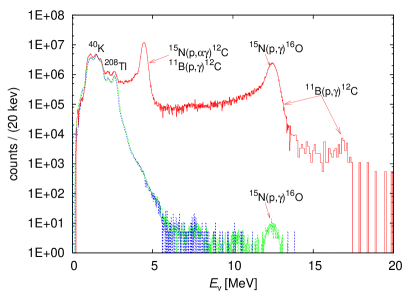
The laboratory background in the 15N(p,)16O region of interest is about 6 counts/day. The beam induced background in the same region, produced by the 11B(p,)12C reaction, is monitored by means of the peak produced by this reaction at 16.1 MeV (see Fig. 3 as an example of the acquired spectra). The counts in this peak are usually more than in the 11 MeV peak produced by the same reaction, which lies within the 15N(p,)16O region of interest of the spectrum Bemmerer et al. (2009). We have rejected all measurements where the 16 MeV peak contained more than 3% of the counts in our region of interest.
| keV] | [keV barn] | [keV barn] | [keV] | [keV barn] | [keV barn] |
|---|---|---|---|---|---|
| 72.8 | 52 | 4 | 236.9 | 153.0 | 1.1 |
| 81.3 | 49 | 2 | 246.3 | 172.0 | 1.7 |
| 89.3 | 53 | 6 | 256.4 | 201 | 3 |
| 105.1 | 59 | 4 | 266.3 | 227 | 3 |
| 114.8 | 53 | 3 | 274.5 | 254.7 | 1.4 |
| 123.5 | 56.4 | 1.8 | 283.5 | 283 | 3 |
| 132.7 | 64 | 2 | 293.7 | 315.4 | 1.6 |
| 143.7 | 68.3 | 1.0 | 302.6 | 320 | 2 |
| 151.3 | 55.9 | 1.1 | 311.7 | 309.1 | 1.2 |
| 162.3 | 79.2 | 0.5 | 321.1 | 277.6 | 1.0 |
| 170.7 | 79.8 | 0.9 | 330.4 | 227.4 | 0.7 |
| 180.1 | 87.2 | 1.0 | 340.2 | 183.0 | 0.9 |
| 189.1 | 93.5 | 1.1 | 349.1 | 134.0 | 0.9 |
| 198.4 | 102.6 | 0.8 | 354.1 | 124.0 | 1.2 |
| 207.9 | 114.0 | 1.6 | 358.8 | 101.0 | 1.0 |
| 217.3 | 123.0 | 1.0 | 363.6 | 95.1 | 0.9 |
| 227.4 | 136.0 | 1.1 | 368.3 | 81.0 | 0.8 |
The target profiles can be integrated with the cross section in order to calculate the expected yield as:
| (2) |
where is the energy in the laboratory system expressed in keV and it depends on the beam position along the target thickness, is the efficiency, and is the number of 15N nuclides in the position in the target. By comparing the experimental yield with the calculated one, it is possible to determine the S–factor as follows:
| (3) |
where the effective energy is calculated according to the following definition Lemut (2008):
| (4) |
In Eq. (4) the theoretical S–factor is used. Four different theoretical S–factors are considered in Eq. (2) and Eq. (4): the one reported in LeBlanc et al. (2010) and the one reported in Mukhamedzhanov et al. (2011), a constant S–factor and a value obtained from a recursive analysis process. In all cases, the same results are obtained within 1% discrepancies which is included in the error on the effective energy.
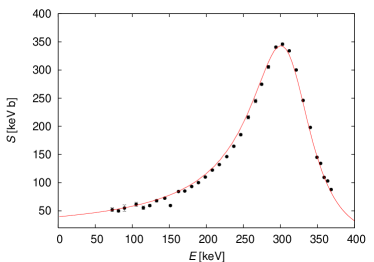
As reported in Table 1, the 15N(p,)16O astrophysical S–factor is obtained for the center of mass energy range 70–370 KeV. The statistical uncertainty is always limited within a few percent, reaching a maximum value of 10% at = 72.8 keV. All sources of systematic uncertainties are given in Table 2 and sum to a total systematic uncertainty of 10%.
| Source | Estimated |
|---|---|
| description | uncertainty |
| Target analysis | 7.5% |
| stopping power | 4.0% |
| 15N isotopic ratio | 2.0% |
| Ti/N stoichiometry | 2.0% |
| Beam intensity | 2.0% |
| Effective energy | 3.0% |
| –ray detection efficiency | 3.0 % |
| 11B(p,)12C background | 3.0% |
| Total systematic uncertainty | 10.0% |
A comparison of the derived astrophysical S–factor to the results of previous experiments is shown if Fig. 4.
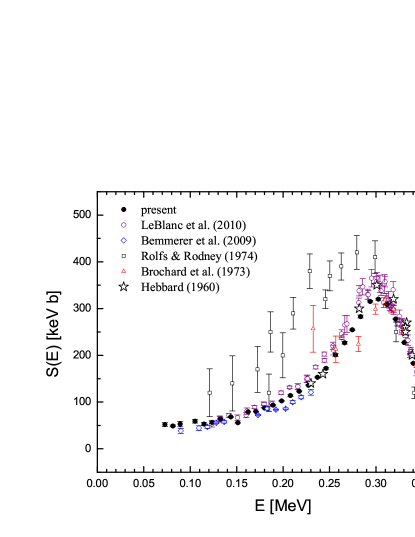
We confirm the previous finding concerning the need of a substantial reduction of the S(0) value. The present result is significantly lower than the resonant cross section from Rolfs and Rodney (1974), i.e. the data set adopted in NACRE and CF88, and, by considering the systematic uncertainty, in good agreement with our previous HPGe measurement LeBlanc et al. (2010). In particular, according to the present absolute analysis, the cross section on top of the keV resonance is b, where the quoted error includes the 10 % systematic uncertainty. In Table 3, we compare this result to the values of previous measurements. The weighted average of 3 measurements555The result obtained by Brochard et al. (1973) has been excluded, because no uncertainty was reported. leads to a recommended value of b. The shape of the R–Matrix fit has been also compared to the present data as shown in Fig. 5. Only for this comparison the present data have been corrected for the electron screening in the adiabatic approximation Assenbaum et al. (1987) (at most 10% at 70 keV) and they have been rescaled to the calculated average value. This rescaling is still between inside the systematic uncertainties of the present absolute data. They show an excellent agreement with the energy dependence of the LUNA R–Matrix fit LeBlanc et al. (2010).
| Present | LeBlanc | Rolfs and | Brochard | Hebbard |
| study | et al. | Rodney | et al. | |
| [b] | [b] | [b] | [b] | [b] |
| 6.3 |
Finally, a new R–matrix analysis has been recently published by Mukhamedzhanov, La Cognata and Kroha (2011). By varying the fitting method, these authors obtain values ranging between 33.1 and 40.1 keVb, which is in excellent agreement with the value reported by LeBlanc et al. ( keVb).
For practical purposes, the nuclear reaction rate can be approximated by the following fitting formula LeBlanc et al. (2011):
where the best fit parameters are reported in Table 4.
| a1 = 0.523 | a4 = 6.339 | a7 = 2.913 |
| a2 = 15.240 | a5 = 2.164 | a8 = 3.048 |
| a3 = 0.866 | a6 = 0.738 | a9 = 9.884 |
3 Summary and Conclusions
In this paper we have discussed the experimental efforts done to improve our knowledge of the 15N(p,)16O reaction rate in the temperature range experienced by any H–burning zone in stellar interiors. Such an important reaction is located at the branching point between the CN and NO cycles. The branching ratio, as a function of the temperature, is shown in Fig. 6, where the solid line has been obtained by means of the widely adopted reaction rate given by NACRE, while the dashed line represents the revised scenario as derived from the latest R–matrix study (see section 2).
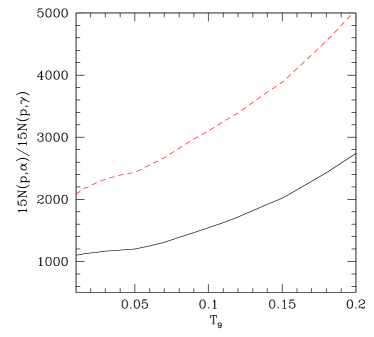
In both cases, the rate suggested by NACRE has been used for the competitive 15N(p,)12C reaction666This reaction has been recently studied with the THM method Cognata et al. (2009). The authors do not report a reaction rate but only the value. Scaling the previous NACRE results on that value the following considerations do not change so we still adopt the NACRE results in the present work. A look at the solid line shows that in the whole range of temperatures experienced by the core and the shell–H burning, the –channel is between 1000 to 2000 times more efficient than the channel: just 1 to 2 protons out of every 2000 are consumed by the NO cycle. When the updated rate for the 15N(p,)16O is adopted, such a ratio becomes about a factor of 2 larger. Although such a variation has negligible consequences on the overall nuclear energy production, a change in the rate of the 15N(p,)16O affects the equilibrium abundances of the stable oxygen isotopes within the H burning zone. As an example, the equilibrium abundance of 16O is reported as a function of the temperature in Fig. 7.
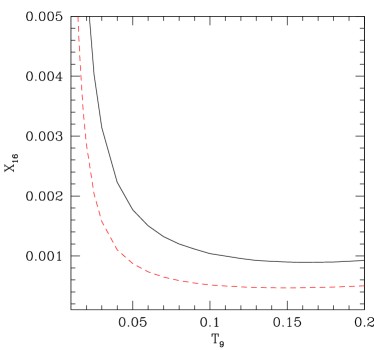
Also in this case, the solid and the dashed lines represent the values obtained by adopting the NACRE and the revised rate of the 15N(p,)16O reaction, respectively.
Let us point out that the most important improvement resulting from the present analysis of the CN–NO branching concerns the significant reduction of the nuclear physics uncertainties, other that the change of the reaction rate with respect to the values reported by CF88 or NACRE. For stellar models and nucleosynthesis calculations implying H–burning whose Gamow peak energy is larger than the minimum value attained by the LUNA BGO experiment, namely KeV, which corresponds to a temperature K, a true experimental error (smaller than 10%) is now available for this important reaction rate. Note that only in a very few cases the reaction rate has been measured down to the stellar Gamow peak energy (see, e.g., Bonetti et al. (1999)). In addition, basing on the good agreement found between the new LUNA measurements and the revised R–matrix fit (see previous section), we are confident that the quoted small uncertainty may be assumed also in the extrapolated region.
Among the many astrophysical applications of the present analysis, we recall the explosive H–burning in Novae, which occurs at temperature larger than K and, therefore, well above the achieved experimental limit. A recent study by Iliadis et al. (2002), investigates the dependence of the nova nucleosynthesis calculations on the various nuclear physics inputs. They found that a reduction of a factor of two of the 15N(p,)16O reaction rate would imply a 30% reduction of the final oxygen abundance. Also the inner region of the convective envelope of massive AGB stars attains quite high temperature, up to – Renzini & Voli (1981); M. Forestini & C. Charbonnel (1997); D’antona & Mazzitelli (1996); Straniero et al. (2000); Lattanzio et al. (2000). The resulting H burning, the so called hot bottom burning, coupled to the convective mixing, gives rise to a very promising nucleosynthesis scenario, where all the C, N and O isotopes are substantially affected. If the temperature is large enough ( K), the Ne–Na and the Mg–Al cycles are also activated. In this context, it has been recently claimed that massive AGB stars played a fundamental role during the early evolution of globular clusters Ventura et al. (2001). According to this self–enrichment scenario, in between 50 to 100 Myr after the cluster formation, the first generation of intermediate mass stars (5–7 M⊙) reached the AGB. Then, during this evolutionary phase, they underwent a substantial modification of the envelope composition, as a consequence of the HBB and several dredge up episodes. Due to the huge AGB mass loss, fresh gas enriched in He, C, N and Na, but O depleted, refilled the space occupied by the young Globular Cluster. If the star formation process was still active at that epoch, some of the stars we observed today should show the imprint of such a delayed chemical pollution by massive AGB. In particular, the O–Na anti–correlation, as observed in Giant, sub–Giant and turn–off stars of several globular clusters (e.g. Kraft et al., 1997; Carretta, E. et al., 2009, and reference therein), may be the consequence of this nucleosynthesis process. Such a conclusion follows from the evidence that the temperature required for the activation of the NO cycle is similar to that required for the activation of the Ne–Na cycle. Thus, when O is depleted at the bottom of the convective envelope, Na should be enhanced. For this reason, a precise determination of the 15N(p,)16O is one of the prerequisites to obtain a robust prediction of the O abundance and, in turn, to check the proposed self–pollution scenario for the observed O–Na anti–correlation.
The R–matrix studies also allow to extrapolate the precise experimental measurements of the 15N(p,)16O reaction rate down to the temperature range experienced by the H–burning taking place in main sequence, RGB and less–massive AGB stars. Also in these cases the uncertainty has been significantly reduced. Such an occurrence may be immediately translated in more robust astrophysical predictions.
Acknowledgments
We thank A. Bergmaier (Universität der Bundenswehr München) and Javier García Lopez (CNA, Centro Nacional de Aceleratores) of Seville for assistance with the isotopic abundance analysis. Financial support by INFN and in part by the European Union (TARI RII3–CT–2004– 506222, AIM 025646 and SPIRIT 227012), the Hungarian Scientific Research Fund (K68801), and DFG (BE 4100/2–1) is gratefully acknowledged.
References
- Agostinelli et al. (2003) Agostinelli, S., Allison, J., Amako, K., et al. 2003, Nuclear Instruments and Methods in Physics Research Section A: Accelerators, Spectrometers, Detectors and Associated Equipment, 506, 250
- Angulo et al. (1999) Angulo, C., Arnould, M., Rayet, M., et al. 1999, Nuclear Physics A, 656, 3
- Assenbaum et al. (1987) Assenbaum, H. J., Langanke, K., & Rolfs, C. 1987, Zeitschrift f r Physik A Hadrons and Nuclei, 327, 461, 10.1007/BF01289572
- Barker (2008) Barker, F. C. 2008, Physical Review C (Nuclear Physics), 78, 044612
- Bemmerer et al. (2009) Bemmerer, D., Caciolli, A., Bonetti, R., et al. 2009, Journal of Physics G: Nuclear and Particle Physics, 36, 045202 (10pp)
- Bemmerer et al. (2005) Bemmerer, D., Confortola, F., Lemut, A., et al. 2005, Eur. Phys. J. A, 24, 313
- Bergmaier et al. (1998) Bergmaier, A., Dollinger, G., & Frey, C. M. 1998, Nuclear Instruments and Methods in Physics Research Section B: Beam Interactions with Materials and Atoms, 136-138, 638 , ion Beam Analysis
- Bonetti et al. (1999) Bonetti, R., Broggini, C., Campajola, L., et al. 1999, Phys. Rev. Lett., 82, 5205
- Bordeanu et al. (2008) Bordeanu, C., Rolfs, C., Margineanu, R., Negoita, F., & Simion, C. 2008, Journal of Physics G: Nuclear and Particle Physics, 35, 014011 (6pp)
- Brochard et al. (1973) Brochard, F., Chevallier, P., Disdier, D., & Scheibling, F. 1973, Le Journal de Physique, 34, 363
- Broggini et al. (2010) Broggini, C., Bemmerer, D., Guglielmetti, A., & Menegazzo, R. 2010, Annual Review of Nuclear and Particle Science, 60, 53
- Caciolli et al. (2009) Caciolli, A., Agostino, L., Bemmerer, D., et al. 2009, Eur. Phys. J. A, 39, 179
- Carretta, E. et al. (2009) Carretta, E., Bragaglia, A., Gratton, R. G., et al. 2009, A&A, 505, 117
- Casella et al. (2002) Casella, C., Costantini, H., Lemut, A., et al. 2002, Nuclear Instruments and Methods in Physics Research Section A: Accelerators, Spectrometers, Detectors and Associated Equipment, 489, 160
- Caughlan & Fowler (1988) Caughlan, G. R. & Fowler, W. A. 1988, Atomic Data and Nuclear Data Tables, 40, 283
- Charbonnel & do Nascimento (1998) Charbonnel, C. & do Nascimento, J. D., J. 1998, A&A, 336, 915
- Cognata et al. (2009) Cognata, M. L., Goldberg, V. Z., Mukhamedzhanov, A. M., Spitaleri, C., & Tribble, R. E. 2009, Phys. Rev. C, 80, 012801
- Costantini et al. (2009) Costantini, H., Formicola, A., Imbriani, G., et al. 2009, Reports on Progress in Physics, 72, 086301
- D’antona & Mazzitelli (1996) D’antona, F. & Mazzitelli, I. 1996, The Astrophysical Journal, 470, 1093
- Denissenkov & VandenBerg (2003) Denissenkov, P. A. & VandenBerg, D. A. 2003, The Astrophysical Journal, 593, 509
- Hebbard (1960) Hebbard, D. 1960, Nuclear Physics, 15, 289
- Iben (1967) Iben, I., J. 1967, The Astrophysical Journal, 147, 624
- Iliadis et al. (2002) Iliadis, C., Champagne, A., Jose, J., Starrfield, S., & Tupper, P. 2002, The Astrophysical Journal Supplement Series, 142, 105
- Jose et al. (2007) Jose, J., Garcia-Berro, E., Hernanz, M., & Gil-Pons, P. 2007, The Astrophysical Journal Letters, 662, L103
- Jose & Hernanz (1998) Jose, J. & Hernanz, M. 1998, The Astrophysical Journal, 494, 680
- Kraft et al. (1993) Kraft, R. P., Sneden, C., Langer, G. E., & Shetrone, M. D. 1993, The Astronomical Journal, 106, 1490
- Kraft et al. (1997) Kraft, R. P., Sneden, C., Smith, G. H., et al. 1997, The Astronomical Journal, 113, 279
- Langer et al. (1886) Langer, G. E., Kraft, R. P., Carbon, D. F., Friel, E., & Oke, J. B. 1886, Publications of the Astronomical Society of the Pacific, 98, 473
- Lattanzio et al. (2000) Lattanzio, J., Forestini, M., & Charbonnel, C. 2000, Mem. Soc. Astron. Italiana, 71, 737
- LeBlanc et al. (2010) LeBlanc, P. J., Imbriani, G., Görres, J., et al. 2010, Phys. Rev. C, 82, 055804
- LeBlanc et al. (2011) LeBlanc, P. J., Imbriani, G., Görres, J., et al. 2011, Phys. Rev. C, 84, 019902
- Lemut (2008) Lemut. 2008, Eur. Phys. J. A, 36, 233
- Limata et al. (2010) Limata, B., Strieder, F., Formicola, A., et al. 2010, Phys. Rev. C, 82, 015801
- M. Forestini & C. Charbonnel (1997) M. Forestini & C. Charbonnel. 1997, Astron. Astrophys. Suppl. Ser., 123, 241
- Marta et al. (2010) Marta, M., Trompler, E., Bemmerer, D., et al. 2010, Phys. Rev. C, 81, 055807
- Mukhamedzhanov et al. (2008) Mukhamedzhanov, A. M., Bém, P., Burjan, V., et al. 2008, Physical Review C (Nuclear Physics), 78, 015804
- Mukhamedzhanov et al. (2011) Mukhamedzhanov, A. M., La Cognata, M., & Kroha, V. 2011, Phys. Rev. C, 83, 044604
- Palmerini et al. (2011) Palmerini, S., Cognata, M. L., Cristallo, S., & Busso, M. 2011, The Astrophysical Journal, 729, 3
- Renzini & Voli (1981) Renzini, A. & Voli, M. 1981, A&A, 94, 175
- Rigato et al. (2001) Rigato, V., Maggioni, G., Patelli, A., et al. 2001, Surface and Coating Technology, 142-144, 943
- Straniero et al. (2000) Straniero, O., Limongi, M., Chieffi, A., et al. 2000, Mem. Soc. Astron. Italiana, 71, 719
- Sweigart & Mengel (1979) Sweigart, A. V. & Mengel, J. G. 1979, The Astrophysical Journal, 229, 624
- Vad et al. (2009) Vad, K., Csik, A., & Langer, G. A. 2009, Spectroscopy Europe, 21, 13
- Ventura et al. (2001) Ventura, P., D Antona, F., Mazzitelli, I., & Gratton, R. 2001, The Astrophysical Journal Letters, 550, L65
- Wasserburg et al. (1995) Wasserburg, G. J., Boothroyd, A. I., & Sackmann, I.-J. 1995, The Astrophysical Journal Letters, 447, L37