“Negative” Backaction Noise in Interferometric Detection of a Microlever
Abstract
Interferometric detection of mirror displacements is intrinsically limited by laser shot noise. In practice, however, it is often limited by thermal noise. Here we report on an experiment performed at the liquid helium temperature to overcome the thermal noise limitation and investigate the effect of classical laser noise on a microlever that forms a Fabry-Perot cavity with an optical fiber. The spectral noise densities show a region of “negative” contribution of the backaction noise close to the resonance frequency. We interpret this noise reduction as a coherent coupling of the microlever to the laser intensity noise. This optomechanical effect could be used to improve the detection sensitivity as discussed in proposals going beyond the Standard Quantum Limit.
pacs:
07.60.Ly, 07.79.Lh, 42.50.WkCoupling mechanical resonators with light has become an exciting field of research since the discovery of the electromagnetic damping effect in a microwave cavity with a movable wall braginsky-70-jetp ; favero-09-npho . Extended to optical cavities with flexible mirrors, this effect has been shown to induce self-oscillations dorsel-83-prl or self-cooling arcizet-06-nat ; gigan-06-nat depending on the cavity detuning from the optical resonance. A similar cooling effect known as cold damping can be obtained with an active feedback technique mancini-98-prl ; cohadon-99-prl . Cavity cooling now appears as a promising route to cool down macroscopic oscillators into their quantum state by using a high-finesse cavity in the resolved sideband regime to extract phonons with photons schliesser-08-natp .
Interferometric optical cavities are also a focus of research on quantum limited measurements with applications in metrology for gravitational-wave detectors reitze-08-npho . An historically important limit, called the Standard Quantum Limit (SQL), results from the compromise between the reflected shot noise of photons and the uncorrelated backaction noise induced by radiation pressure on cavity mirrors braginsky-68-jetp . Different detection schemes have been proposed to overcome this limit, including correlation of noise quadratures in detuned cavities to produce an effective cancellation of the backaction noise caves-81-prd ; braginsky-99-pla ; buonanno-01-prd ; khalili-01-os ; arcizet-06-pra ; tsang-10-prl . Up to now, only proofs of principle have been achieved experimentally mowlowry-04-prl ; caniard-07-prl ; verlot-10-prl ; marino-10-prl because the quantum shot noise is masked by the mirror thermal noise at room temperature. To reach the ultimate quantum limit of an interferometric detection, it is therefore indispensable, first, to lower the temperature and, then, to apply a quantum limited detection scheme.
In this Letter, we report advances in this direction by cooling down an optical cavity at 4.2 K to suppress the thermal noise. We use a microlever for Atomic Force Microscopy (AFM) as a flexible mirror that forms a cavity with the extremity of an optical fiber rugar-89-apl . Despite the lower reflection coefficient as compared to the low-loss mirrors of quantum optics, microlevers experience similar optomechanical effects due to retarded photothermal forces induced by light absorption vogel-03-apl ; metzger-04-nat . In particular, self-cooling has been shown to reduce the effective temperature, although it does not improve the signal-to-noise ratio for force detection because the signal is damped in the same way as the thermal noise vitali-01-pra . Here, we demonstrate experimentally for the first time that a microlever, cooled at 4.2 K to suppress thermal noise, couples coherently to the classical intensity noise of the laser beam and gives a reduction of the measurement noise. This “negative” contribution of the backaction noise occurs just above or below the mechanical resonance frequency depending on cavity detuning. This noise reduction effect, demonstrated here in the classical regime on a simple system, represents one of the proposed schemes to beat the SQL when applied in the quantum regime of shot noise.
We perform the experiments in a cryogenic force microscope at 4.2 K under a low pressure of helium gas for thermalization. The microlever is a commercial silicon cantilever (230 m long, 40 m wide, 3 m thick) coated with 80 nm of gold on the interferometer side and 200 nm on the tip side. The spring constant N/m is determined from thermal noise spectra at 300 K when optomechanical effects are negligible hutter-93-rsi . The fundamental resonance frequency is 41555 Hz and the quality factor reaches 15000 at 4.2 K.
The light source is a nm laser diode stabilized in temperature and protected by a Faraday isolator. The laser is coupled to a single-mode optical fiber connected to a 50%-50% fiber coupler [Fig. 1(a)]. One of the output fibers is sent into the cryostat to measure the microlever motion by interferometry in the parallel cavity formed by the lever and the cleaved end of the fiber, coated with 15 nm of gold to increase the reflection coefficient (16 %). The remaining ports of the coupler are connected to two photodiodes (0.44 A/W) with low-noise current amplifiers, one recording the same intensity as the incident light () and one recording half of the reflected intensity ().
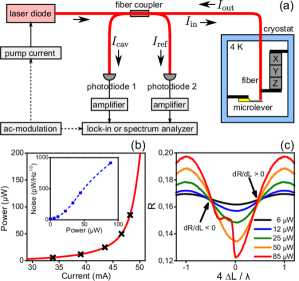
The fiber is approached at a few tens of microns from the lever, and the light beam is centered on the lever end by using inertial motors. The Z translation stage of the fiber is used to scan the cavity length and record the interference pattern of the reflection coefficient , as shown in Fig. 1(c) for five powers obtained by changing the pump current on the laser diode [Fig. 1(b)]. The higher contrast at a large power results from the increasing coherence length around the lasing threshold. The detection of the lever motion is done at the middle of the interference pattern where the slope is maximum, positive or negative. By fitting the interference patterns with the Fabry-Perot formula, one gets a cavity finesse ranging from 0.4 at 6 W to 1.2 at 85 W, suggesting that multiple reflections inside the cavity are limited. On the other hand, the spontaneous oscillations observed at a large power (85 W) on the negative slope (i.e., negative detuning), and visible as a kink on the bottom-left side of the interference pattern, show that the intracavity field is strongly sensitive to the cavity length, a situation that usually requires a good finesse favero-09-npho . In addition, the instability does not appear on the steepest part of the pattern but close to zero detuning. It seems therefore that the reflection coefficient measured through the small fiber core does not represent the actual finesse of the cavity, possibly due to the diverging light beam in the larger cavity formed by the fiber cladding.
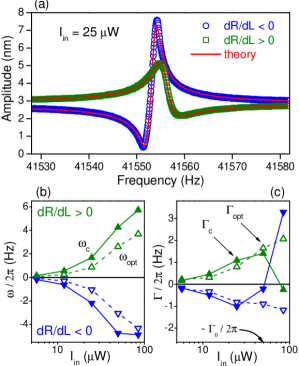
In order to gain physical insight into the origin of the optomechanical coupling, we first analyze the lever response to a small sinusoidal modulation of the laser pump current () resulting in a modulation of the incident light intensity. The modulation of the intensity reflected by the cavity is recorded as a function of the modulation frequency with a lock-in amplifier, for a given average power and for a positive or negative detuning. The response for an intermediate power of 25 W is plotted in Fig. 2(a) and shows an asymmetric Fano-like resonance because the flat response of the direct reflection is coupled to the resonant response of the lever kadri-11-oe . Since the phase of the lever vibration switches from 0 to across the resonance, the vibration signal is first added to and then subtracted from the direct reflection, giving successively a peak and a dip in the total response, for a positive slope. This relative position of the peak and dip indicates that the optical force pushes the lever like a radiation pressure. For a negative slope, the sign of the vibration signal is reversed, exchanging the peak and dip positions.
We model the optomechanical response around the resonance frequency as explained below. The light intensity fluctuations at angular frequency induce fluctuations in the optical force and result in fluctuations in the lever position according to metzger-08-prb :
The first part is the lever response involving the intrinsic spring constant , the resonant frequency and the damping rate . These parameters are modified with respect to the intrinsic values and by the quantities and related to the cavity-length-dependent optical force characterized by a spring constant and a force delay . The second part of the equation is the optical force at angular frequency expressed in terms of a dimensionless parameter giving the strength of the actual optomechanical force relative to the ideal radiation pressure induced by . Note that is usually larger than 1 due to light amplification in the cavity, but it can also represent a photothermal force instead of radiation pressure. is the retardation of the force, and the speed of light.
The reflected light intensity has fluctuations composed of reflected fluctuations for fixed cavity length and cavity length fluctuations described by the optomechanical response discussed above. These two contributions are added coherently and the reflected fluctuations can be expressed in terms of an effective reflection coefficient for intensity fluctuations characterized by a dimensionless function . For around the mechanical resonance, a large quality factor, and a small optical spring effect, this function reduces to the simple form :
where and can be expressed with the dimensionless coefficient describing the coupling strength.
The experimental response curves are perfectly fitted with as shown in Fig. 2(a). The fitting parameters are plotted for several powers and both cavity slopes in Figs. 2(b) and 2(c). The parameters and have the same sign and share the same evolution with incident power, suggesting a single optomechanical coupling for the response to the modulation and the optical spring effect. They are, respectively, proportional to the derivative (with respect to the cavity length) of the reflected and intracavity intensities, which have similar values here because of the low cavity finesse. The positive sign obtained for a positive cavity slope would be consistent with a coupling by radiation pressure, but the measured value of at 25 W together with for radiation pressure gives corresponding to a very large enhancement of the intracavity field which is not realistic for a low cavity finesse. As a result, the optomechanical force is likely of photothermal origin, as expected for a lever coated with asymmetric metallic layers.
At a low power, the signs of and are the same as for and on the same slope. Since theory predicts opposite signs for and parameters, the coupling probably involves two optical forces with opposite directions metzger-04-nat , one with a large delay giving a larger and one with a small delay giving a larger . This situation is possible in the case of two photothermal forces arising from the coexistence of two heat conduction paths with different time scales inside the lever, producing mechanical stresses in opposite directions. The same experiment performed at 300 K finds a much weaker optomechanical coupling, due possibly to a different thermomechanical response. Note that we cannot determine independently the sign and delay of the two photothermal forces by recording the imaginary part of the response on a large frequency range metzger-08-prb because the response is below the detection sensitivity out of resonance.
Remarkably, reverses sign at a large power, suggesting that several photothermal forces contribute with different dependencies on incident power, but the origin of all these forces is not clearly understood. On the other hand, keeps a constant sign and would eventually reach at an even larger power, leading to the self-oscillations observed for negative detuning. This difference between and power behaviors might result from the difference between the reflected and intracavity fields they are connected to, in particular around the lasing threshold where the coherence length suddenly increases.
Having explored the optomechanical coupling in the presence of an external modulation, we now turn to the analysis of the noise spectrum in the absence of excitation. The incident light intensity emitted by the laser diode has time fluctuations characterized by a flat power spectral density from zero to above 50 kHz. This white classical noise increases with power as shown in the inset in Fig. 1(b). The power spectral density of the reflected light is converted into lever displacement noise and plotted in Fig. 3 for three powers. All these spectra show an asymmetric shape and a local minimum, which have never been observed, to the best of our knowledge, in noise spectra of microlevers, since they are usually dominated by thermal noise. Here, the spectra contain the flat contribution due to the direct reflection of the incident noise (as for a rigid cavity) and the resonant contribution due to the backaction on the microlever induced by photothermal coupling braginsky-99-pla2 ; cerdonio-01-prd . These two noises dominate by a factor of 10 over the detection noise of the photodiode amplifier and over the thermal noise at 4 K. Since the backaction noise is correlated to the direct noise, the spectrum is an asymmetric resonance with a region of reduced noise as compared to the uncorrelated situation. Moreover, the presence of a dip in the spectrum shows that the backaction noise acts as a “negative” noise on top of the flat direct noise. The frequency range of the reduced noise is located on the left (right) side of the resonance for negative (positive) slope of the cavity in agreement with the intensity modulation experiment. The peak height difference between positive and negative slopes results from the retarded optical spring force in the cavity (damping rate change ) and is equivalent to the self-cooling and self-heating effects observed in the case of thermal noise metzger-04-nat .
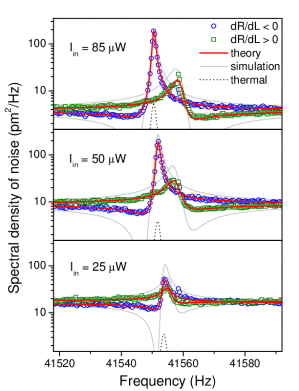
According to the model, the noise in the reflected intensity is given by . The experimental spectra are correctly fitted with this expression, though with different fitting parameters from those of the modulation experiment which give deeper minima (see Fig. 3). The fitting parameters and are almost the same in both experiments, but is about 3 times lower in the noise spectra and is also quite different. This difference could indicate that other sources of fluctuations might contribute to the spectra. The absence of excess noise on the slopes of the interference pattern shows, however, that the laser frequency noise is negligible. The photodiode detection noise also has a much lower level. The microlever thermal noise calculated at 4.2 K with the effective parameters and metzger-08-prb is also negligible and even not visible in Fig. 3 for the positive slope because of self-cooling. Alternatively, a possible explanation could be that the pump current modulation, used to create the intensity modulation in the first experiment, also produces an optical frequency modulation, which is then converted by the cavity into a modulation of the reflected intensity but uncoupled from the lever dynamics.
The key fact, however, is that the spectral density shows a minimum of noise lower than the direct intensity noise of the interferometric detection. Contrary to intuition, the backaction noise can therefore improve the signal-to-noise ratio of a weak force measurement in dynamic mode by choosing a frequency slightly off resonance. Since the spectral region of reduced noise is limited to a few hertz and near a region of enhanced noise, the bandwidth of the lock-in detection will be limited to these few hertz of reduced noise around the maximum of the signal-to-noise ratio given by . According to this formula, the lowest noise is obtained at angular frequency and could be lowered down to zero for if the quantum mechanical uncertainty principle would not set a lower bound on the measurement noise tsang-11-prl . Note that large values are obtained for the optimum delay given by .
Recently, a few quantum optics experiments mowlowry-04-prl ; caniard-07-prl ; verlot-10-prl ; marino-10-prl have discussed the possibility to beat the SQL by using an artificial noise above the thermal noise at 300 K and a coupling by radiation pressure. Our work now demonstrates that the backaction noise can be used to compensate coherently for the reflected intensity noise at a particular frequency with such a simple system as an AFM cantilever. This optomechanical effect will be useful to improve the sensitivity of lever-based force detection experiments. Demonstrated here on a microlever cooled at the liquid helium temperature and coupled to classical laser noise by photothermal forces, we expect this effect to show up similarly with radiation pressure and in the quantum limit of photon shot noise.
Acknowledgements.
This research was supported by the ANR PNANO 2006 program under the project name “MONACO”.References
- (1) V.B. Braginsky, A.B. Manukin, and M.Yu. Tikhonov, Sov. Phys. JETP 31, 829 (1970).
- (2) I. Favero and K. Karrai, Nat. Photon. 3, 201 (2009).
- (3) A. Dorsel, et al., Phys. Rev. Lett. 51, 1550 (1983).
- (4) O. Arcizet, et al., Nature 444, 71 (2006).
- (5) S. Gigan, et al., Nature 444, 67 (2006).
- (6) S. Mancini, D. Vitali, and P. Tombesi, Phys. Rev. Lett. 80, 688 (1998).
- (7) P. Cohadon, A. Heidmann, and M. Pinard, Phys. Rev. Lett. 83, 3174 (1999).
- (8) A. Schliesser, et al., Nat. Phys. 4, 415 (2008).
- (9) D. Reitze, Nat. Photon. 2, 582 (2008).
- (10) V.B. Braginsky, Sov. Phys. JETP 26, 831 (1968).
- (11) C.M. Caves, Phys. Rev. D 23, 1693 (1981).
- (12) V.B. Braginsky and F.Ya. Khalili, Phys. Lett. A 257, 241 (1999).
- (13) A. Buonanno and Y. Chen, Phys. Rev. D 64, 042006 (2001).
- (14) F.Ya. Khalili, Opt. Spectrosc. 91, 542 (2001).
- (15) O. Arcizet, et al., Phys. Rev. A 73, 033819 (2006).
- (16) M. Tsang and C.M. Caves, Phys. Rev. Lett. 105, 123601 (2010).
- (17) C.M. Mow-Lowry, et al., Phys. Rev. Lett. 92, 161102 (2004).
- (18) T. Caniard, et al., Phys. Rev. Lett. 99, 110801 (2007).
- (19) P. Verlot, et al., Phys. Rev. Lett. 104, 133602 (2010).
- (20) F. Marino, et al., Phys. Rev. Lett. 104, 073601 (2010).
- (21) D. Rugar, H.J. Mamin, and P. Guethner, Appl. Phys. Lett 55, 2588 (1989).
- (22) M. Vogel, et al., Appl. Phys. Lett. 83, 1337 (2003).
- (23) C. Metzger and K. Karrai, Nature 432, 1002 (2004).
- (24) D. Vitali, S. Mancini, and P. Tombesi, Phys. Rev. A 64, 051401(R) (2001).
- (25) J.L. Hutter and J. Bechhoefer, Rev. Sci. Instrum. 64, 1868 (1993).
- (26) S. Kadri, H. Fujiwara, and K. Sasaki, Opt. Express 19, 2317 (2011).
- (27) C. Metzger, et al., Phys. Rev. B 78, 035309 (2008).
- (28) V.B. Braginsky, M.L. Gorodetsky, and S.P. Vyatchanin, Phys. Lett. A 264, 1 (1999).
- (29) M. Cerdonio, et al., Phys. Rev. D 63, 082003 (2001).
- (30) M. Tsang, H.M. Wiseman, and C.M. Caves, Phys. Rev. Lett. 106, 090401 (2011).