Anisotropic magnetism, superconductivity, and the phase diagram of Rb1-xFe2-ySe2
Abstract
We report the crystal growth and structural, magnetic, conductivity, and specific heat investigations of Rb1-xFe2-ySe2 single crystals with varying stoichiometry prepared by self-flux and Bridgman methods. The system exhibits a strongly anisotropic antiferromagnetic behavior below 400 K. Bulk superconductivity is found in samples with Fe concentrations 1.53 1.6, whereas for 1.5 and 1.6 insulating and semiconducting behavior is observed, respectively. Within the measured range of variation of the Rb concentration (0.6–0.8) no correlation between the Rb content and the lattice parameters of the samples was found. The superconducting samples show the smallest value of the lattice parameter c compared to the non-superconducting samples. The sharpest transition to the superconducting state, the highest transition temperature of 32.4 K, and the highest diamagnetic response corresponding to a critical current density of A/cm2 (at 2 K) is found for compositions close to Rb2Fe4Se5. Upper critical fields of kOe for the in-plane and 630 kOe for the inter-plane configurations are estimated from resistivity studies in magnetic fields. In the non-superconducting samples with the Fe concentration below 1.45 both specific heat and susceptibility revealed an anomaly at 220 K which is not related to antiferromagnetic or structural transformations. Comparison with the magnetic behavior of non-superconducting samples provides evidence for the coexistence of superconductivity and static antiferromagnetic order.
pacs:
74.70.Xa 74.62.Bf 74.25.Ha 74.25.BtI Introduction
Iron-based superconductorsKWH08 ; RTJ08 ; TTL08 ; HLY08 are currently among the most intensively studied materials. Among different groups of these superconductors, the iron chalcogenides have recently attracted particular attention. The undoped iron selenide, FeSe, exhibts a relatively low critical temperature K at ambient pressure,HLY08 but it raises to 37 K under external pressure.MMT09 ; MTO09 Earlier attempts to increase of FeSe using chemical doping resulted in a K by substitution of Se with Te.FPQ08 ; YHH08 Recent reports of K in potassium intercalated FeSe JG10 further pushed the research activity in the iron chalcogenide family. Consequently, successful intercalation of other alkali metals (Rb and Cs) in FeSe was realized and superconducting (SC) samples with between 27 and 33 K were prepared.KM11 ; JJY10 ; CHL10 ; XGL11 ; YM11 ; AFW11 ; HW11 Further studies of SC chalcogenides with hypothetical stoichiometry A0.8Fe2Se2 (A = K, Rb, Cs, Tl) revealed significant differences in their SC properties compared to the related SC pnictides with a similar structural arrangement.
Intriguing coexistence of superconductivity and static antiferromagnetic order and a proximity to an insulating state were suggested.ZS11 ; LL11 ; RHL11 ; MHF11 ; WB11 In addition, angle-resolved photoemission spectroscopy (ARPES) studies DM11 ; LZ11 ; TQ11 showed a different topology of the Fermi surface in A0.8Fe2Se2 compared to other Fe-based superconductors suggesting a pairing mechanism distinct from s symmetry.IM11 Despite numerous reports, the data on A0.8Fe2Se2 materials with regard to their intrinsic properties is far from being conclusive. For example, the conducting and magnetic properties of the Rb-based samples reported by different authors vary significantly indicating a strong dependence on preparation conditions and impurity content.CHL10 ; XGL11 ; AFW11 ; HW11 ; RHL11 ; MHF11 Moreover, the correlation between the properties and stoichiometry of A0.8Fe2Se2 has been not fully established yet. Here we present the results of the structural, magnetic, conductivity, and thermodynamic characterization of the Rb-Fe-Se system performed on single crystals grown by two different methods: self-flux and Bridgman techniques. The selection of the Rb-based system is motivated by an ease to grow large single crystals with a higher volume fraction of the SC phase compared to K- and Cs-based Fe chalcogenides. The variations of the conducting and magnetic parameters with the stoichiometry determined by wave-length dispersive x-ray electron-probe microanalysis (WDS EPMA) are summarized in a phase diagram of the Rb-Fe-Se system.
II Results and discussion
II.1 Preparation and composition analysis
Polycrystalline FeSe synthesized from the high-purity elements (99.98 % Fe and 99.999 % Se) and 99.75 % Rb were used as starting material for the growth of single crystals. Handling of the reaction mixtures was done in an argon box with residual oxygen and water content less than 1 ppm. The preparation conditions are given in Table 1. In the growth runs with starting composition corresponding to nominal stoichiometry Rb0.8Fe2Se2 the solidified ingots showed significant inhomogeneity. Samples from the top of the ingots revealed superconducting properties whereas the bottom of the ingots contained poorly crystallized material with ferromagnetic behavior. A similar separation was observed for the growth runs with the starting stoichiometry Rb0.9Fe2Se2, although the samples from the top of the ingot were not superconducting. In the growth runs with the starting stoichiometry Rb0.8Fe1.6Se2, such a strong phase separation was not observed, but the samples were also non-superconducting.
| Sample | Preparation conditions | Concentration | Starting mixture | Lattice constant | ||||||
|---|---|---|---|---|---|---|---|---|---|---|
| Method | Soaking | Soaking | Cooling rate | Rb | Fe | Se | a, b | c | ||
| temperature | time | (1-x) | (2-y) | [Å] | [Å] | |||||
| F 266 | self-flux | 1030 o C | 3 h | 6 o C/h | 0.653(30) | 1.532(8) | 2.000(35) | Rb+2.5FeSe | 3.9285(3) | 14.6003(18) |
| F 274 | self-flux | 1030 o C | 3 h | 6 o C/h | 0.672(15) | 1.430(8) | 2.000(17) | Rb+2FeSe+0.5Se | 3.9270(9) | 14.6155(49) |
| F 286 | self-flux | 1030 o C | 3 h | 6 o C/h | 0.609(22) | 1.608(9) | 2.000(33) | Rb+2.5FeSe+0.5Se | 3.9180(11) | 14.6273(61) |
| F 295 | self-flux | 1030 o C | 3 h | 6 o C/h | 0.724(18) | 1.560(10) | 2.000(19) | Rb+2.5FeSe | 3.9310(7) | 14.5914(36) |
| BR 16-1 | Bridgman | 1070 o C | 3 h | 3 mm/h | 0.796(28) | 1.596(8) | 2.000(37) | Rb+2.5FeSe | 3.9228(7) | 14.5909(38) |
| BR 16-8 | 0.801(28) | 1.602(9) | 2.000(37) | 3.9304(6) | 14.6050(28) | |||||
| BR 16-10 | 0.759(42) | 1.601(9) | 2.000(47) | |||||||
| BR 17-1 | Bridgman | 1070 o C | 3 h | 3 mm/h | 0.737(26) | 1.439(8) | 2.000(38) | 0.9Rb+2FeSe | 3.9117(5) | 14.6516(36) |
| BR 17-4 | 0.733(24) | 1.439(9) | 2.000(38) | |||||||
| BR 17-5 | 0.733(24) | 1.432(15) | 2.000(23) | |||||||
| BR 17-10 | 0.786(17) | 1.459(10) | 2.000(15) | |||||||
| BR 18 | Bridgman | 1070 o C | 5 h | 3 mm/h | 0.659(32) | 1.537(9) | 2.000(36) | Rb+2.5FeSe | 3.9282(4) | 14.5899(23) |
| BR 19 | Bridgman | 1070 o C | 5 h | 3 mm/h | 0.698(17) | 1.497(11) | 2.000(25) | Rb+2FeSe+0.5Se | 3.9379(1) | 14.5983(7) |
| BR 22 | Bridgman | 1070 o C | 5 h | 3 mm/h | 0.644(31) | 1.620(12) | 2.000(35) | Rb+2.5FeSe+0.5Se | 3.9021(7) | 14.6484(58) |
| BR 26 | Bridgman | 1070 o C | 5 h | 3 mm/h | 0.740(36) | 1.600(6) | 2.000(25) | Rb+2.5FeSe | 3.9190(9) | 14.5515(57) |
| BR 28 | Bridgman | 1070 o C | 5 h | 3 mm/h | 0.685(21) | 1.588(9) | 2.000(40) | Rb+2.5FeSe | 3.9251(6) | 14.5932(36) |
The deviation from the nominal stoichiometry is a general problem for the intercalated iron chalcogenides. In most earlier reports, the composition of samples was determined by semi-quantitative EDX analysis or more precise ICP analysis. Both methods of compositional analysis revealed a different stoichiometry compared to the nominal Rb0.8Fe2Se2.CHL10 ; XGL11 ; AFW11 Various ranges of iron stoichiometry for the superconducting samples were reported, but the accuracy of these methods appears not to be sufficient to detect subtle changes in the composition. Therefore, the composition of the grown samples was determined by WDS EPMA that allows to reach an accuracy of 0.5 % for Fe and 1 % for Se. The concentration of the elements in the samples was measured using a Cameca SX50 analyzer on freshly cleaved samples minimally exposed to air ( min) to prevent oxidation. The EPMA data are also given in Table 1. They represent the values averaged over multiple (at least 10) measured spots with an area of m2. The concentrations of Rb and Fe elements are normalized assuming a Se concentration of 2 per formula unit. The EPMA analysis revealed notable deviations in the composition of the samples from the starting stoichiometry for all prepared batches. The concentration of Fe in the superconducting samples from different batches was found to vary between 1.53 and 1.60, while the variations of the Rb concentration were between 0.65 and 0.8. The Rb deficiency is probably caused by a strong interaction with quartz glass at high temperatures. The stoichiometry of the samples exhibiting the highest SC parameters (from batches BR 16 and BR 26 described below) was close to Rb0.8Fe1.6Se2 (or Rb2Fe4Se5 in other notation). The concentration of Fe in the samples prepared from exactly the same nominal mixture Rb2Fe4Se5 was, however, less than and the samples were not superconducting. Another group of non-superconducting samples was also found, with the Fe concentration being higher than . The variations of the Fe and Se concentrations on the individual samples were less than 1 and 2 %, respectively, indicating their high homogeneity. The maximal variations of the Rb concentrations were of about 5 % which may indicate an inhomogeneous distribution of Rb ions. However, we do not exclude that this can be also an artifact due to observed sensitivity of the counting rate to a slight misalignment of the sample due to remaining fragments of the removed layers on the surface after cleavage and strong sensitivity of Rb to oxidation.
II.2 X-ray diffraction and structure
Figures 1 and 2 demonstrate the room temperature x-ray powder diffraction patterns obtained on crushed single crystals using a STOE Stadi P diffractometer with Cu Kα radiation, Å for superconducting and non-superconducting samples, respectively. The lattice parameters of the samples were obtained from the Rietveld refinement using the FULLPROF SUITE RC93 assuming tetragonal symmetry I4/mmm. They are presented in Table 1. The refinement was done using the site occupations for constituent elements as determined by EPMA.
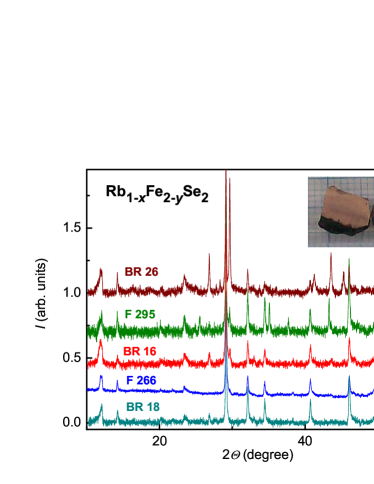
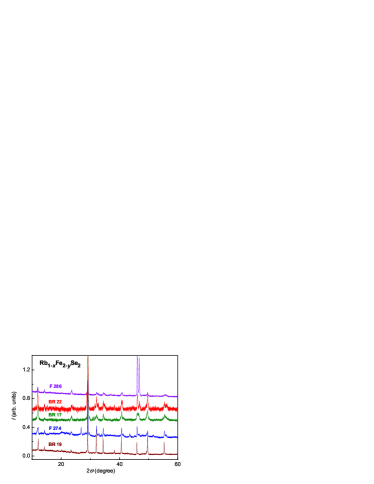
It is important to note that non-superconducting samples from the batch BR 19 with Fe concentration show the narrowest diffraction lines. X-ray spectra of the non-superconducting samples from other batches show additional features which are probably related to the difference in their vacancy structure. For example, samples with the Fe concentration below 1.45 exhibit much broader peaks indicating inhomogeneity and stress. Samples with the Fe concentration above 1.61 exhibit splitting of peaks which can be attributed to orthorhombic distortions. We also noticed that superconducting samples exhibit much broader x-ray diffraction peaks and additional reflexes beside the main peaks. In the superconducting samples from batches F 295, BR 16 and BR 26, the additional reflexes are of a considerable magnitude. Additional peaks, although of smaller magnitudes, were also observed in the single crystal x-ray diffraction spectra in a number of SC A0.8Fe1-xSe2 compounds but at lower angles compared to the main peaks.JJY10 ; XGL11 ; HW11 ; ZG11 These additional peaks were attributed either to inhomogeneous distribution of the alkali ions or to a modulated structure resulting from ordering of iron vacancies. The absence of such peaks in the non-superconducting samples probably exclude any significant inhomogeneous distribution of the Rb ions in our samples. Recent single crystal x-ray and neutron diffraction studies of a number of A0.8Fe2Se2 compounds identified their crystal structure within a tetragonal I4/m space group symmetry.WB11 ; PZA11 ; VYP11 ; FYE11 The x-ray patterns of our samples were also refined within the I4/m symmetry. For example, for the SC sample BR 16 the obtained value of the lattice constant a=8.7977 Å agrees well with of the supercell. We must note that x-ray pattern only of the non-superconducting sample BR 19 with the sharpest diffraction peaks is fully compatible with the I4/m space group symmetry. However, within the I4/m symmetry it was not possible to refine additional peaks observed for the superconducting samples BR 16 and BR 26, suggesting a second crystallographic phase coexisting with the main phase. The coexistence of different crystallographic phases, was earlier reported for non-superconducting K1-xFe2-ySe2.WBao11 However, the orthorhombic symmetry Pmna of the additional phase in Ref. WBao11, is incompatible with the symmetry of the second crystallographic phase observed in our SC samples. The phase separation in intercalated iron chalcogenides is now actively investigated. Recent transmission electron microscopy,ZWa11 x-ray diffraction,ARi11 ARPES,FCh11 optical spectroscopy,RHY11 and scanning tunneling microscopy studies WLi11 ; PCa11 provided evidence for the phase separation in K-intercalated iron superconductors. Very recently, inelastic neutron scattering,JTP11 optical spectroscopy,ACh11 and Mössbauer studies VKs11 of the superconducting Rb0.8Fe1.6Se2 samples (batch BR 16) confirmed the phase separation scenario also for the Rb-based superconductors. However, the relevance to phase separation of the second phase observed in the x-ray spectra of the superconducting samples is still an open question and additional studies are necessary to clarify its origin.
Since the quality of the refinement of the x-ray powder-diffraction data within the I4/m symmetry was lower compared to the I4/mmm symmetry due to reduced statistics and a larger number of refined parameters, we present the data of the refinement within the I4/mmm symmetry. The analysis of the obtained data shows only slight variations of the lattice parameter a with the Fe concentration in the range 1.53–1.6 and a decreasing tendency below 1.5 and above 1.6. An opposite trend is found for the variation of the c-parameter. The largest value of the lattice parameter a and the largest value of the unit cell volume are observed for the non-superconducting sample BR 19 with Fe concentration . With exception of this sample, the values of the c-parameter are lower for the superconducting samples, compared to the non-superconducting ones. Surprisingly, within the measured range of variation of the Rb concentration in the samples (0.6-0.8) no correlation between the Rb concentration and the value of the c-parameter was found, although one would intuitively expect an increase of the c-parameter with increasing Rb content. This probably can be attributed to a difference in the defect structure of the samples, which requires a more comprehensive study. To solve remaining issues concerning the defect structure, vacancy ordering, and the symmetry of the additional crystallographic phase, single crystal x-ray investigations are desirable.
Finally, we are also documenting the results of the microstructural study. We observed that samples with the Fe concentration in the range of 1.53–1.6 have very flat surfaces without visible defects or precipitates. They can be easily cleaved along the ab-plane reflecting the two-dimensional structure of the crystals. The samples with the Fe content below 1.45 are also rather easily cleaved; their surface contains a large number of dot-like defects. The microstructure of the samples with the Fe concentration above 1.6 is considerably different compared to that of the samples with a lower Fe content. They are mostly three-dimensional and therefore difficult to cleave along the ab-plane.
II.3 Magnetic susceptibility
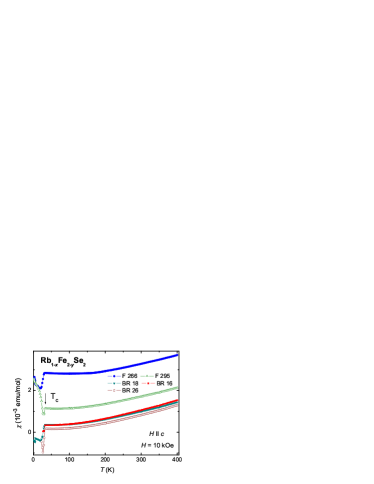
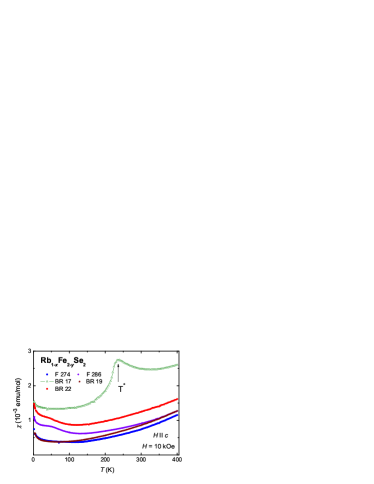
Figures 3 and 4, respectively, present the magnetic susceptibility versus temperature for superconducting and non-superconducting samples from different growth runs measured in a magnetic field H=10 kOe applied parallel to the c-axis. The measurements were performed on cooling using a SQUID magnetometer MPMS 5 (Quantum Design). On lowering temperature from 400 K to 33 K the susceptibility for all SC samples continuously decreases. The SC samples prepared by self-flux from the starting composition Rb0.8Fe2Se2 exhibit a higher susceptibility than those prepared by Bridgman method, which probably can be attributed to the presence of a small amount of non-reacted iron, e.g., of estimated from the magnetic moment for the sample F 266 measured at 40 K that exhibits saturation at low fields. In contrast, the magnetization of the SC samples grown by Bridgman method shows non-saturated behavior (see below) and the amount of the non-reacted iron in these samples appears to be significantly reduced. In the SC samples a clear downturn of at the transition temperature at around 30 K is evidenced, while for the non-superconducting samples shows a small upturn towards lower temperatures. It is important to note the very close values and essentially similar temperature dependence of the susceptibility at temperatures above 33 K both for the SC samples from batch BR 16 and non SC samples from batch BR 19 despite a clear difference in their chemical composition. The susceptibility of the exceptional sample BR 17 (with the strongly reduced Fe concentration below 1.46) shows a nonmonotonic temperature dependence with a broad maximum at around =233 K (for Hc), which is also evidenced in the specific heat (see below).
In Fig. 5, the temperature dependences of the magnetic susceptibility are shown for two selected SC and non SC samples (BR 16 and BR 19) measured in a magnetic field H=10 kOe applied parallel and perpendicular to the c-axis. The susceptibility for the perpendicular configuration (Hc) is by a factor of five higher than for Hc, and shows a weak temperature dependence unlike the significant decrease of on decreasing temperature. Such behavior of the and is characteristic for an anisotropic antiferromagnet, with the c-axis being the direction of alignment of the spins. A similar anisotropy of the magnetic properties has been recently reported for insulating TlFe1.6Se2 BCS11 with a Néel temperature of 430 K. The anisotropic antiferromagnetism appears to be a distinct feature of the whole family of the intercalated iron chalcogenides.
In order to determine the magnetic ordering temperature we measured the susceptibility of the sample BR 16 at temperatures up to 650 K using a heating option of the SQUID. The measurements (not shown) revealed a poorly pronounced maximum in the susceptibility at a temperature of 527() K. At the same time, a strongly irreversible behavior of on successive cooling and warming cycles was detected. Subsequent low-temperature measurements of the sample after the high-temperature cycling showed a strongly reduced amount of the SC phase indicating a partial degradation of the sample. Therefore it is unclear whether 527 K represents a true Néel temperature for this sample. Thus, to get an independent estimate of the Néel temperature we used an extrapolation of the data for the two measured configurations assuming that at they should merge. The data on and above 100 K were fitted by polynomials of second order. From the extrapolation of and a Néel temperature of about 620 () K was estimated for SC sample BR 16.

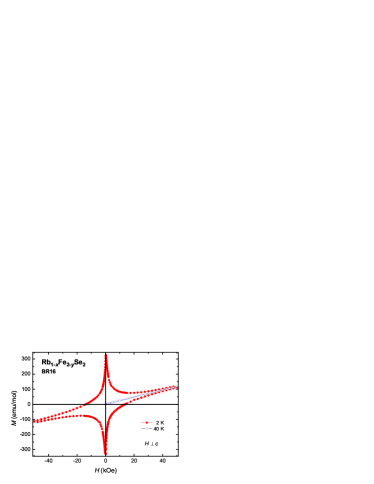
In Figs. 6 and 7, respectively, the magnetization curves M=f(H) for the superconducting sample BR 16 and non-superconducting sample BR 19, measured at different temperatures are presented. The data are shown for the magnetic field applied parallel and perpendicular to the c-axis. In the SC sample, M∥ shows a small non-linearity at low fields and a linear increase at high fields. M∥ increases significantly with temperature from 40 to 400 K. At the same time, M⊥ being considerably higher than M∥, shows a weak temperature dependence in the temperature range 40–400 K in sharp contrast to M∥. It is worth noting here that the magnetization of the non SC sample exhibits a field and temperature dependence for both field configurations very similar to that observed for the SC sample. Importantly, the magnetization of the non SC sample is not changing in the range from 40 to 2 K as demonstrated by the coinciding data for 2 and 40 K in Fig. 7. A close similarity of the magnetization behavior observed for both the SC and non SC samples suggests that the static magnetic order coexists with the superconducting state.
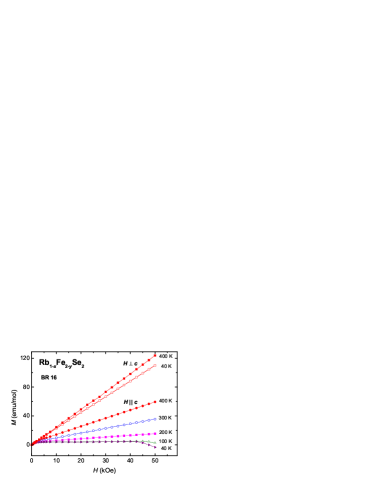
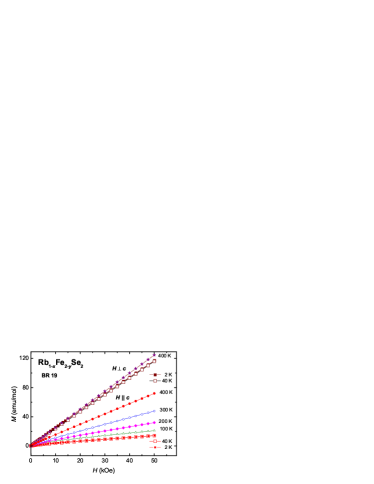
Figure 8 shows the temperature dependences of the zero-field cooled (ZFC) and field-cooled (FC) susceptibility for superconducting samples from different batches measured in a field H=10 Oe applied parallel to the c-axis. The sharpest transition ( = 1.5 K, estimated from FC data) and the highest temperature of the onset of superconductivity, = 32.4 K was found for the samples from batches F 295, BR 16, and BR 26. Although the EPMA data presented above indicate some notable variations in the Fe and Rb concentrations for the samples from these batches, no significant broadening of the SC transition or variation of was detected. At the same time, for the SC samples from the other batches (for example, F 266 and BR 18), the value of was by 2 K lower and the variation of indicates a broader transition compare to the samples from batches F 295, BR 16, and BR 26. The reduction of the transition temperature and broadening of the transition for these samples probably can be attributed to disorder effects caused, for example, by larger deviations of the Rb and, especially, of the Fe concentrations from the ”optimal” values of 0.8 and 1.6, respectively.
These ”optimal” values of Rb and Fe concentrations correspond to a formal oxidation state for the Fe ions of +2.0 as found in other superconducting Fe chalcogenides. Within the experimentally determined ratio of Rb to Fe concentration (see Table 1) we however did not found a change from the hole to electron doping with the variation of the stoichiometry. Indeed, for the samples with the lowest Fe concentration (below 1.5, e.g., BR17) the calculated valence of Fe is +2.27. For the samples with high Fe content (above 1.61, e.g., BR22) the valence of Fe is +2.07. Measurements of the thermoelectric power are necessary to clarify the role of doping on the properties of the Rb-based iron chalcogenides, as it was shown for the related K-intercalated compounds.KWa11 ; YJY11
It is important to note that the values of (Meissner effect) at 2 K for the SC samples are at least three order of value lower than the values of (shielding effect), probably due to strong pinning. At the same time, the values of at 2 K calculated from the data are far above unity pointing to the dominance of demagnetizing effects. The measurements of for the in-plane configuration (with H perpendicular to the c-axis) with the negligible demagnetizing factor for the samples from batches F 295, BR 16, and BR 26 gave a value of close to unity that may indicate a large volume fraction of the SC phase which yields a perfect 100 % shielding.
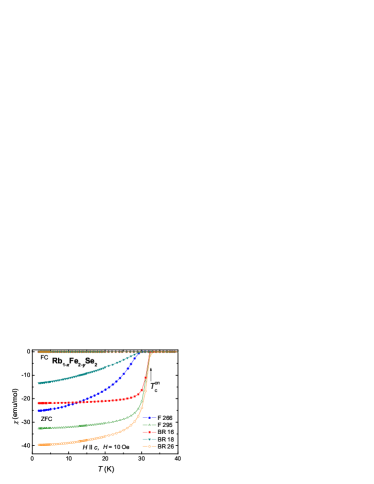
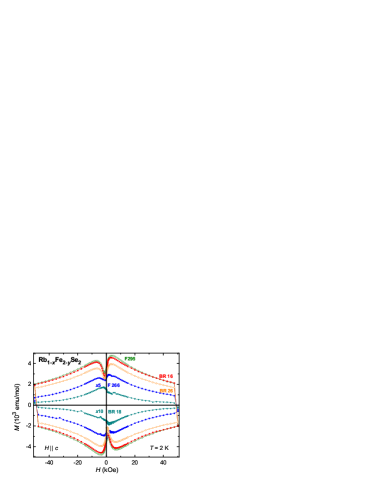
Figure 9 presents the magnetization hysteresis loops for SC samples measured at 2 K with the magnetic field H applied along the c-axis. The hysteresis loop for this configuration is symmetric with respect to the origin (0.0). The diamagnetic response for samples from different batches differs by a factor of 20. The reason of such a strong difference is unclear. It can be caused by variations of the stoichiometry detected by EPMA (see Table 1) or by changes in the preparation conditions, such as oxygen contamination. The phase separation can also be critical for obtaining high SC hysteresis width. Indeed, the highest diamagnetic response was found in the samples from batches F 295, BR 16 and BR 26 in which x-ray diffraction revealed strong reflexes of the additional crystallographic phase. Additional pinning centers created by this additional crystallographic phase can enhance the diamagnetic response.
The critical current density at 2 K estimated from the hysteresis data for the samples with the highest SC parameters using the Bean model for hard superconductors B62 ; B64 reaches a value of A/cm2. It is by a factor of five lower than the intrinsic value of reported for FeSe substituted with Te.VT10 ; AGu11
In Fig. 10 the hysteresis loop for the SC sample BR 16 measured at 2 K with the magnetic field applied perpendicular to the c-axis is plotted. The maximum values of magnetization for H c and H c correlate with the difference in the demagnetization factors for these two configurations. The hysteresis loop for the configuration H c reveals two contributions, one superconducting, and the other linear in magnetic field. For comparison, in Fig. 10 the magnetization curve M∥=f(H) for the same sample measured at 40 K, just above the SC transition, is shown. It agrees well with the linear contribution that can be derived from the data at 2 K. This again points out that the magnetic correlations associated with the static antiferromagnetic order coexist with the SC state.
II.4 Resistivity
Figures 11(a) and (b) demonstrate the temperature dependences of the resistivity for the SC and non SC samples, respectively. The resistivity measurements were done on rectangular samples by a four-point method in the temperature range 2–300 K using the resistivity measurement option of the Quantum Design physical properties measurement system (PPMS) in magnetic fields up to 90 kOe. Both, the in-plane resistivity, , with current j in the ab-plane, and the inter-plane resistivity, , with current j parallel to the c-axis were measured. The magnetic field was always perpendicular to the current direction, so only the transverse configuration was studied. The contacts were made with a conductive silver paint. The error in the absolute value of the measured resistivity was about 20 % due to finite dimensions of the potential contacts. The in-plane resistivity of the SC sample prepared by self-flux method (F 266) is by approximately one order of magnitude larger than that for samples grown by Bridgman method which can be attributed to higher impurity content of the self-flux samples. The inter-plane resistivity of a typical sample grown by Bridgman method with high SC parameters (BR 16) is by a factor of two higher than the in-plane resistivity. The resistivity curves of all superconducting samples show a broad hump at a temperature that for different samples varies in the range of 190–215 K with a semiconductor-like temperature dependence above and a metal-like dependence below . We note that the superconducting samples from batch BR 16 have the smallest value of the resistivity compared to other batches. It is also the smallest for the superconducting Rb1-xFe2-ySe2 crystals reported so far.CHL10 ; AFW11 Together with the larger resistivity ratio = 37 this may indicate a higher purity of these superconducting samples.
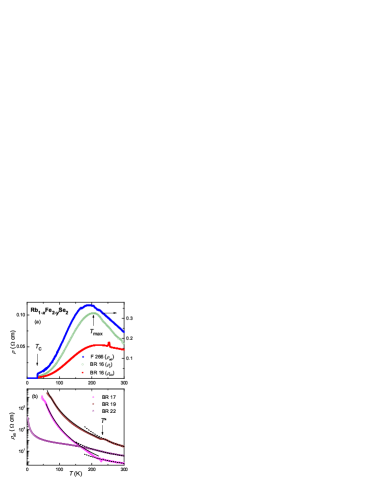
The resistivity of the non-superconducting samples is by several orders higher than that of the SC samples. It shows a steep increase on decreasing temperature and a small but clearly discernible anomaly at =233 K. In the range 300–240 K the temperature dependence of the resistivity for the non SC samples can be described by Arrhenius law with an activation energy of 0.16, 0.079 and 0.073 eV for the samples BR 19, BR 22, and BR 17, respectively. At temperatures below 240 K down to 80 K the resistivity of the non SC samples is not thermally activated but, instead, can be reasonably described within a Mott variable-range hopping (MVRH) model by an expression . The resistivity of the sample BR 22 with the Fe concentration above 1.62 is also showing semiconductor-like behavior with decreasing temperature, but its value is by several orders of magnitude lower than that of the samples with the Fe concentration below 1.5. Summarizing the observed resistivity behavior of the non-superconducting samples we notice rather low values of the activation energies which are more typical for heavily doped semiconductors or Mott insulators than for intrinsic band insulators. Additional studies including Hall effect are necessary to clarify the actual transport mechanisms in the non-superconducting Rb1-xFe2-ySe2 crystals.
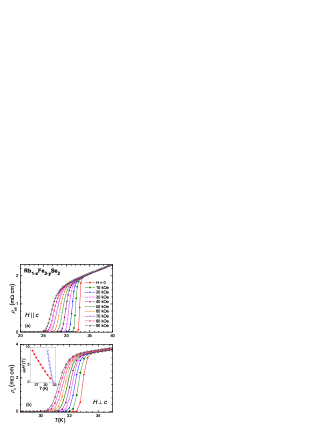
Figures 12(a) and (b), respectively, illustrate the effect of a transverse magnetic field on the in-plane and inter-plane resistivities in the transition region for the SC sample BR 16. The measurements were done on warming after cooling in zero field. In zero field the transition temperature, determined at the level of the 90 % drop of the normal state resistivity , coincides with the (within 0.1 K) determined from the susceptibility measurements. This again indicates the high quality of the superconducting samples. When increasing the magnetic field, the resistivity curves are displaced to lower temperatures. The inset in Fig. 12(b) shows the temperature dependence of the upper critical field estimated using the criterion of the 90 % drop of the normal state resistivity. On approaching , the slope of the curve becomes smaller compared to that at lower temperatures. The estimation of the upper critical field for K made within the Werthamer-Helfand-Hohenberg model WHH66 using the relation gave a value of 250 kOe for the in-plane and 630 kOe for the inter-plane configurations. They are by a factor of two lower than those for FeSe substituted with Te VT10 ; AGu11 and are the lowest reported so far for SC Rb1-xFe2-ySe2 samples.CHL10 ; AFW11
II.5 Specific heat
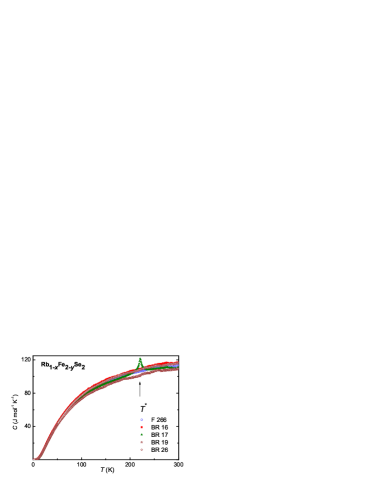
Figure 13 presents the temperature dependences of the specific heat C for selected superconducting and non-superconducting samples. The heat capacity was measured by a relaxation method using the PPMS in the temperature range 1.8–300 K and in magnetic fields up to 90 kOe. The magnetic field was applied parallel to the c-axis of the samples. The specific heat for different samples exhibits very similar behavior and values in the measured temperature range. The specific heat of the non SC sample BR 17 shows a sharp peak at around 220 K. Its position is lower than that of the peak in the susceptibility at 233 K for the same field configuration. Interestingly, the susceptibility of this sample for the field configuration perpendicular to the c-axis exhibits an anomaly exactly at the same temperature of 220 K as observed in the specific heat. The application of the magnetic field of 50 kOe does not have any influence on the temperature position of the peak in the specific heat at 220 K indicating that it is not related to conventional AFM or FM transitions. Temperature dependent x-ray measurements in the range 300–100 K did not find any evidence of a structural transformation either. Preliminary Mössbauer studies of the samples from this batch revealed new lines below typical for trivalent Fe ions.VK11 The observed anisotropy in the value of for Hc-axis and Hc-axis suggests a very peculiar type of this transition which needs further investigation.
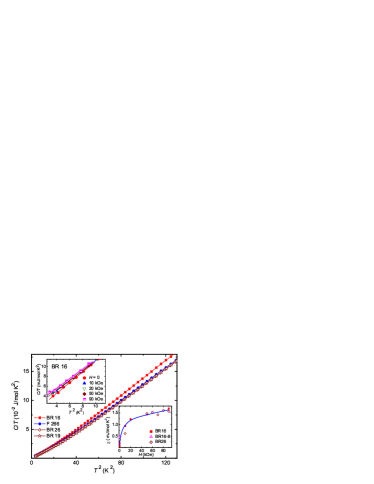
In Fig. 14 the temperature dependences of the specific heat is shown in the representation vs. for different samples at temperatures below 12 K. A linear dependence with two different slopes below and above 5 K is clearly discernible. The values of the residual Sommerfeld coefficient were determined from the fit to the experimental data at temperatures below 3 K using the expression , where the prefactor characterizes both the lattice and magnon contributions to the specific heat, which are proportional to , and therefore cannot be separated. The calculated values of these parameters are given in Table 2. We notice a rather low value of obtained for the superconducting samples, which indicates their high purity and minimal structural disorder or impurity content. The values of vary from 0.18 to 0.85 mJ/molK2 for the samples with high SC (BR 16) and poor SC parameters (F 266), respectively, reflecting higher impurity content and disorder of the poorly SC samples in agreement with the susceptibility results. Similar values of were reported for the related SC KFeSe2 compound.BZ11 At the same time, the non-superconducting samples BR 17 and BR 22 exhibit rather high values of , which probably can be attributed to structural disorder due to Fe and Rb vacancies. Importantly, the non-superconducting sample BR 19 exhibits an extremely low value of indicating minimal disorder, being correlated with its best crystallinity revealed by x-ray studies (see Fig. 2). It should be noted that the value of for the sample BR 19 is the closest to those of the superconducting samples. Together with very similar values of the susceptibility and its temperature dependence (see Fig. 5), this justifies the use of the specific heat data of the sample BR 19 as a reference for the lattice and magnon contributions. The respective contributions for the superconducting samples were calculated using the specific heat data of the sample BR 19 scaled by the square root of the ratio of their molar mass.
| Sample | / | |||||
| (K) | (K) | (mJ/mol K2) | (mJ/mol K4) | (mJ/mol K2) | ||
| F 266 | 30.9 | 2.8 | 0.85 | 0.96 | 10 | 1.0 |
| BR 16 | 32.4 | 1.5 | 0.18 | 1.09 | 12 | 0.95 |
| BR 16-8 | 32.4 | 1.6 | 0.46 | 1.04 | 12 | 0.96 |
| BR 17 | – | – | 0.33 | 0.90 | – | – |
| BR 19 | – | – | – | 0.95 | – | – |
| BR 22 | – | – | 3.0 | 1.36 | – | – |
| BR 26 | 32.4 | 1.5 | 0.34 | 0.94 | 7.4 | 2.2 |
Fig. 15 shows the electronic specific heat in the representation vs. for several superconducting samples from different batches obtained by subtraction of the lattice and magnon contributions from the total measured specific heat. It has been found that the superconducting contribution to the specific heat is rather small compared to that of the lattice and magnon contributions. However, a pronounced lambda-like anomaly of at the superconducting transition is clearly evidenced for all SC samples. The sample F 266 with poor SC parameters exhibits a broad anomaly of at , which is displaced to lower temperatures compared to the anomaly in samples from the batch BR 16 with high SC parameters. The samples from batch BR 26 show the sharpest anomaly of at .
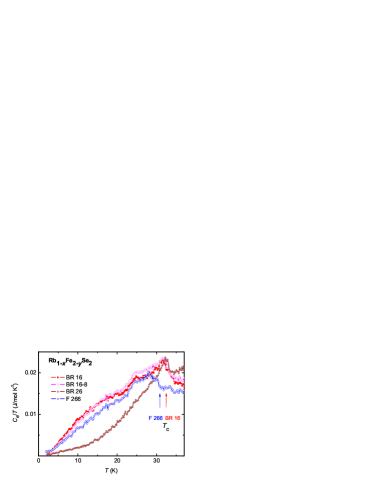
The value of the Sommerfeld coefficient in the normal state for the SC samples was estimated from the constraint of entropy conservation at the onset of , i.e., . The values of are given in Table II. They vary between 7.4 and 12 mJ/molK2 for SC samples from different batches and are comparable to those reported for SC KFeSe2.BZ11 Assuming that the residual Sommerfeld coefficient corresponds to the fraction of the normal conducting state, the obtained ratio of / implies that the volume fraction of the superconducting phase in our samples varies within 92-98 %. The values of the jump of the specific heat at were calculated by subtracting the value of from the maximum value of at . They vary from 10 to 16 mJ/molK2 for different SC samples and are by a factor of smaller than the respective values of observed for single crystalline FeSe0.5Te0.5.VT10 ; AS10 ; JHU11 The reduced specific heat jump at , / varies from 0.95 (for BR 16) to 2.25 (for BR 26). The values below 1.0 are probably related to errors in the estimation of for these samples. The obtained value of / = 2.25 for the sample BR 26 with the sharpest anomaly in the specific heat at is higher than the BCS estimate of 1.43 for the weak-coupling limit and may indicate strong-coupling superconductivity in Rb1-xFe2-ySe2 similar to that observed in Te substituted FeSeJHU11 and in optimally doped Ba1-xKxFe2As2.GMU09 ; PP10 ; ChK10
Since specific heat in the SC regime varies substantially among samples with rather close stoichiometry, we did not attempt to estimate the value of the superconducting gap. However, to get an insight into the symmetry of the order parameter we measured the low-temperature specific heat in different magnetic fields. The upper inset in Fig. 14, where the specific heat in the representation vs. is plotted for one of the samples with high SC parameters (BR 16), demonstrates the effect of the magnetic field on the specific heat at lowest temperatures. The application of the magnetic field results in an increase of the residual Sommerfeld coefficient probably related to the pair-breaking effect. The field dependences of for three samples with high SC parameters are shown in the lower inset in Fig. 14. The values of for these samples are very close and exhibit a similar field dependence that significantly differs from the linear dependence expected for fully gapped superconductors. It must be noted that the dependence of is close to characteristic for d-wave symmetry.GEV93 Recently, a Volovik-like term in the specific heat was reported for an optimally doped BaFe2(AsP pnictide which indicate the presence of nodes in the superconducting gap.YWa11 However, there is no experimental evidence of nodes in AFeSe2 yet. On the contrary, very recent ARPES studies of related AFeSe2 materialsDM11 ; LZ11 seem to fully rule out -wave pairing. At present, the sub-linear dependence of the observed in RbFeSe2 is lacking any reasonable theoretical explanation but multiband effect with two different gaps discussed in Ref. YWa11, can be also relevant in this case.
III Summary and Conclusions
Our detailed preparative, structural, magnetic, conductivity, and specific heat studies of Rb1-xFe2-ySe2 single crystals testify several important peculiarities of these materials:
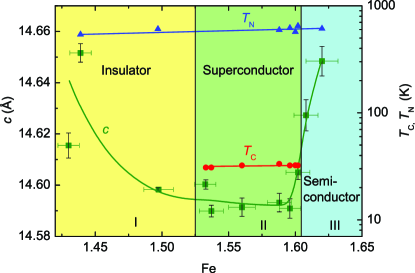
1. Three different regions with distinct structural, magnetic, and conducting behavior of the samples are documented in the Rb1-xFe2-ySe2 system as presented in the phase diagram in Fig. 16. Superconductivity is observed in the range of the Fe concentration above 1.53 and below 1.60 (region II of the diagram). Superconducting samples with the sharpest transitions, the highest critical temperature of 32.4 K and the largest diamagnetic response have the ”optimal” composition Rb0.8Fe1.6Se2. The reduction of the superconducting parameters of the samples can be attributed to deviations of the Fe concentration from the ”optimal” value of 1.6. Within the experimentally determined range of the Rb concentration (0.6–0.8) no correlation between the variation of the Rb content and the lattice parameters of the samples was found. The superconducting samples show the smallest value of the lattice parameter c compared to the non-superconducting samples. Samples with the Fe content below 1.5 (region I) and above 1.6 (region III) show an insulating, or semiconducting behavior at low temperatures, respectively.
2. In the whole range of the studied Fe concentrations the susceptibility measurements evidenced a behavior typical for an anisotropic antiferromagnet with a transition temperature above 500 K.
3. Magnetization measurements provide an evidence for the presence of antiferromagnetic correlations in the ordered superconducting state in samples with the Fe concentration in the range of 1.53–1.6. This suggests the coexistence of superconductivity and static antiferromagnetic order. In a view of recent experiments JTP11 ; ACh11 ; VKs11 this coexistence should be considered as being on the macroscopic level within a scenario of the phase separation.
4. Magnetic hysteresis measurements of the superconducting samples revealed high values of the critical current density of A/cm2 for superconducting samples with the composition close to Rb2Fe4Se5. The obtained value of is the largest reported thus far for AFeSe2 materials.
5. The upper critical fields of kOe for the in-plane, and 633 kOe for the inter-plane configurations are estimated from the resistivity study of the superconducting samples in magnetic fields. They are the lowest reported to date for the Rb1-xFe2-ySe2 superconductors.
6. Specific-heat measurements of the superconducting samples evidenced very low values of the residual Sommerfeld coefficient corresponding to 92–98% volume fraction of the superconducting phase, which confirm the bulk nature of the superconducting state.
7. Resistivity studies revealed an insulating behavior at low temperatures for samples with Fe concentrations below 1.5. The conductivity of these samples at low temperatures can be reasonably described by the variable-range hopping Mott mechanism. The conductivity of the samples with Fe concentrations above 1.6 is typical for heavily doped semiconductors.
8. In the non-superconducting samples with the Fe concentration below 1.45 an unusual phase transition below 233 K is revealed which is not related to antiferromagnetic or structural transformations.
9. The discrepancies in the range of Fe concentrations, where superconductivity shows up in Rb1-xFe2-ySe2 as compared to earlier reports, are likely to be related to the accuracy of the methods used for the compositional analysis.
Acknowledgements.
The authors thank Dana Vieweg for experimental support. This research has been supported by the DFG via SPP 1458 under Grant DE1762/1-1 and the Transregional Collaborative Research Center TRR 80 (Augsburg - Munich).References
- (1) Y. Kamihara, T. Watanabe, M. Hirano, H. Hosono, J. Am. Chem. Soc. 130, 3296 (2008).
- (2) M. Rotter, M. Tegel, D. Johrendt. Phys. Rev. Lett. 101, 107006 (2008).
- (3) J.H. Tapp, Z. Tang, B. Lv, K. Sasmal, B. Lorenz, C.W. Chu, A.M. Guloy, Phys. Rev. B 78, 060505 (2008).
- (4) F.-C. Hsu, J.Y. Luo, K.W. Yeh, T.K. Chen, T.W. Huang, P.M. Wu, Y.-C. Lee, Y.L. Huang, Y.-Y. Chu, D.C. Yan, M.-K. Wu, Proc. Natl. Acad. Sci. U.S.A. 105, 14262 (2008).
- (5) S. Medvedev, T.M. McQueen, I.A. Troyan, T. Palasyuk, M.I. Eremets, R.J. Cava, S. Naghavi, F. Casper, V. Ksenofontov, G. Wortmann, and C. Felser, Nature Materials 8, 630 (2009).
- (6) S. Margadonna, Y. Takabayashi, Y. Ohishi, Y. Mizuguchi, Y. Takano, T. Kagayama, T. Nakagawa, M. Takata, and K. Prassides, Phys. Rev. B 80, 064506 (2009).
- (7) M.H. Fang, H.M. Pham, B. Qian, T.J. Liu, E.K. Vehstedt, Y. Liu, L. Spinu, and Z.Q. Mao, Phys. Rev. B 78, 224503 (2008).
- (8) K.W. Yeh, T.-W. Huang, Y. Huang, T.-K. Chen, F.-C. Hsu, P.M. Wu, Y.-C. Lee, Y.-Y. Chu, C.-L. Chen, J.-Y. Luo, D.-C. Yan, and M.-K. Wu, Europhys. Lett. 84, 37002 (2008).
- (9) J. Guo, S. Jin, G. Wang, S. Wang, K. Zhu, T. Zhou, M. He, and X. Chen, Phys. Rev. B 82, 180520 (2010).
- (10) A. Krzton-Maziopa, Z. Shermadini, E. Pomjakushina, V. Pomjakushin, M. Bendele, A. Amato, R. Khasanov, H. Luetkens, and K. Conder, J. Phys. Condensed Matter 23, 052203 (2011).
- (11) J. J. Ying, X. F. Wang, X. G. Luo, A. F. Wang, M. Zhang, Y. J. Yan, Z. J. Xiang, R. H. Liu, P. Cheng, G. J. Ye, and X. H. Chen, Phys. Rev. B 83, 212502 (2011).
- (12) C.H. Li, B. Shen, F. Han, X. Zhu, and H.H. Wen, Phys. Rev. B 83, 184521 (2011).
- (13) X. G. Luo, X. F. Wang, J. J. Ying, Y. J. Yan, Z. Y. Li, M. Zhang, A. F. Wang, P. Cheng, Z. J. Xiang, G. J. Ye, R. H. Liu, X. H. Chen, New J. Phys. 13, 053011 (2011).
- (14) Y. Mizuguchi, H. Takeya, Y. Kawasaki, T. Ozaki, S. Tsuda, T. Yamaguchi, Y. Takano Appl. Phys. Lett. 98, 042511 (2011).
- (15) A. F. Wang, J. J. Ying, Y. J. Yan, R. H. Liu, X. G. Luo, Z. Y. Li, X. F. Wang, M. Zhang, G. J. Ye, P. Cheng, Z. J. Xiang, and X. H. Chen, Phys. Rev. B 83, 060512 (2011).
- (16) H.D. Wang, C.H. Dong, Z.J. Li, Q.H. Mao, S.S. Zhu, C.M. Feng, H. Q. Yuan, and M.H. Fang, Europhys. Lett. 93, 47004 (2011).
- (17) Z. Shermadini, A. Krzton-Maziopa, M. Bendele, R. Khasanov, H. Luetkens, K. Conder, E. Pomjakushina, S. Weyeneth, V. Pomjakushin, O. Bossen, and A. Amato, Phys. Rev. Lett. 106, 117602 (2011).
- (18) L. Li, Z. R. Yang, Z. T. Zhang, W. Tong, C. J. Zhang, S. Tan, Y. H. Zhang, arXiv: 1101.5327 (unpublished).
- (19) R. H. Liu, X. G. Luo, M. Zhang, A. F. Wang, J. J. Ying, X. F. Wang, Y. J. Yan, Z. J. Xiang, P. Cheng, G. J. Ye, Z. Y. Li and X. H. Chen, Europhys. Lett. 94, 27008 (2011).
- (20) M.H. Fang, H.D. Wang, C.H. Dong, Z.J. Li, C.M. Feng, J. Chen, and H. Q. Yuan, Europhys. Lett. 94, 27009 (2011).
- (21) W. Bao, Q. Huang, G. F. Chen, M. A. Green, D. M. Wang, J. B. He, X. Q. Wang, Y. Qiu, arXiv: 1102.0830 (unpublished).
- (22) D. Mou, S. Liu, X. Jia, J. He, Y. Peng, L. Zhao, L. Yu, G. Liu, S. He, X. Dong, J. Zhang, H. Wang, C. Dong, M. Fang, X. Wang, Q. Peng, Z. Wang, S. Zhang, F. Yang, Z. Xu, C. Chen, and X. J. Zhou, Phys. Rev. Lett. 106, 107001 (2011).
- (23) L. Zhao, D. Mou, S. Liu, X. Jia, J. He, Y. Peng, L. Yu, X. Liu, G. Liu, S. He, X. Dong, J. Zhang, J. B. He, D. M. Wang, G. F. Chen, J. G. Guo, X. L. Chen, X. Wang, Q. Peng, Z. Wang, S. Zhang, F. Yang, Z. Xu, C. Chen, and X. J. Zhou, Phys. Rev. B 83, 140508 (2011).
- (24) T. Qian, X.-P. Wang, W.-C. Jin, P. Zhang, P. Richard, G. Xu, X. Dai, Z. Fang, J.-G. Guo, X.-L. Chen, and H. Ding, Phys. Rev. Lett. 106, 187001 (2011).
- (25) I. Mazin, Physics 4, 26 (2011).
- (26) J. Rodriguez-Carvajal, Physica B 192, 55 (1993).
- (27) Z. Gao, Y. Qi, L. Wang, C. Yao, D. Wang, X. Zhang, Y. Ma, arXiv: 1103.2904 (unpublished).
- (28) P. Zavalij, Wei Bao, X. F. Wang, J. J. Ying, X. H. Chen, D. M. Wang, J. B. He, X. Q. Wang, G. F. Chen, P.-Y. Hsieh, Q. Huang, and M. A. Green, Phys. Rev. B 83, 132509 (2011).
- (29) V. Yu. Pomjakushin, D. V. Sheptyakov, E. V. Pomjakushina, A. Krzton-Maziopa, K. Conder , D. Chernyshov, V. Svitlyk, and Z. Shermadini, Phys. Rev. B 83, 144410 (2011).
- (30) F. Ye, S. Chi, Wei Bao, X. F. Wang, J. J. Ying, X. H. Chen, H. D. Wang, C. H. Dong, Minghu Fang, arXiv: 1102.2882 (unpublished).
- (31) W. Bao, G. N. Li, Q. Huang, G. F. Chen, J. B. He, M. A. Green, Y. Qiu, D. M. Wang, J. L. Luo, Phys. Rev. Lett. 107, 137003 (2011).
- (32) Z. Wang, Y. J. Song, H. L. Shi, Z. W. Wang, Z. Chen, H. F. Tian, G. F. Chen, J. G. Guo, H. X. Yang, and J. Q. Li, Phys. Rev. B 83, 140505 (2011).
- (33) A. Ricci, N. Poccia, G. Campi, B. Joseph, G. Arrighetti, L. Barba, M. Reynolds, M. Burghammer, H. Takeya, Y. Mizuguchi, Y. Takano, M. Colapietro, N. L. Saini, and A. Bianconi, Phys. Rev. B 84, 060511 (2011).
- (34) F. Chen,1 M. Xu, Q.Q. Ge, Y. Zhang, Z.R. Ye, L.X. Yang, J. Jiang, B.P. Xie, R.C. Che, M. Zhang, A.F. Wang, X.H. Chen, D.W. Shen, X.M. Xie, M.H. Jiang, J.P. Hu, and D.L. Feng, arXiv:1106.3026 (unpublished).
- (35) R.H. Yuan, T. Dong, Y.J. Song, G.F. Chen, J.P. Hu, J.Q. Li, and N.L. Wang, arXiv:1102.1381 (unpublished).
- (36) W. Li, H. Ding, P. Deng, K. Chang, C. Song, K. He, L. Wang, X. Ma, J.-P. Hu, X. Chen, Q.-K. Xue, arXiv:1108.0069 (unpublished).
- (37) P. Cai, C. Ye, W. Ruan, X. Zhou, A. Wang, M. Zhang, X. Chen, Y. Wang, arXiv:1108.2798 (unpublished).
- (38) J. T. Park, G. Friemel, Yuan Li, J.-H. Kim, V. Tsurkan, J. Deisenhofer, H.-A. Krug von Nidda, A. Loidl, A. Ivanov, B. Keimer, D. S. Inosov, arXiv:1107.1703 (unpublished).
- (39) A. Charnukha, J. Deisenhofer, D. Pr pper, M. Schmidt, Z. Wang, Y. Goncharov, A. N. Yaresko, V. Tsurkan, B. Keimer, A. Loidl, A. V. Boris, arXiv:1108.5698 (unpublished).
- (40) V. Ksenofontov, G. Wortmann, S. Medvedev, V. Tsurkan, J. Deisenhofer, A. Loidl, C. Felser, arXiv:1108.3006 (unpublished).
- (41) B. C. Sales, M. A. McGuire, A. F. May, H. Cao, B. C. Chakoumakos, and A. S. Sefat, Phys. Rev. B 83, 224510 (2011).
- (42) K. Wang, H. Lei, and C. Petrovic, Phys. Rev. B 83, 174503 (2011).
- (43) Y. J. Yan, M. Zhang, A. F. Wang, J. J. Ying, Z. Y. Li, W. Qin, X. G. Luo, J. Q. Li, J. Hu, X. H. Chen, arXiv:1104.4941 (unpublished).
- (44) C.P. Bean, Phys. Rev. Lett. 8, 250 (1962).
- (45) C.P. Bean, Rev. Mod. Phys. 36, 90 (1964).
- (46) A. Günther, J. Deisenhofer, Ch. Kant, H.-A. Krug von Nidda, V. Tsurkan, and A. Loidl, Supercond. Sci. Technol. 24, 045009 (2011).
- (47) V. Tsurkan, J. Deisenhofer, A. Günther, Ch. Kant, M. Klemm, H.-A. Krug von Nidda, F. Schrettle, and A. Loidl, Eur. Phys. J. B 79, 289 (2011).
- (48) N.R. Werthamer, E. Helfand, and P.C. Hohenberg, Phys. Rev. 147, 295 (1966).
- (49) V. Ksenofontov et al., to be published.
- (50) B. Zeng, B. Shen, G. F. Chen, J. B. He, D. M. Wang, C. H. Li, and H. H. Wen, Phys. Rev. B 83, 144511 (2011).
- (51) A. Serafin, A. I. Coldea, A. Y. Ganin, M. J. Rosseinsky, K. Prassides, D. Vignolles, and A. Carrington, Phys. Rev. B 82, 104514 (2010).
- (52) J. Hu, T. J. Liu, B. Qian, A. Rotaru, L. Spinu, and Z. Q. Mao, Phys. Rev. B 83, 134521 (2011).
- (53) G. Mu, H. Luo, Z. Wang, L. Shan, C. Ren, and H.-H. Wen, Phys. Rev. B 79, 174501 (2009).
- (54) P. Popovich, A. V. Boris, O. V. Dolgov, A. A. Golubov, D. L. Sun, C. T. Lin, R. K. Kremer, and B. Keimer, Phys. Rev. Lett. 105, 027003 (2010).
- (55) C. Kant, J. Deisenhofer, A. Günther, F. Schrettle, A. Loidl, M. Rotter, and D. Johrendt, Phys. Rev. B 81, 014529 (2010).
- (56) G. E Volovik, JETP Lett. 58, 469 (1993).
- (57) Y. Wang, J.S. Kim, G. R. Stewart, P.J. Hirschfeld, S. Graser, S. Kasahara, T. Terashima, Y. Matsuda, T. Shibauchi, I. Vekhter, arXiv:1109.0554 (unpublished).