Infrared two-colour diagrams for AGB stars using , , and NIR data
Abstract
Using a revised version of the catalog of AGB stars by Suh & Kwon (2009), we present various infrared two-colour diagrams (2CDs) for 3003 O-rich, 1168 C-rich, 362 S-type and 35 silicate carbon stars in our Galaxy. For each object in the new catalog, we cross-identify the , and counterparts by finding the nearest one from the position information in the PSC. For the large sample of AGB stars, we present infrared two-colour diagrams using (PSC), (PSC and BSC), (PSC) and near infrared ( and bands; including data at band) data for different classes of AGB stars based on the chemistry of the dust shell and/or the central star. The infrared 2CDs of AGB stars can provide useful information about the structure and evolution of the dust envelopes as well as the central stars. On the 2CDs, we plot tracks of the theoretical radiative transfer model results with increasing dust shell optical depths. Comparing the observations with the theoretical models on the new 2CDs, we find that the basic model tracks roughly coincide with the densely populated observed points. Generally, we can explain the observations of O-rich and C-rich AGB stars on the various 2CDs with the theoretical models using dust opacity functions of amorphous silicate, amorphous carbon, SiC and corundum. For O-rich AGB stars, we find that the models using corundum as well as silicate can improve the fit with the observations.
keywords:
stars: AGB and post-AGB - circumstellar matter - infrared: stars - dust, extinction - radiative transfer.1 Introduction
Asymptotic Giant Branch (AGB) stars are generally classified to be oxygen-rich (M-type) or carbon-rich (C-type) based on the chemistry of the photosphere and/or the outer envelope (e.g., Busso, Gallino & Wasserburg 1999; Herwig 2005). Chan & Kwok (1990) argued that a M-type star may become a carbon star when the star goes through C dredge-up processes and thus the abundance of C is larger than that of O. S stars are generally regarded as intermediate between M-type and carbon stars in their properties (e.g., Lloyd Evans & Little-Marenin 1999). Only the S stars with Tc (also called intrinsic S stars) are believed to be actually in the AGB phase following the evolution sequence M-S-C (Iben & Renzini 1983; Jorissen & Mayor 1988, 1992). However, Chan & Kwok (1990) and Guandalini & Busso (2008) pointed out that the M-S-C evolutionary sequence is not a certain thing for all the AGB stars.
The two-colour diagram (2CD) of stellar sources in the () Point Source Catalog (PSC) has been useful in characterizing the circumstellar environment of AGB stars. van der Veen & Habbing (1988) divided the 2CD into eight areas in such a way that each area contains a more or less homogeneous group. The 2CD statistically distinguishes between C-rich and O-rich AGB stars. For many studies since the mission, the 2CD has been the starting point for colour selection of samples; not only to select AGB or red giant branch (RGB) stars, but also to select post-AGB stars, young stellar objects and starburst galaxies.
The PSC (version 2.1) contains useful photometric data at four bands (12, 25, 50 and 100 m) for 245,889 sources. photometric data at four bands as well as near infrared (NIR) photometric data at and bands have been used to make various infrared 2CDs for AGB stars (e.g., Suh & Kwon 2009). The Low Resolution Spectrograph (LRS; = 822 m) data are useful to identify important features of O-rich and C-rich dust grains in AGB stars (e.g., Kwok, Volk & Bidelman 1997).
Because the has a low angular resolution (0.754.5-4.6 pixel size), the survey regions may suffer from confusion problems. Next infrared surveys using the (), the (), the and the () have concentrated on the Galactic plane and bulge with much better angular resolution.
The (Egan et al. 2003) surveyed the Galactic plane as well as the regions not observed by the mission with higher sensitivity and higher spatial resolution (18.3) in four mid-infrared broad bands centered at 8.28, 12.13, 14.65 and 21.34 m wavelength bands for 441,879 sources.
The (Murakami et al. 2007) made an all-sky survey with the infrared camera (IRC) and far infrared surveyor (FIS). We may use the PSC data at two bands (9 and 18 m) obtained by the IRC and the bright source catalogue (BSC) data at four bands (65, 90, 140 and 160 m ) obtained by the FIS for making meaningful 2CDs.
The two micron all sky survey (; Cutri et al. 2003) used two highly-automated 1.3-m telescopes equipped with a three-channel camera capable of observing the sky simultaneously at (1.25 m), (1.65 m) and (2.17 m) bands. The PSC contains accurate positions and fluxes for about 470 million stars and other unresolved objects.
Nearly all AGB stars can be identified as Long-Period Variables (LPVs). The general catalog of variable stars (GCVS; Samus et al. 2011) contains the list of LPVs for different variable types. LPVs in AGB phase are classified according to the amplitude and regularity of the period in Miras, semi-regulars and irregular variables. For many pulsating AGB stars, it has been known that the shapes of the spectral energy distributions (SEDs) vary as well as the overall luminosity depending on the phase of pulsation. The shapes of SEDs are affected by the properties of the dust shells as well as the central stars, depending on the phase of pulsation (e.g., Suh 2004).
The AGB phase of the LPV is characterized by dusty stellar winds with high mass-loss rates () (e.g., Salpeter 1974; Wachter et al. 2002). Dust envelopes around AGB stars are believed to be a main source of interstellar dust. The outflowing envelopes around AGB stars are very suitable places for massive dust formation (e.g., Kozasa, Hasegawa & Seki 1984). The infrared 2CDs of AGB stars can provide useful information about the structure and evolution of the dust envelopes as well as the central stars. Comparing the observations with theoretical models, we may find ways to improve our understanding about the dust envelopes around AGB stars.
In this paper, we present various infrared 2CDs for O-rich, C-rich, S-type AGB stars using a revised version of the catalog of AGB stars by Suh & Kwon (2009). For each object in the new catalog, we cross-identify the , and counterparts by finding the nearest source from the position information in the PSC. For the large sample of AGB stars, we present various infrared 2CDs using (PSC), (PSC and BSC), (PSC) and NIR ( and bands; including data at band) data. In this paper, we are concerned about 2CDs for different classes of AGB stars based on the chemistry of the dust shell and/or the central star. On the 2CDs, we plot tracks of the theoretical radiative transfer model results with increasing dust shell optical depths. Comparing the observations with the theoretical tracks, we discuss the meaning of the infrared 2CDs.
2 Sample stars
For the sample of AGB stars, we use a revised version of the catalog by Suh & Kwon (2009). They presented a catalog of AGB stars in our Galaxy from the sources listed in the PSC compiling the lists of previous works with verifying processes; their catalog was made of 2193 O-rich stars, 1167 C-rich stars, 287 S stars and 36 silicate carbon stars. In this paper, we add SiO maser sources to the list of O-rich AGB stars and more sources for C-rich stars and S stars from new references and make some corrections to the previous catalog. For a general description of the identifying and verifying processes, refer to Suh & Kwon (2009).
2.1 O-rich stars
O-rich AGB stars typically show the conspicuous 10 m and 18 m features in emission or absorption. They suggest the presence of silicate dust grains in the outer envelopes around them (e.g., Suh 1999). Low mass-loss rate O-rich AGB (LMOA) stars with thin dust envelopes show the 10 m and 18 m emission features. High mass-loss rate O-rich AGB (HMOA) stars with thick dust envelopes show the absorbing features at the same wavelengths.
OH maser observations identified many OH/IR stars. Suh & Kwon (2009) listed 1533 sources from 14 papers as O-rich AGB stars. However, methanol maser sources at 6.7 GHz are only associated with massive star formation (Minier et al. 2003). More than 550 methanol maser sources have been detected (Pestalozzi, Minier & Booth 2005). Using the catalog by Pestalozzi et al. (2005), we have excluded 18 methanol maser sources from the OH maser list in Suh & Kwon (2009).
Many of the SiO maser sources are O-rich AGB stars. The catalog of Suh & Kwon (2009) did not consider the SiO maser sources. By compiling the sources listed in 17 related papers, we have added 815 SiO maser sources which are identified to be O-rich AGB stars (see Table 1).
655 sources detected by other methods including photometric and spectrometric methods (molecular emission or spectral types) are compiled from 10 related papers. See Suh & Kwon (2009) for a detailed description.
Table 1 shows the revised list of O-rich AGB stars which contains 3003 sources. Compared to Suh & Kwon (2009), the number has been increased by 810. For each object, we have cross-identified the and sources as we describe in Section 3.
| Detecting Methods | References | Original | Excluded | Selected | Duplicate | Remaining |
| OH maser | Eder, Lewis & Terzian (1988) | 182 | 7 | 175 | 0 | 175 |
| Lewis, Eder & Terzian (1990) | 86 | 1 | 85 | 0 | 85 | |
| Chengalur et al. (1993) | 132 | 7 | 125 | 3 | 122 | |
| Lewis (1994) | 56 | 5 | 51 | 17 | 34 | |
| Sivagnanam et al. (1990) | 36 | 0 | 36 | 6 | 30 | |
| Le Squeren et al. (1992) | 115 | 7 | 108 | 36 | 72 | |
| David et al. (1993) | 141 | 2 | 139 | 25 | 114 | |
| Sevenster et al. (1997a) | 307 | 108 | 199 | 31 | 168 | |
| Sevenster et al. (1997b) | 202 | 53 | 149 | 2 | 147 | |
| Sevenster et al. (2001) | 286 | 81 | 205 | 67 | 138 | |
| te Lintel Hekkert et al. (1989) | 442 | 186 | 256 | 169 | 87 | |
| Nyman, Hall & Le Bertre (1993) | 44 | 5 | 39 | 37 | 2 | |
| Lepine et al. (1995) | 405 | 41 | 364 | 223 | 141 | |
| Chen et al. (2001) | 1065 | 110 | 955 | 737 | 218 | |
| SiO maser | Engels & Heske (1989) | 180 | 23 | 157 | 67 | 90 |
| Hall et al. (1990a) | 31 | 0 | 31 | 10 | 21 | |
| Hall et al. (1990b) | 29 | 0 | 29 | 15 | 14 | |
| Jewell et al. (1991) | 47 | 5 | 42 | 42 | 0 | |
| Nyman et al. (1993) | 21 | 3 | 18 | 17 | 1 | |
| Izumiura et al. (1994) | 50 | 0 | 50 | 7 | 43 | |
| Izumiura et al. (1995a) | 61 | 1 | 60 | 3 | 57 | |
| Izumiura et al. (1995b) | 77 | 0 | 77 | 20 | 57 | |
| Jiang et al. (1996) | 52 | 1 | 51 | 10 | 41 | |
| Izumiura et al. (1999) | 63 | 1 | 62 | 10 | 52 | |
| Deguchi et al. (2000a) | 86 | 0 | 86 | 7 | 79 | |
| Deguchi et al. (2000b) | 122 | 0 | 122 | 18 | 104 | |
| Ita et al. (2001) | 26 | 0 | 26 | 10 | 16 | |
| Nakashima & Deguchi (2003a) | 134 | 0 | 134 | 87 | 47 | |
| Nakashima & Deguchi (2003b) | 43 | 0 | 43 | 37 | 6 | |
| Deguchi et al. (2004) | 254 | 0 | 254 | 73 | 181 | |
| Deguchi et al. (2007) | 119 | 103 | 16 | 10 | 6 | |
| Others | Rowan-Robinson et al. (1986) | 95 | 5 | 90 | 54 | 36 |
| Epchtein et al. (1990) | 29 | 6 | 23 | 11 | 12 | |
| Blommaert, van der Veen & Habing (1993) | 15 | 1 | 14 | 11 | 3 | |
| Kastner et al. (1993) | 19 | 1 | 18 | 9 | 9 | |
| Loup et al. (1993) | 184 | 12 | 172 | 127 | 45 | |
| Whitelock et al. (1994) | 58 | 0 | 58 | 30 | 28 | |
| Guglielmo et al. (1997) | 16 | 0 | 16 | 3 | 13 | |
| Guglielmo et al. (1998) | 23 | 2 | 21 | 3 | 18 | |
| Le Bertre et al. (2003) | 563 | 31 | 532 | 58 | 474 | |
| Jimenez-Esteban et al. (2006) | 59 | 0 | 59 | 42 | 17 | |
| Total number | 5908 | 803 | 5105 | 2102 | 3003 | |
| -PSC | 2356 | |||||
| -BSC | 1548 | |||||
| -PSC | 1966 |
2.2 C-rich stars
The main components of dust in the envelopes around carbon stars are believed to be featureless amorphous carbon (AMC) grains and SiC grains which produce the 11.3 m emission feature (e.g., Suh 2000). The carbon stars showing the 11.3 m emission feature belong to LRS class C.
For C-rich AGB stars, we use the same catalog of Suh & Kwon (2009) except that one reference (Loup et al. 1993) is added and six objects are excluded in this work. Because used a large aperture, the flux from an PSC source may contain blended fluxes from multiple objects. Two objects ( 19075+0921 and 22306+5918) which show blended fluxes and four planetary nebulae (Kohoutek 2001; 04395+3601, 05251-1244, 21282+5050 and 21306+4422) are excluded.
Table 2 lists the 1168 C-rich AGB stars as identified by various authors and verified in this paper and Suh & Kwon (2009). For each object, we have cross-identified the and counterparts (see Section 3).
| References | Original | Excluded | Selected | Duplicate | Remaining |
| Rowan-Robinson et al. (1986)a | 40 | 0 | 41a | 0 | 41 |
| Chan & Kwok (1990) | 145 | 0 | 145 | 22 | 123 |
| Epchtein et al. (1990) | 216 | 7 | 209 | 60 | 149 |
| Egan & Leung (1991) | 125 | 1 | 124 | 78 | 46 |
| Volk, Kwok & Langill (1992) | 32 | 0 | 32 | 9 | 23 |
| Chan (1993) | 106 | 0 | 106 | 55 | 51 |
| Groenewegen, de Jong & Baas (1993) | 25 | 0 | 25 | 14 | 11 |
| Guglielmo et al. (1993) | 106 | 5 | 101 | 0 | 101 |
| Kastner et al. (1993) | 18 | 0 | 18 | 9 | 9 |
| Volk, Kwok & Woodsworth (1993) | 17 | 2 | 15 | 13 | 2 |
| Loup et al. 1993 | 205 | 16 | 189 | 160 | 29 |
| Groenewegen, de Jong & Geballe (1994) | 16 | 0 | 16 | 14 | 2 |
| Lorenz-Martins & Lefevre (1994) | 32 | 0 | 32 | 30 | 2 |
| Whitelock et al. (1994) | 3 | 0 | 3 | 3 | 0 |
| Groenewegen (1995) | 21 | 0 | 21 | 21 | 0 |
| Groenewegen, van den Hoek & de Jong (1995) | 21 | 0 | 21 | 10 | 11 |
| Guglielmo et al. (1997) | 25 | 0 | 25 | 0 | 25 |
| Kwok et al. (1997) | 715 | 2 | 713 | 402 | 311 |
| Guglielmo et al. (1998) | 27 | 0 | 27 | 2 | 25 |
| Groenwegen et al. (2002) | 252 | 14 | 238 | 208 | 30 |
| Le Bertre et al. (2005) | 143 | 4 | 139 | 38 | 101 |
| Guandalini et al. (2006) | 270 | 20 | 250 | 241 | 9 |
| Menzies, Feast & Whitelock (2006) | 177 | 2 | 175 | 146 | 29 |
| Whitelock et al. (2006) | 257 | 35 | 222 | 180 | 42 |
| Chen & Shan (2008) | 348 | 0 | 348 | 348 | 0 |
| Total number | 2970 | 111 | 2860 | 1692 | 1168 |
| -PSC | 1012 | ||||
| -BSC | 675 | ||||
| -PSC | 687 | ||||
| a: One object is added to the list. |
2.3 S stars and silicate carbon stars
For the sample of S stars in AGB phase, we use the list of objects which are classified to be intrinsic S stars by Van Eck et al. (2000), Yang et al. (2006) and Guandalini & Busso (2008). Table 3 shows the revised list of S stars which contains 362 sources. Compared to Suh & Kwon (2009), the number has been increased by 75. Silicate carbon stars are the carbon stars with silicate dust features. For the sample of silicate carbon stars in AGB phase, we use the same list as presented in Suh & Kwon (2009) except that one silicate carbon star ( 04496-6958) is excluded because it is not in our Galaxy. The list of S stars and silicate carbon stars is shown in Table 3.
| References | Original | Excluded | Selected | Duplicate | Remaining | Note |
| Van Eck et al. (2000) | 133 | 11 | 122 | 0 | 122 | S stars |
| Yang et al.(2006) | 286 | 2 | 285 | 52 | 233 | S stars |
| Guandalini & Busso (2008) | 187 | 2 | 185 | 178 | 7 | S stars |
| Total number | 606 | 15 | 592 | 230 | 362 | S stars |
| -PSC | 336 | |||||
| -BSC | 86 | |||||
| -PSC | 128 | |||||
| Kwok & Chan(1993) | 15 | 0 | 15 | silicate C | ||
| Chen, Wang & Wang (1999) | 22 | 15 | 7 | silicate C | ||
| Jiang, Szczerba & Deguchi (2000) | 1 | 0 | 1 | silicate C | ||
| Molster et al. (2001) | 1 | 0 | 1 | silicate C | ||
| Chen & Wang (2001) | 1 | 0 | 1 | silicate C | ||
| Chen & Zhang (2006) | 9 | 0 | 9 | silicate C | ||
| Boboltz et al. (2007) | 1 | 0 | 1 | silicate C | ||
| Total number | 50 | 15 | 35 | silicate C | ||
| -PSC | 31 | |||||
| -BSC | 18 | |||||
| -PSC | 22 |
2.4 NIR data
For the AGB stars listed in our new catalog, we have tried to collect all the available NIR data at and bands obtained from ground based observations. We have made revisions to the list of NIR data in Suh & Kwon (2009) by verifying the position information and added data for many objects.
We cross-identify the source by finding the nearest one in the position within 10 by using the position information in version 2.1 of the PSC. We have found the counterparts for 2840 O-rich stars, 1090 C-rich stars, 356 S stars and 32 silicate carbon stars. We use only the good quality NIR data at band for this paper.
Variations of the band (2.2 m) are designated as (2.0-2.3 m; 2.17 m for ). For analyzing the large sample of data in a single 2CD, we need to ignore the slight variations of the and bands depending on the observation systems. In this paper, we assume the same band wavelengths for (2.2 m) and (3.5 m) bands for all variations. There could be minor errors for this assumption.
Table 4 lists the numbers of collected NIR data at and bands for the sample AGB stars. Some stars are observed more than one time.
| O-rich stars | C-rich stars | S stars | Silicate carbon stars | ||||
| References | |||||||
| Neugebauer et al. (1969) | 4 | 4 | |||||
| Epchtein et al. (1990) | 20 | 20 | 217 | 217 | 3 | 3 | |
| Lloyd Evans (1990) | 3 | 3 | |||||
| Noguchi et al. (1990) | 3 | 3 | |||||
| Blommaert et al. (1993) | 9 | 9 | |||||
| Groenewegen et al. (1993) | 25 | 25 | |||||
| Guglielmo et al. (1993) | 101 | 101 | |||||
| Kastner et al. (1993) | 18 | 17 | 15 | 14 | |||
| Nyman et al. (1993) | 35 | 35 | |||||
| Whitelock et al. (1994) | 58 | 58 | 3 | 3 | |||
| Xiong et al. (1994) | 56 | 19 | |||||
| Lepine et al. (1995) | 358 | 332 | 1 | 1 | |||
| Noguchi et al. (1995) | 5 | 5 | |||||
| Guglielmo et al. (1997) | 16 | 16 | 39 | 39 | |||
| Guglielmo et al. (1998) | 21 | 21 | 27 | 27 | |||
| Deguchi et al. (2002) | 111 | 0 | |||||
| Le Bertre et al. (2003) | 535 | 535 | |||||
| Le Bertre et al. (2005) | 139 | 139 | 1 | 1 | |||
| Jimenez-Esteban et al. (2005) | 287 | 0 | |||||
| Jimenez-Esteban et al. (2006) | 59 | 0 | |||||
| Whitelock et al. (2006) | 222 | 219 | 2 | 2 | |||
| Izumiura et al. (2008) | 2 | 2 | |||||
| (; good quality) | 1743 | 577 | 311 | 15 | |||
| Total numbera | 3326 (2307) | 1062 (967) | 1365 (877) | 784 (658) | 311(311) | 39(23) | 24(15) |
| -PSC | 1853 | 766 | 761 | 561 | 297 | 21 | 15 |
| a: The number in a parenthesis means the number of objects. | |||||||
3 and data
By using the position information in version 2.1 of the PSC, we cross-identify the and counterparts by finding the nearest source for each object in the new catalog of AGB stars.
3.1 data
For PSC, we find the closest counterpart in the position within 10. For BSC, we find the closest source in the position within 1.
We have cross-identified the PSC counterparts for 2356 O-rich stars (detection rate: 78.5 %), 1012 C-rich stars (86.6 %), 336 S stars (92.8 %) and 31 silicate carbon stars (88.6 %) (see Tables 1 through 3). We have cross-identified the BSC counterparts for 1548 O-rich stars (51.5 %), 675 C-rich stars (57.8 %), 86 S stars (23.8 %) and 18 silicate carbon stars (51.4 %). We use PSC data at two bands (9 and 18 m) and BSC data at four bands (65, 90, 140 and 160 m).
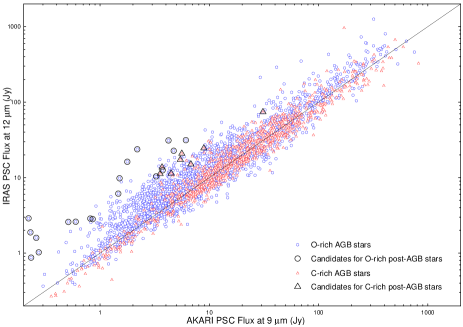
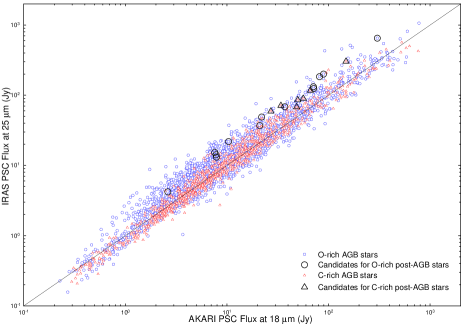
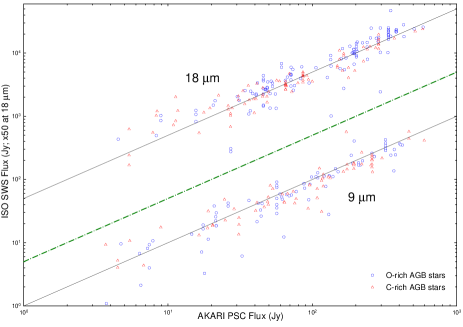
In Fig. 1, and PSC fluxes are compared for the cross-identified objects. We plot only the objects with good quality (q=3) data at any wavelengths. It is evident that there is a close correlation between two sets of data.
Some objects on the left panel of Fig. 1 are too far off from the general trend. This may be because they are large amplitude pulsators or because they are not AGB stars (possibly post-AGB stars). We mark the candidates for post-AGB stars (see Section 4.2) on both panels of Fig. 1. We find that the large scatters happen only on the left panel for the candidate stars probably because the shapes of their SEDs are somewhat different from those for typical AGB stars.
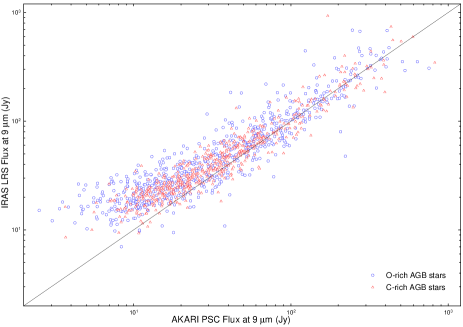
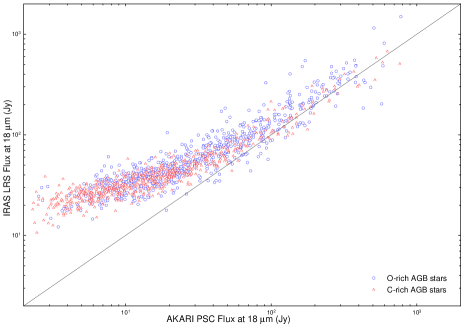
LRS ( = 822 m) data can be used for comparison with fluxes at 9 and 18 m. We use interpolated values of the spectral fluxes at 9 and 18 m using a cubic spline method. In Fig. 2, we compare the fluxes at 9 and 18 m obtained from LRS data with those from data for 922 O-rich stars and 703 C-rich stars in the sample. Dim sources are brighter in LRS than in PSC. The difference could be attributed to the difference in the spatial resolution as Ishihara et al. (2010) pointed out to explain a similar phenomenon. LRS measures the total flux of the dim emission because of the larger aperture size (156), whereas measures the flux of the peak emission with a smaller aperture ( 9 beam size). We find that the effect of dim sources brighter with LRS data is more enhanced at 18 m if compared with the effect at 9 m. This could be due to the fact that the detectable image size at 18 m is much larger than the one at 9 m for dusty AGB stars.
We may also use Short Wavelength Spectrometer (SWS; = 2.445.4 m) data for comparison with fluxes at 9 and 18 m. Sloan et al. (2003) presented the SWS catalog which contains the high resolution spectral data for 1271 observations. We have cross-identified 121 O-rich stars (185 observations) and 68 C-rich stars (105 observations) from the SWS catalog by finding the closest counterpart in the position within 30. Unlike LRS data, most SWS spectral data show severe scatters and/or noises. Therefore, we obtain the SWS fluxes at 9 and 18 m using linear least squares regression in the wavelength range of 0.1 m from the central wavelengths. We find that the results obtained by using a cubic polynomial regression method in a wider wavelength range show only minor differences. By examining the SEDs with the SWS data and other photometric data (, and ), we exclude some SWS data that are not usable. We compare fluxes at 9 and 18 m obtained from SWS data with those from data in Fig. 3. As expected, the correlations show relatively large scatters but do not show the effect of dim sources brighter with SWS data. This could be because SWS used a smaller apertures size (1420-27) than LRS.
3.2 data
The (6C) PSC (Egan et al. 2003) provided useful photometric data at 8.28, 12.13, 14.65, 21.34 m wavelength bands for 441,879 sources. By using the position information in the PSC, we cross-identify the (6C) PSC source by finding the nearest one. We have found that the closest counterparts in the position within 10 (30) are 1575 (1966) O-rich stars, 609 (687) C-rich stars, 125 (128) S stars and 19 (22) silicate carbon stars. We have found that most objects in the deviation range 10 - 30 are correct counterparts. Therefore, we use the closest counterparts in the position within 30 for the (6C) PSC.
4 Two-Colour Diagrams
Only a relatively small number of AGB stars have complete or nearly complete spectral energy distributions (SEDs). A large number of stars have infrared fluxes from , , and NIR data. Although less useful than a full SED, the large number of observations with less extensive wavelength coverage can be used to form 2CDs that can be compared to theoretical model predictions.
The colour index is defined by
| (1) |
where means the zero magnitude calibration at given wavelength (). The magnitude scales for , and photometric systems are given in the corresponding explanatory supplements (: Joint IRAS Science Working Group 1986; : Egan et al. 2003; IRC: Tanabe et al. 2008; FIS: AKARI/FIS Data Reduction Support Page). Table 5 lists the zero magnitude scales.
| Band | (m) | (Jy) | |
| 12 | 12 | 28.3 | |
| 25 | 25 | 6.73 | |
| 60 | 60 | 1.19 | |
| 100 | 100 | 0.43 | |
| S9W | 9 | 56.262 | |
| L18W | 18 | 12.001 | |
| N60 | 65 | 0.965 | |
| WIDE-S | 90 | 0.6276 | |
| WIDE-L | 140 | 0.1895 | |
| N160 | 160 | 0.1487 | |
| A | 8.28 | 58.49 | |
| C | 12.13 | 26.51 | |
| D | 14.65 | 18.29 | |
| E | 21.34 | 8.8 |
For the large sample of AGB stars, we present various infrared 2CDs using (PSC; 12, 25, 60 and 100 m), (PSC and BSC; 9, 18, 65, 90, 140 and 160 m), (PSC; 8.28, 12.13, 14.65 and 21.34 m) and NIR ( and bands; including data at band) data. For any 2CDs using , , PSC or BSC data, we plot only the objects with good quality (q=3) at any wavelength.
We will compare the observations with theoretical models on the 2CDs in Section 5. It is well known that the position of an AGB star on a 2CD widely varies depending on the phase of pulsation (e.g., Suh 2004). If we are able to use the colours observed and averaged for an entire pulsation period, the observed positions on 2CDs will be more useful to be compared with the theoretical models.
4.1 , and 2CDs
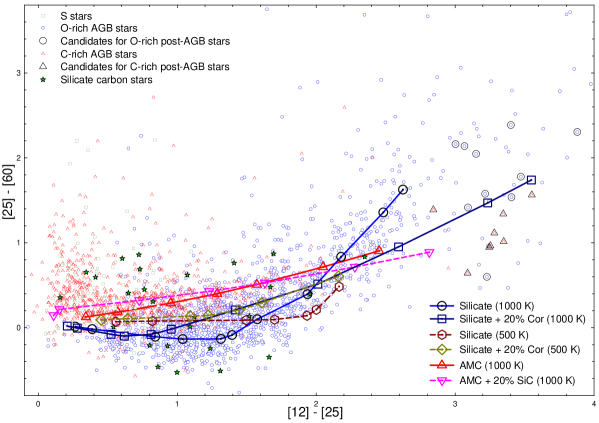
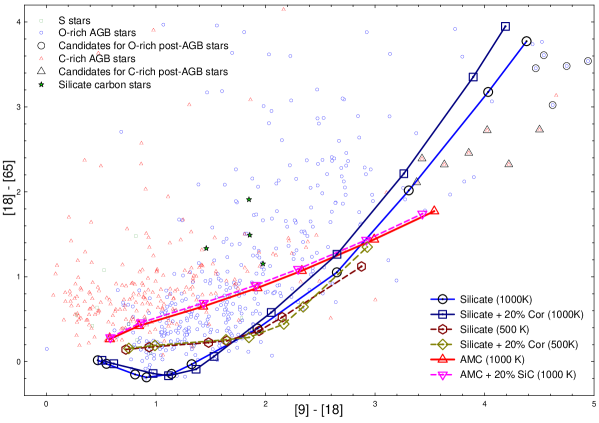
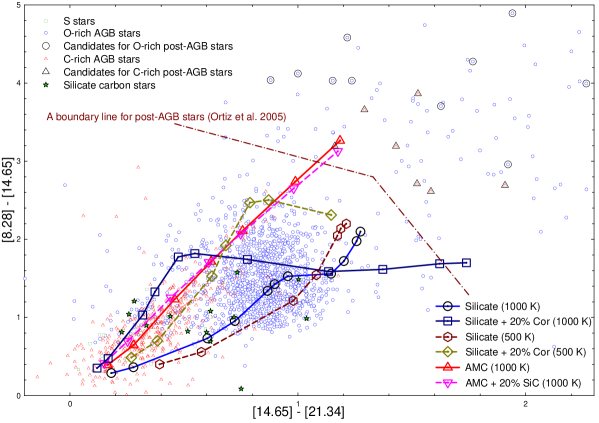
Fig. 4 shows , and 2CDs for AGB stars. The small symbols are the observational data and the lines with large symbols are the model calculations for a range in dust shell optical depth. We will discuss the theoretical models in Section 5. On these diagrams, the stars in the upper-right region have thick dust shells with large optical depths.
The upper panel of Fig. 4 plots AGB stars in an 2CD using [25][60] versus [12][25]. We find that the basic theoretical model tracks roughly coincide with the densely populated observed points. Because the 10 m silicate feature changes from emission to absorption when the dust optical depth becomes larger, there is a change in the slope of the theoretical model line for O-rich stars.
Carbon stars are distributed along a curve in the shape of a ”C”. A group of stars in the upper left region are optical carbon stars that show excessive flux at 60 m which is due to the remnant of earlier phase when the star was an O-rich AGB star (e.g., Chan & Kwok 1990). A group of stars in the lower region, which extend to the right side, are infrared carbon stars. The infrared carbon stars in the right side have thick dust envelopes with large optical depths.
The middle panel of Fig. 4 plots AGB stars on an 2CD using [18][65] versus [9][18]. Because the number of available observational data is much smaller than the one for an 2CD, it is difficult to make a comparison with the theoretical model lines. However, PSC data with a combination of , and NIR data can make various meaningful 2CDs that can be compared with theoretical models (see Figs 5, 6 and 7).
The lower panel of Fig. 4 plots AGB stars on a 2CD using [8.28][14.65] versus [14.65][21.34]. Ortiz et al. (2005) used this 2CD for investigating the tracks of AGB to post-AGB evolution. The boundary line for post-AGB stars as suggested by Ortiz et al. (2005) is marked on the 2CD and we find that all the candidates for post-AGB stars (see Section 4.2) are in the region of post-AGB stars.

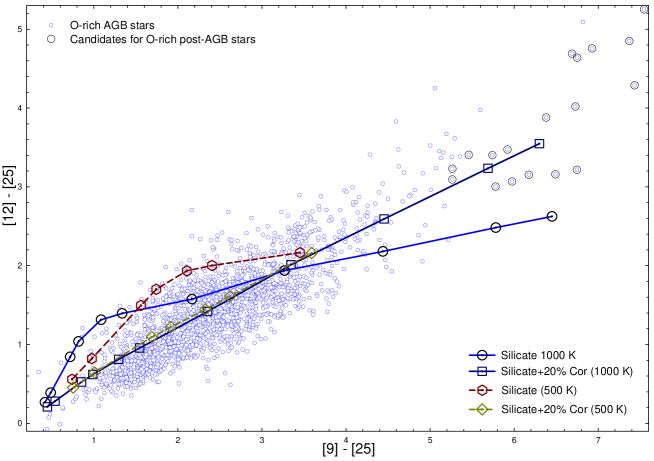
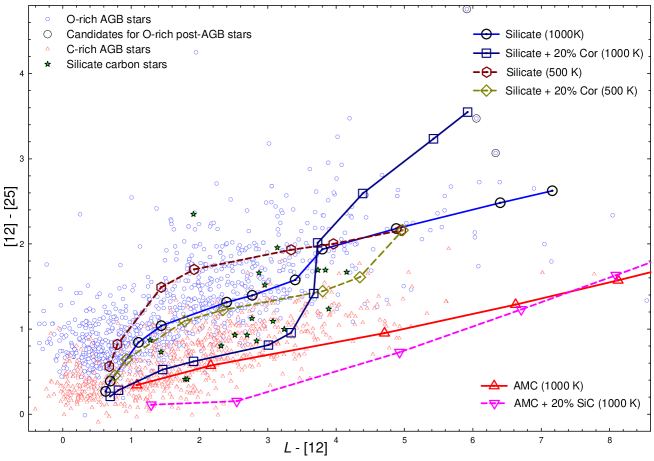
Fig. 5 plots AGB stars on - 2CDs. The upper panel of Fig. 5 plots a 2CD using [12][25] versus [9][12]. The lower panel of Fig. 5 plots a 2CD only for O-rich stars using [12][25] versus [9][25].
4.2 Candidates for post-AGB stars
We may distinguish post-AGB stars from AGB stars by analyzing the SEDs. Post-AGB stars would show generally larger [9][12] or [12][25] colours than AGB stars (e.g., García-Lario et al. 1997; Sevenster 2002; Ortiz et al. 2005; Bains et al. 2009).
For simplicity, we choose the objects with large [9][12] and [12][25] colours as the candidates for post-AGB stars. For O-rich stars, we choose the sources with [9][12] 2 and [12][25] 3. For C-rich stars, we choose the ones with [9][12] 1.5 and [12][25] 2.2. We choose these boundaries because most AGB stars are populated inside. We find that 18 O-rich stars and 8 C-rich stars in our sample satisfy the condition (see the upper panel of Fig. 5). They are likely to be post-AGB stars and are listed in Table 6.
The candidates for post-AGB stars are marked in all 2CDs (in Figs 4, 5, 6 and 7) and in Fig. 1. Some stars in an outer region on one 2CD can be located in a populated AGB region on another 2CD. However, the positions of all the candidate stars locate in outer regions on all the 2CDs presented in this paper implying that they are good candidates. Note that the number of the objects for each 2CD can be different depending on availability of the data. For example, three objects were not observed at band as indicated in Table 6.
| Object | [9-12] | [12-25] | Note |
| ( PSC #) | |||
| 16115-5044 | 2.00 | 4.69 | O-rich |
| 16342-3814 | 3.15 | 4.29 | O-rich |
| 17168-3736 | 2.78 | 3.00 | O-rich |
| 17385-3332 | 3.53 | 3.22 | O-rich |
| 17436+5003 | 2.30 | 5.25 | O-rich |
| 17499-3520 | 2.04 | 3.23 | O-rich |
| 17560-2027 | 2.71 | 4.02 | O-rich |
| 18051-2415 | 3.02 | 3.15 | O-rich |
| 18087-1440 | 2.50 | 3.88 | O-rich (no ) |
| 18135-1456 | 2.91 | 3.07 | O-rich |
| 18276-1431 | 2.45 | 3.47 | O-rich |
| 18450-0148 | 3.33 | 3.16 | O-rich |
| 18451-0332 | 2.17 | 4.76 | O-rich |
| 18518+0558 | 2.17 | 3.09 | O-rich (no ) |
| 18596+0315 | 2.34 | 3.40 | O-rich |
| 19024+0044 | 2.11 | 4.64 | O-rich |
| 19114+0002 | 2.52 | 4.85 | O-rich |
| 20406+2953 | 2.05 | 3.41 | O-rich |
| 07134+1005 | 1.84 | 3.25 | C-rich |
| 19454+2920 | 2.00 | 3.35 | C-rich |
| 19477+2401 | 2.00 | 3.28 | C-rich |
| 19480+2504 | 2.17 | 2.84 | C-rich |
| 20000+3239 | 1.61 | 3.24 | C-rich |
| 22272+5435 | 1.69 | 3.09 | C-rich |
| 23304+6147 | 1.76 | 3.35 | C-rich |
| 23321+6545 | 2.17 | 3.55 | C-rich (no ) |
4.3 --NIR 2CDs
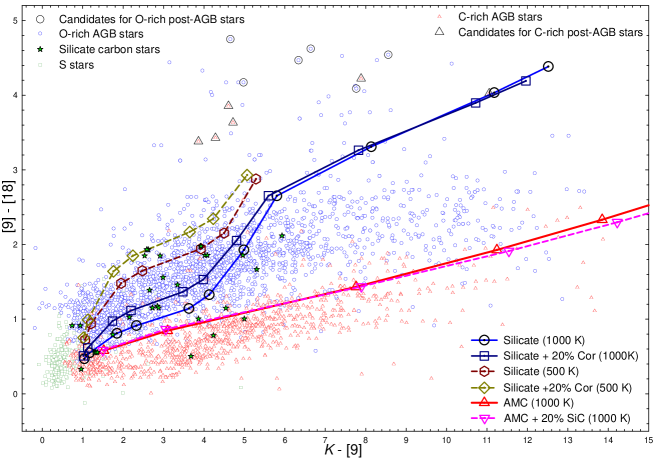
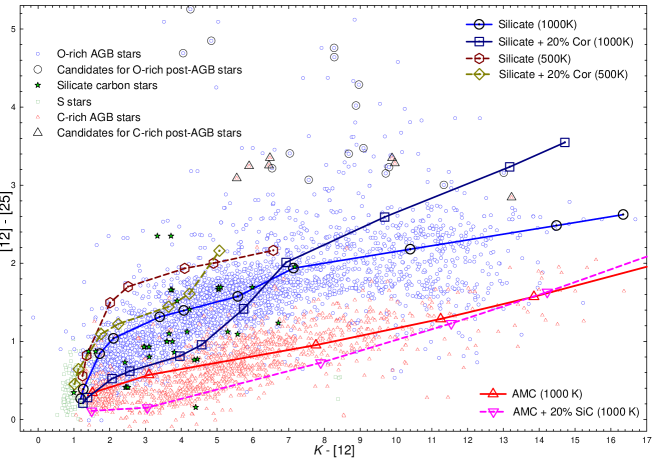
Figs 6 and 7 show 2CDs using , and NIR data ( and bands). If we compare them with Figs 4 and 5, we find that the boundaries which separate O-rich, C-rich and S stars are more clear in --NIR 2CDs.
Fig. 6 displays two 2CDs using band data (the [9][18] versus [9] and [12][25] versus [12] plots). We find that the basic theoretical model tracks roughly coincide with the densely populated observed points.
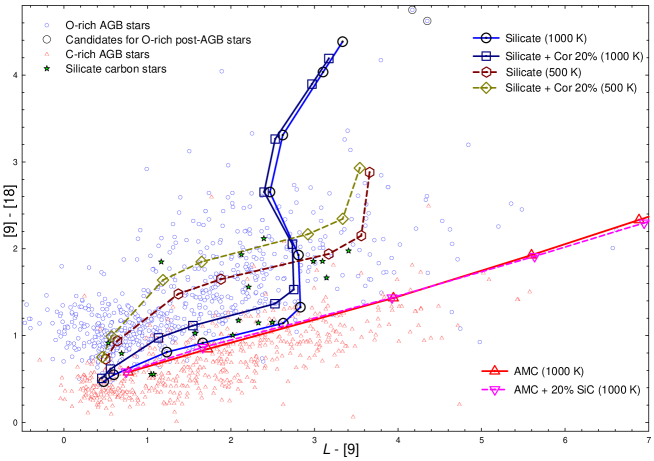
Fig. 7 shows two 2CDs using band data (the [9][18] versus [9] and [12][25] versus [12] plots). In our catalog, the number of available NIR data at band is much smaller than the number at band. The observed colours generally fit the theoretical model lines.
5 Theoretical Models
For this paper, we use the radiative transfer code DUSTY developed by Ivezić & Elitzur (1997) for a spherically symmetric dust shell. We have performed the model calculations in the wavelength range 0.01 to 36000 m.
For all the models, we assume the dust density distribution is inversely proportional to the square of the distance (). The dust condensation temperature () is assumed to be 1000 K and 500 K. The outer radius of the dust shell is always taken to be times the inner radius ().
5.1 O-rich stars
For O-rich stars, we use a simple mixture of silicate and corundum (20 % by mass) dust grains as well as pure silicate. For silicate, we use the optical constants of warm and cold silicate grains derived by Suh (1999). Corundum (Cor) grains are thought to be the earliest products of the dust condensation process around O-rich AGB stars (e.g., Maldoni et al. 2005). We use the optical constants of amorphous corundum (Al2O3; porous) obtained by Begemann et al. (1997).
The radii of spherical dust grains have been assumed to be 0.1 m uniformly. We choose 10 m as the fiducial wavelength that sets the scale of the optical depth () and compute models for eleven optical depths ( 0.005, 0.01, 0.05, 0.1, 0.5, 1, 3, 7, 15, 30 and 40). For the central star, we assume that the luminosity is and the stellar blackbody temperature is 2500 K for and 2000 K for . Also, we use the warm silicate dust grains for LMOA stars (7 models with ) and the cold grains for HMOA stars (4 models ).
The track line of the theoretical model results for silicate dust with = 1000 K (TLS) on a 2CD can show various interesting behaviors because the 10 m silicate feature changes from emission to absorption when the dust optical depth becomes larger ( ). The TLS for increasing optical depths show wide variations in the inclination (see Figs 4, 5, 6 and 7) including backward effects (see Figs 5 and 7).
On the upper panel of Fig. 5, the TLS in the horizontal direction ([9][12] colour) initially moves backward when the 10 m silicate emission feature becomes more prominent then moves forward when the 10 m silicate feature changes from emission to absorption.
On the upper panel of Fig. 7, the TLS in the horizontal direction ([9] colour) initially moves forward rapidly when the 10 m silicate emission feature becomes more prominent. Then it moves backward when the 10 m silicate feature changes from emission to absorption and then moves forward very slowly in the horizontal direction. This effect becomes much weaker for the 2CD using the [12] colour (the lower panel of Fig. 7) because the influence of the 10 m silicate feature at 12 m is weaker than at 9 m. The backward effect does not happen for the [9] colour (see the upper panel of Fig. 6) because the 10 m silicate feature is more distant from the band.
Suh (2004) pointed out that a low dust condensation temperature is generally required for LMOA stars with thin dust envelopes. The models with a low dust condensation temperature ( = 500 K) for seven models of LMOA stars with thin dust envelopes ( 0.005, 0.01, 0.05, 0.1, 0.5, 1 and 3) are also shown for comparison. It is clear that the locations of observed LMOA stars on 2CDs are close to the theoretical model lines with a low dust condensation temperature (See Figs 4, 5, 6 and 7). The models with a low dust condensation temperature ( = 500 K) can make a better fit with observations of LMOA stars. When we use different dust condensation temperatures from 500 to 1000 K, we find that a series of model tracks with lower temperatures (e.g., 500-700 K) can cover an area of LMOA stars fairly well.
Amorphous corundum (Al2O3; Begemann et al. 1997) grains produce a single peak at 11.8 m and influences the shape of the SED at around 10 m. The shape of the 10 m feature of O-rich AGB stars, which is mainly produced by silicate, can be modified by addition of corundum dust. The , and flux data at 12, 9, 14.65 and 8.28 m would exhibit the presence of corundum dust efficiently.
Many 2CDs displayed in Figs 4, 5, 6 and 7 show that a mixture of silicate (80 % by mass) and corundum (20 %) can make a better fit with observations of O-rich stars rather than pure silicate. When we change the abundance of corundum from 0 to 20 % gradually, we find that the series of model tracks can cover a wide area of the most populated observation points fairly well for many 2CDs. This effect is more clear on the 2CD using [12][25] versus [12] (the lower panel of Fig. 6). Other 2CDs using the fluxes at 12 and 9 m also show the effect well. The effect of corundum dust would be prominent for the 2CDs using the fluxes at 12, 9, 14.65 and 8.28 m. However, the effect of corundum abundance may not improve the fitting with observations for some 2CDs (e.g., the 2CD in the lower panel of Fig. 7).
5.2 C-rich stars
For C-rich stars, we use the optical constants of amorphous carbon (AMC) grains derived by Suh (2000) and the optical constants of SiC grains by Pégourié (1988). The radii of spherical dust grains have been assumed to be 0.1 m uniformly. We choose 10 m as the fiducial wavelength that sets the scale of the optical depth() and perform the model calculations for seven optical depths ( 0.01, 0.1, 1, 2, 3, 5 and 7). For the central star, we assume that the luminosity is and the stellar blackbody temperature is 2300 K for and 2000 K for . For C-rich stars, we use a simple mixture of AMC and SiC (10 % by mass) dust grains.
It is known that a portion (10 - 20 %) of SiC dust grains produce the prominent SiC emission features at 11.3 m for C-rich AGB stars (e.g., Suh 2000). The theoretical model lines of carbon stars on --NIR 2CDs show that the effect of SiC is only minor at 9 m (see upper panels of Figs 6 and 7). On the other hand, the effect of SiC is evident on the 2CDs using 12 m fluxes (see lower panels of Figs 6 and 7). The most prominent effect of SiC can be seen on the 2CD using [12][25] versus [9][12] (the upper panel of Fig. 5). By changing the abundance of SiC from 0 to 20 %, we find that the model tracks can cover the area of the well populated observation points.
5.3 Discussion on dust opacity
The and the provided good quality photometric data for a large sample of AGB stars at wavelengths (9, 18, 65, 90, 140 and 160; 8.28, 12.13, 14.65 and 21.34 m) not observed before. Therefore, the new 2CDs using , , and NIR data may provide new opportunities to further understand about the dust around AGB stars. Even though we could make more or less proper explanations for the observations on the various 2CDs using the theoretical models, we may need to improve the theoretical models in the light of the new observations.
Possibly due to three reasons, it is difficult to find the theoretical models which make better fits with the observations on the various 2CDs in a consistent way. First, we may have not considered some important dust species. Secondly, the dust opacity functions used for this work may need to be improved. Finally, the radiative transfer model could be too simple.
For O-rich stars, the models with pure silicate dust opacity do not make satisfactory fits for some 2CDs using , and data. As we discussed in Section 5.1, this could be due to presence of corundum dust. Other important dust species such as MgFeO series may need to be considered for O-rich stars. The dust grains of MgFeO series (Henning et al. 1995) produce single peaks at 15-22 m. They could be responsible for and fluxes in the 15-22 m region.
The opacity functions for amorphous silicate and AMC dust grains may need to be improved. The opacity functions, which were derived by Suh (1999, 2000) from 2CDs and SEDs of AGB stars using the and other available data, make less satisfactory fits for some 2CDs using or data. The opacity in a given wavelength region approximately matches the curve of a simple power law () with a different spectral index () in each wavelength region. More refined procedures to obtain new spectral indexes would be useful to find the opacity functions of silicate and AMC which make better fits with the new 2CDs.
The radiative transfer code DUSTY (Ivezić & Elitzur 1997) which is used for this work can treat only a single component dust shell. In reality, there would be multiple dust components with different density and temperature distributions in AGB stars. For O-rich AGB stars, it would be more reasonable to consider multiple components of corundum and silicate dust grains rather than a single component of a simple mixture.
Further investigations on the theoretical models compared with the full SEDs as well as 2CDs for a large sample of AGB stars would be necessary. We expect that a more sophisticated radiative transfer model (e.g., a model for multiple dust components) using a more reasonable set of various dust opacity functions would be useful. Recently, laboratory measurements for dust in various sample shapes (e.g., Mutschke, Min & Tamanai 2009; Koike et al. 2010) and environments (e.g., olivine at different temperatures: Koike et al. 2006) provided new opportunities to identify appropriate dust species from the observations.
We did not consider opacities of molecules for radiative transfer models in this paper. However, molecules as well as dust in the envelopes around AGB stars contribute to the opacity (e.g., Cristallo et al. 2007). In NIR regions, the molecular contributions to the observed SEDs of AGB stars are significant especially for the AGB stars with thin dust envelopes (e.g., Suh & Kwon 2009). More sophisticated radiative transfer models that can treat both molecules and dust would be necessary.
6 Conclusions
Using a revised version of the catalog of AGB stars by Suh & Kwon (2009), we have compiled the available observed fluxes at various infrared wavelengths for 3003 O-rich, 1168 C-rich, 362 S-type and 35 silicate carbon stars in our Galaxy. For each object in the new catalog, we have cross-identified the , and counterparts by finding the nearest source using the position information in version 2.1 of the PSC.
For the large sample of AGB stars, we have presented various infrared 2CDs using (PSC), (PSC and BSC), (PSC) and NIR ( and bands; including data at band) data for different classes of AGB stars based on the chemistry of the dust shell and/or the central star. Using theoretical radiative transfer models for dust envelopes around O-rich and C-rich AGB stars, we have plotted tracks of models results with increasing dust shell optical depths on the 2CDs.
Comparing the observations with the models on the 2CDs, we have found that the basic model tracks roughly coincide with the densely populated observed points. The theoretical models using the opacity functions of amorphous silicate, AMC, SiC and corundum can explain the observations of O-rich and C-rich AGB stars on the various 2CDs fairly well in general. We could explain various behaviors of model tracks on the 2CDs using the known features of observations (e.g., silicate and SiC features). For O-rich AGB stars, we have found that the models using corundum dust as well as silicate can improve the fit with the observations.
To better explain the observations of AGB stars, further investigations using a more sophisticated radiative transfer model with an appropriate choice of improved opacity functions for more various dust species would be necessary.
We expect that our work would be helpful for further investigations about AGB stars. The updated catalog data will be open to the public through the first author’s world wide web site http://web.chungbuk.ac.kr/kwsuh/.
Acknowledgments
This work was supported by the Korea Science and Engineering Foundation (KOSEF) grant funded by the Korea government (MEST) (No.R01-2008-000-20002-0). This research has made use of the SIMBAD database, operated at CDS, Strasbourg, France. This research is based on observations with AKARI, a JAXA project with the participation of ESA.
References
- (1) Bains I., Cohen M., Chapman J. M., Deacon R. M., Redman, M. P., 2009, MNRAS, 397, 1386
- (2) Begemann B., Dorschner J., Henning Th., Mutschke H., Guertler J.,Koempe C., Nass R., 1997, ApJ, 476, 199
- (3) Blommaert J. A. D. L., van der Veen W. E. C. J., Habing H. J., 1993, A&A, 267, 39
- (4) Boblotz D. A., Ohnaka K., Driebe T., Murakawa K., Wittkowski M., Johnston K. J., Izumiura H., 2007, A&AS, 210, 8804
- (5) Busso M., Gallino R., Wasserburg G. J., 1999, ARA&A, 37, 239
- (6) Chan S. J., 1993, PASP, 105, 1107
- (7) Chan S. J., Kwok S., 1990, A&A, 237, 354
- (8) Chen P. S., Shan H. G., 2008, Ap&SS, 314, 291
- (9) Chen P. S., Wang X. H., 2001, ChJAA, 1, 344
- (10) Chen P. S., Zhang P., 2006, ChJAA, 6, 697
- (11) Chen P. S., Wang X. H., Wang F., 1999, Acta Astron. Sinica, 40, 32
- (12) Chen P. S., Szczerba R., Kwok S., Volk K., 2001, A&A, 368, 1006
- (13) Chengalur J. N., Lewis B. M., Eder J., Terzian Y., 1993, ApJSS, 89, 189
- (14) Cristallo S., Straniero O., Lederer M. T., Aringer B., 2007, ApJ, 667, 489
- (15) Cutri R. M. et al., 2003, 2MASS All Sky Catalog of point sources, NASA/IPAC Infrared Science Archive
- (16) David P., Le Squeren A. M., Sivagnanam P., 1993, A&A, 277, 453
- (17) Deguchi S., Fujii T., Izumiura H., Kameya O., Nakada Y., Nakashima J., Ootsubo T., Ukita N., 2000a, ApJS, 128, 571
- (18) Deguchi S., Fujii T., Izumiura H., Kameya O., Nakada Y., Nakashima J., 2000b, ApJS, 130, 351
- (19) Deguchi S., Fujii T., Nakashima J., Wood P. R., 2002, PASJ, 54, 719
- (20) Deguchi S., Imai H., Fujii T., Glass I. S., Ita Y., Izumiura H., Kameya O., Miyazaki A., Nakada Y., Nakashima J., 2004, PASJ, 56, 261
- (21) Deguchi S., Fujii T., Ita Y., Imai H., Izumiura H., Kameya O., Matsunaga N., Miyazaki A., Mizutani A., Nakada Y., et al. 2007, PASJ, 59, 559
- (22) Eder J., Lewis B. M., Terzian Y., 1988, ApJS, 66, 183
- (23) Egan M. P., Leung C. M., 1991, ApJ, 383, 314
- (24) Egan M. P., Price S.D., Kraemer K.E., Mizuno D.R., Carey S. J., Wright C.O., Engelke C.W., Cohen M., Gugliotti G. M., 2003, Air Force Research Laboratory Technical Report AFRL-VS-TR-2003-1589
- (25) Engels D., Heske A., 1989, A&AS, 81, 323
- (26) Epchtein N., Le Bertre T., Lepine J. R. D., 1990, A&A, 227, 82
- (27) García-Lario P., Manchado, A., Pych W., Pottasch S. R., 1997, A&AS, 126, 479
- (28) Groenewegen M. A. T., 1995, A&A, 293, 463
- (29) Groenewegen M. A. T., de Jong T., Baas F., 1993, A&AS, 101, 513
- (30) Groenewegen M. A. T., de Jong T., Geballe T.R., 1994, A&A, 287, 174
- (31) Groenewegen M. A. T., van den Hoek L. B., de Jong T., 1995, A&A, 293, 381
- (32) Groenewegen M. A. T., Sevenster M., Spoon H. W. W., Perez I., 2002, A&A, 390, 501
- (33) Guandalini R., Busso M., Ciprini S., Silvestro G., Persi P., 2006, A&A, 445, 1069
- (34) Guandalini R., Busso M., 2008, A&A, 488, 675
- (35) Guglielmo F., Epchtein N., Le Bertre T., Fouque P., Hron J., Kerschbaum F., Lepine J. R. D., 1993, A&AS, 99, 31
- (36) Guglielmo F., Epchtein N., Arditti F., Sevre F., 1997, A&AS, 122, 489
- (37) Guglielmo F., Le Bertre T., Epchtein N., 1998, A&A, 334, 609
- (38) Hall P. J., Allen D. A., Troup E. R., Wark R. M., Wright A. E., 1990a, MNRAS, 243, 480
- (39) Hall P. J., Wright A. E., Troup E. R., Wark R. M., Allen D. A., 1990b, MNRAS, 247, 549
- (40) Henning Th., Begemann B., Mutschke H., Dorschner J., 1995, A&AS, 112, 143
- (41) Herwig F., 2005, ARA&A, 43, 435
- (42) Iben I., Renzini A., 1983, ARA&A, 21, 271
- (43) Ishihara D., Onaka T., Kataza H., Salama A., Alfageme C., Cassatella A., Cox N., Garcia-Lario P., Stephenson C., Cohen M., et al. 2010, A&A, 514, 1
- (44) Ita Y., Deguchi S., Fujii T., Kameya O., Miyoshi M., Nakada Y., Nakashima J., Parthasarathy M., 2001, A&A, 376, 112
- (45) Ivezić A., Elitzur M., 1997, MNRAS, 287, 799
- (46) Izumiura H., Deguchi S., Hashimoto O., Nakada Y., Onaka T., Ono T., Ukita N., Yamamura I., 1994, ApJ, 437, 419
- (47) Izumiura H., Catchpole R., Deguchi S., Hashimoto O., Nakada Y., Onaka T., Ono T., Sekiguchi K., Ukita N., Yamamura I., 1995a, ApJS, 98, 271
- (48) Izumiura H., Deguchi S., Hashimoto O., Nakada Y., Onaka T., Ono T., Ukita N.,Yamamura I., 1995b, ApJ, 453, 837
- (49) Izumiura H., Deguchi S., Fujii T., Kameya O., Matsumoto S., Nakada Y., Ootsubo T., Ukita N., 1999, ApJS, 125, 257
- (50) Izumiura H., Noguchi K., Aoki W., Honda S., Ando H., Takada-Hidai M., Kambe E., Kawanomoto S., Sadakane K., Sato B., Tajittsu A., Tanaka W., Okita K., Watanabe E., Yoshida M., 2008, ApJ, 682, 499
- (51) Jewell P. R., Snyder L. E., Walmsley C. M., Wilson T. L., Gensheimer P. D., 1991, A&A, 242, 211
- (52) Jiang B. W., Deguchi S., Yamamura I., Nakada Y., Cho S. H., Yamagata T., 1996, ApJS, 106, 463
- (53) Jiang B. W., Szczerba R., Deguchi S., 2000, A&A, 362, 273
- (54) Jimenez-Esteban F. M., Agudo-merida L., Engels D., Garcia-Lario P., 2005, A&A, 431, 779
- (55) Jimenez-Esteban F. M., Garcia-Lario P., Engels D., Perea Calderon J. V., 2006, A&A, 446, 773
- (56) Joint IRAS Science Working Group, 1986, IRAS Explanatory Supplement. US Government Printing Office, Washington
- (57) Jorissen A., Mayor M., 1988, A&A, 198, 187
- (58) Jorissen A., Mayor M., 1992, A&A, 260, 115
- (59) Kastner J. H., Forveille T., Zuckerman B., Omont A., 1993, A&A, 275, 163
- (60) Kohoutek L. 2001, A&A 378, 843
- (61) Koike C., Mutschke H., Suto H., Naoi T., Chihara H., Henning Th., Jager C., Tsuchiyama A., Dorschner J., Okuda H., 2006, A&A, 449, 583
- (62) Koike C., Imai Y., Chihara H., Suto H., Murata K., Tsuchiyama A., Tachibana S., Ohara S., 2010, ApJ, 709, 983
- (63) Kozasa T., Hasegawa H., Seki J., 1984, Ap&SS, 98, 61
- (64) Kwok S., Chan S. J., 1993, AJ, 106, 2140
- (65) Kwok S., Volk K., Bidelman W.P., 1997, ApJS, 112, 557
- (66) Le Bertre T., Tanaka M., Yamamura I., Murakami H., 2003, A&A, 403, 943
- (67) Le Bertre T., Tanaka M., Yamamura I., Murakami H., MacConnell D. J., 2005, PASP, 117, 199
- (68) Le Squeren A. M., Sivagnanam P., Dennefeld M., David P., 1992, A&A, 254, 133
- (69) Lepine J. R. D., Oritiz R., Epchtein N. 1995, A&A, 299, 453
- (70) Lewis B. M. 1994, ApJS, 93, 549
- (71) Lewis B. M., Eder J., Terzian Y., 1990, ApJ, 362, 634
- (72) Lloyd Evans T., 1990, MNRAS, 243, 336
- (73) Lloyd Evans T., Little-Marenin I. R., 1999, MNRAS, 304, 421
- (74) Lorenz-Martins S., Lefevre J., 1994, A&A., 291, 831-841
- (75) Loup C., Forveille T., Omont A., Paul J. F., 1993, A&AS, 99, 291
- (76) Maldoni M. M., Ireland T. R., Smith R. G., Robinson G., 2005, MNRAS, 362, 872
- (77) Menzies J. W., Feast M. W., Whitelock P. A., 2006, MNRAS, 369, 783
- (78) Minier V., Ellingsen S. P., Norris R. P., Booth R. S., 2003, A&A, 403, 1095
- (79) Molster F. J., Yamamura I., Waters L. B. F. M.,
- (80) Nyman L., Käufl H.-U., de Jong T., Loup C., 2001, A&A, 366, 923
- (81) Mutschke H., Min M., Tamanai A., 2009, A&A, 504, 875
- (82) Murakami H., Baba H., Barthel P., et al., 2007, PASJ, 59, S369
- (83) Nakashima J., Deguchi S., 2003a, PASJ, 55, 203
- (84) Nakashima J., Deguchi S., 2003b, PASJ, 55, 229
- (85) Neugebauer G., Leighton R. B., 1969, NASA SP-3047, Two-Micron Sky Survey. NASA Washington, DC
- (86) Noguchi K., Murakami H., Matsuo H., Noda M., Hamada H., Watabe T., 1990, PASJ, 42, 441
- (87) Noguchi K., Qian Z., Sun J., Wang G., 1995, PASJ, 47, 41
- (88) Nyman L.-A., Hall P. J., Le Bertre T., 1993, A&A, 280, 551
- (89) Ortiz R., Lorenz-Martins S., Maciel W. J., Rangel E. M., 2005, A&A, 431, 565
- (90) Pégourié B., 1988, A&A, 194, 335
- (91) Pestalozzi M. R., Minier V., Booth R. S., 2005, A&A, 432, 737
- (92) Rowan-Robinson M., Lock T. D., Walker D. W., Harris S., 1986, MNRAS, 222, 273
- (93) Salpeter E. E., 1974, ApJ, 193, 585
- (94) Samus N. N., Durlevich O. V., Kazarovets E. V., Kireeva N. N., Pastukhova E. N., Zharova A. V., 2011, General Catalog of Variable Stars (GCVS database, Version 2011Jan), CDS B/gcvs
- (95) Sevenster M. N., 2002, ApJ, 123, 2788
- (96) Sevenster M. N., Chapman J. M., Habing H. J., Killeen N. E. B., Lindqvist M. 1997a, A&AS, 122, 79
- (97) Sevenster M. N., Chapman J. M., Habing H. J., Killeen N. E. B., Lindqvist M. 1997b A&AS, 124, 509
- (98) Sevenster M. N., van Langevelde H. J., Moody R. A., Chapman J. M., Habing H. J., Killeen N. E. B., 2001, A&A, 366, 481
- (99) Sivagnanam P., Le Squeren A. M., Minh F. Tran, Braz M. A., 1990, A&A, 233, 112
- (100) Sloan G. C., Kraemer K. E., Price S. D., Shipman R. F., 2003, ApJS, 147, 379S
- (101) Suh K.-W., 1999, MNRAS, 304, 389
- (102) Suh K.-W., 2000, MNRAS, 315, 740
- (103) Suh K.-W., 2004, ApJ, 615, 485
- (104) Suh K.-W., Kwon Y.-J., 2009, JKAS, 42, 81
- (105) Tanabe T., Sakon I., Cohen M., Wada T., Ita Y., Ohyama Y., Oyabu S., Uemizu K., Takagi, T., Ishihara D., 2008, PASJ, 60, 375
- (106) te Lintel Hekkert P., Versteege-Hensel H. A., Habing H. J., Wiertz M. 1989, A&AS, 78, 399
- (107) Van Eck S., Jorissen A., Udry, S., Mayor M., Burki G., Burnet M., Catchpole R., 2000, A&AS, 145, 51
- (108) van der Veen W. E. C. J., Habing H. J., 1988, A&A, 194, 125
- (109) Volk K., Kwok S., Langill P., 1992, ApJ, 391,285
- (110) Volk K., Kwok S., Woodsworth A. W., 1993, ApJ, 402,
- (111) Wachter A., Schroder K.-P., Winters J. M., Arndt T. U., Sedlmayr E., 2002, A&A, 384, 452
- (112) Whitelock P. A., Menzies J., Feast M., Marang F., Carter B., Roberts G., Catchploe R., Chapman J., 1994, MNRAS, 267, 711
- (113) Whitelock P. A., Feast M. W., Marang F., Groenewegen M. A. T., 2006, MNRAS, 369, 751
- (114) Xiong G. Z., Chen P. S., Gao H., 1994, A&ASS, 108, 661
- (115) Yang X. H., Chen P., Wang J., He J., 2006, AJ, 132, 1468