The radio core of the Ultraluminous Infrared Galaxy F00183-7111: watching the birth of a quasar
Abstract
F00183-7111 is one of the most extreme Ultra-Luminous Infrared Galaxies known. Here we present a VLBI image which shows that F00183-7111 is powered by a combination of a radio-loud Active Galactic Nucleus surrounded by vigorous starburst activity. Although already radio-loud, the quasar jets are only 1.7 kpc long, boring through the dense gas and starburst activity that confine them. We appear to be witnessing this remarkable source in the brief transition period between merging starburst and radio-loud “quasar-mode” accretion.
keywords:
radio continuum: galaxies — galaxies: evolution — galaxies: ULIRG — galaxies: active — VLBI1 Introduction
Ultraluminous infrared galaxies (ULIRGs) are a class of galaxy with a bolometric luminosity in excess of which were first uncovered by the IRAS satellite more than 20 years ago (Aaronson & Olszewski, 1984; Houck et al., 1985; Allen, Roche, & Norris, 1985). A variety of observations suggest that they represent a transitional stage in which gas-rich spirals are merging to form a dusty quasar (Armus, Heckman, & Miley, 1987; Sanders et al., 1988; Veilleux et al., 2002; Spoon et al., 2009). According to the scenario by Sanders et al. (1988), the merger of two normal spirals fuels a pre-existing quiescent black hole and triggers a powerful nuclear starburst.This intense starburst activity causes the high infrared luminosity, and generates strong starburst-driven winds which will eventually blow away the enshrouding dust and lay bare the quasar core, depleting the dust and gas to form an elliptical galaxy (Dasyra et al., 2006a, b). This scenario is supported by merger simulations (e.g. Di Matteo et al., 2005; Hopkins et al., 2005), which show that the supermassive black hole grows by accretion while enclosed by obscuring dust, and then sheds its obscuring cocoon, deposited by the merger, through outflows driven by powerful quasar winds (Balsara & Krolick, 1993). This activity ceases when the fuel supply to the central regions is exhausted, starving both the active galactic nucleus (AGN) and the star forming activity. This scenario is also supported by the observational result that AGN activity increases with increasing bolometric luminosity (Genzel et al., 1998; Tran et al., 2001; Lonsdale et al., 2006).
In the low-redshift Universe, star formation is dominated by M82-type starburst galaxies, and less than 50 ULIRGs are known at . However, at higher redshifts the cosmic star formation rate is dominated by increasingly vigorous starburst galaxies. At ULIRGs are far more numerous than in the local Universe, and dominate the cosmic star formation rate (Blain et al., 2002; Le Floc’h et al., 2005; Lonsdale et al., 2006; Wilman et al., 2008). They appear to represent a significant step in the evolution of galaxies, so that understanding their nature is crucial to understanding galaxy evolution. However, the many magnitudes of extinction to their nuclei make it difficult to determine whether their dominant power source is accretion onto a supermassive central black hole, or a colossal starburst. The current consensus (e.g. Risaliti et al., 2010; Veilleux et al., 2009) is that most ULIRGs are primarily powered by a starburst, although an AGN is dominant in a significant fraction. However, this view is based largely on optical and near-infrared observations, which penetrate only the outer layer, and tell us little of the nucleus.
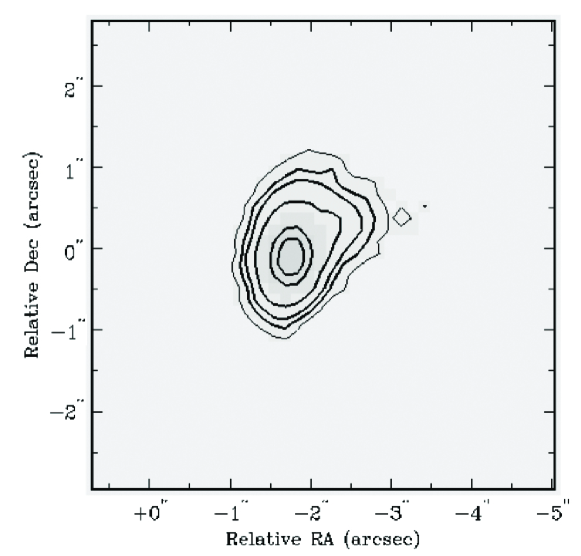
IRAS F00183-7111 (also known as IRAS 00182-7112, and which we shall hereafter refer to as 00183) is the most luminous ULIRG discovered in the IRAS survey, and one of the most luminous ULIRGs known. At a redshift of 0.3276 (Roy & Norris, 1997), it has a bolometric luminosity of (Spoon et al., 2009), most of which is radiated at far-infrared wavelengths, and a linear scale of 1 mas = 4.7 pc ( km s-1 Mpc-1). It is the most luminous of the extreme ULIRGs studied by Armus, Heckman, & Miley (1987), and also has the largest FIR excess, with . For comparison, Arp 220 has , and spectacular starburst systems like M82 and NGC 3256 have , so this is a heavily obscured object. Near-infrared imaging by Rigopoulou et al. (1999) (Figure 2) appears to show a disturbed morphology and a single nucleus, although the many magnitudes of extinction, even at near-IR wavelengths, mean that this image may be showing an outer shell of the galaxy, rather than the nucleus. CO emission has also been detected from 00183 with an inferred molecular gas mass M⊙(Norris et al., 2011), confirming that this object is a vigorous star-forming galaxy.
Optically (Drake et al., 2004), it appears as an unremarkable smudge 20 arcsec across (Heckman, Armus, & Miley, 1990), but long-slit spectroscopy shows bright ionised gas extending 50 kpc east and 10 kpc west of the nucleus, with highly disturbed kinematics. Line widths are km s-1 over a 30 kpc-diameter region, reaching 1000 km s-1 in the region 3 - 7 kpc east of the nucleus. Line profiles are double-peaked with a splitting of 300 - 400 km s-1 in the region 10 kpc east, and the profiles are strongly blue-shifted with respect to the nucleus out to 25 kpc E. The line ratios and widths are typical of Sy2 galaxies, and the kinematics suggest a powerful outflow.
Spoon et al. (2009) observed unusually wide [Ne II] and [Ne III] profiles in 00183 – the widest [Ne II] and second widest [Ne III] lines in a sample of 82 ULIRGs observed with Spitzer-IRS (Spoon & Holt, 2009). The lines may trace strongly disturbed gas, resulting from interaction of the radio jets with the ISM. However, the strong dust extinction means that these are characteristics of the outer parts of the galaxy, rather than the nucleus. The size, velocity, and morphology of the outflow agrees well with the super-wind model of Heckman, Armus, & Miley (1990), in which the optical emission comes from a thin shell of shock-heated ambient gas swept up by a wind driven by the overpressure produced by the starburst.
Spoon et al. (2004, 2007) fail to detect several common mid-infrared AGN tracers in their Spitzer-IRS high resolution spectrum. Furthermore, Spoon et al. (2004) detect a deep 9.7 m silicate absorption feature, and strong 4.7 m CO absorption. All of these are unusual for classical Seyfert galaxies and quasars (Spoon et al., 2007; Hao et al., 2007) suggesting that the line of sight to the nucleus is heavily obscured.
However, radio observations are unaffected by the heavy dust obscuration that blocks our view at shorter wavelengths, and allow us to see into the nucleus to look for typical AGN-related core-jet structures with high brightness temperature, to distinguish from diffuse, lower starburst emission. At the centre of 00183 lies a strong radio source (Roy & Norris, 1997), whose radio luminosity is ten times higher than would be expected from a star-forming ULIRG of 1013 . Instead, this radio luminosity is attributable to a radio-loud AGN buried at the core of 00183, with a radio luminosity of W Hz-1 (Roy & Norris, 1997) which places it within the regime of high luminosity (FRII-class) radio galaxies. This AGN is invisible at optical and near-infrared wavelengths because of the dense dust galaxy surrounding it, evidence for which includes the deep 9.7 m silicate absorption feature (Tran et al., 2001; Spoon et al., 2004). However, the AGN is confirmed by the detection of a 6.7 keV FeK line (Fe XXV) with a large equivalent width, indicative of reflected light from a Compton thick AGN (Nandra & Iwasawa, 2007).
In a sensitive 12-hr ATCA synthesis observation of 00183 at 4.8 GHz, Roy et al. (unpublished data cited by Roy & Norris, 1997) found an unresolved core of 108 mJy and no lobes brighter than 30 K (). The core has an extraordinary radio luminosity of W Hz-1, typical of powerful radio galaxies, which makes the object times more radio-loud than expected for the normal radio-FIR correlation. To produce this radio luminosity using supernovae, as in Arp 220, would require an implausible 20000 luminous radio supernovae (i.e. similar to RSN 1986J) radiating simultaneously.
However, the ultimate distinction between radio-loud AGN and star formation is best achieved using Very Long Baseline Interferometry (VLBI). While clumps of radio supernovae can emulate low-luminosity AGN, high luminosity VLBI detections are nearly always produced by AGN (Kewley et al., 2000). Here we present the results of a VLBI experiment to probe the radio core of 00183.
2 Observations and Data Reduction
The VLBI observations took place (project code V024a) over a period of fifteen hours on 11 August 2000. Six radio telescopes were used for this experiment: the 64 m antenna of the Australia Telescope National Facility (ATNF) near Parkes; the Tidbinbilla 70-m DSS-43 Deep Space Network antenna at the Canberra Deep Space Centre, a phased array at the ATNF Australia Telescope Compact Array (ATCA) near Narrabri; the ATNF Mopra 22 m antenna near Coonabarabran; and the University of Tasmania’s 26 m antenna near Hobart and their 32 m antenna at Ceduna. The Narrabri phased array consisted of five 22 m antennas of the Australia Telescope Compact Array configured in a compact (EW750a) configuration, giving a collecting area equivalent to a 49 m diameter antenna. The Hartebeestehoek antenna in South Africa also took part in the observations, but no reliable data were obtained using that antenna, and so the Hartebeestehoek data have been omitted from the data reduction. Observing scans were centred on the nucleus of IRAS F00183-7111 (; [J2000]) which doubled as a phase reference source. Hourly scans of IRAS F00183-7111 were made every two hours at 13 cm.
The observation used the S2 recording system (Cannon et al., 1997) to record MHz bands (digitally filtered 2 bit samples). Both bands were upper side band and right circular polarisation. The frequency ranges used for the two bands were 2252 - 2268 MHz and 2268 - 2284 MHz. The recorded data were correlated using the ATNF Long Baseline Array (LBA) processor at ATNF headquarters in Sydney (Wilson et al., 1992) with the nominal system temperatures applied for each antenna. The data were correlated using an integration time of 5 seconds and with 32 frequency channels across each 16 MHz band (channel widths of 0.5 MHz).
The correlated data were imported into the AIPS111The Astronomical Image Processing System (AIPS) was developed and is maintained by the National Radio Astronomy Observatory, which is operated by Associated Universities, Inc., under co-operative agreement with the National Science Foundation package for initial processing. The data were fringe-fit (AIPS task FRING) using a one minute solution interval, finding independent solutions for each of the 16 MHz bands.
The fringe-fitting solutions were applied to the data and the resulting visibilities exported into DIFMAP (Shepherd, Pearson, & Taylor, 1994) for further calibration and imaging. The large-scale structure of the source was modelled in space with two Gaussian components and the smaller-scale structure with two delta functions. Natural weighting was used to maximise sensitivity and to accentuate the larger-scale structure of the source. Several iterations of model-fitting and phase self-calibration were executed until the modelled and observed visibilities converged. In the final iteration, amplitude self-calibration was performed with a solution period of 10 minutes. A one sigma rms noise of 90 beam-1 was achieved, closely matching the theoretical thermal noise of the observation222Estimated with the ATNF VLBI sensitivity calculator: http://www.atnf.csiro.au/vlbi/calculator. Errors of % are listed due to uncertainties in the absolute flux density scale for Southern Hemisphere VLBI (Reynolds, 1994).
In addition, ATCA data on 00183 were taken from the ATCA archive and reprocessed to yield a flux density at a number of frequencies. These, together with radio measurements from the literature, are listed in Table 1, and are used to produce the radio spectrum shown in Fig. 4.
3 Results
The resulting VLBI image is shown in Figure 1.
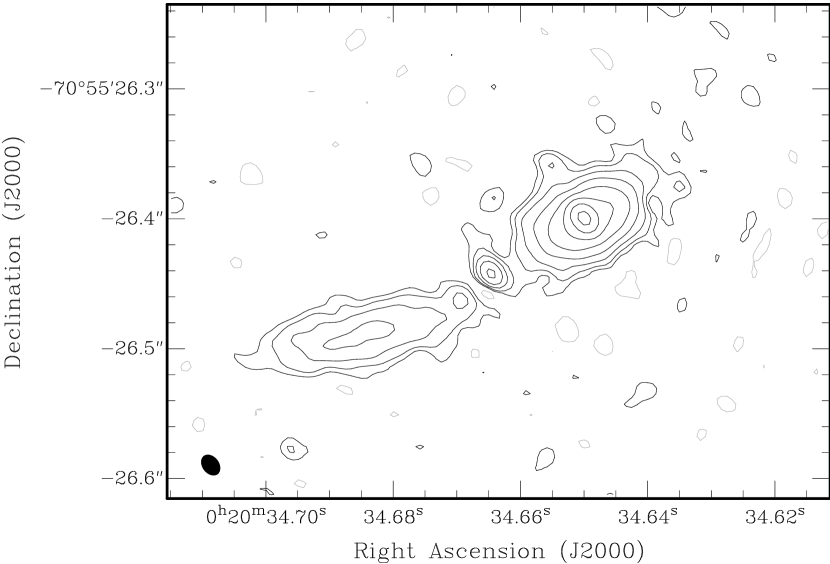
The VLBI image shows the classical double-lobed morphology similar to that of a classical radio galaxy, but on a scale (1.7 kpc long) that is several orders of magnitude smaller, and therefore indicative of a Compact Steep Spectrum (CSS) source (O’Dea, 1998; Randall et al., 2011).
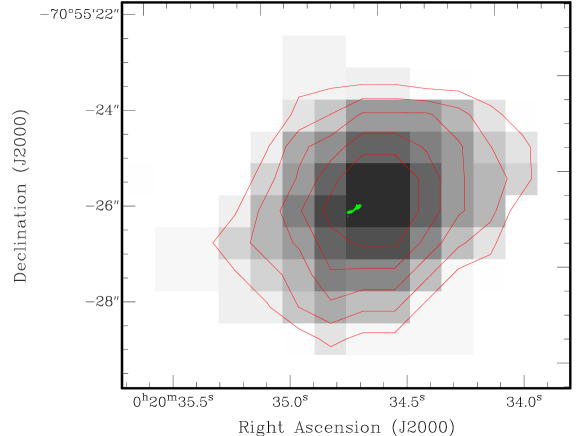
The jet is approximately in the same position angle as the extensions to the optical and infrared images shown in Figs. 2 and 3, but higher-resolution images are needed to see whether this alignment is significant. Drake et al. (2004) present a deeper R-band image showing an additional component to the east, and there is marginal evidence for soft X-ray emission to the east of the nucleus (Nandra & Iwasawa, 2007).
The measured integrated flux density of the VLBI image (178 mJy) is close to the interpolated flux density (192 mJy) derived by assuming a constant spectral index between the 4.8 GHz measurement by Roy & Norris (1997) and the 843 MHz measurement by Mauch et al. (2003). Since Roy & Norris (1997) also detected no extended emission, we surmise that the flux calibration scale is likely to be approximately correct, and that essentially all the flux from the source is contained within the image shown in Fig.1.
We note that the mid-point of the VLBI source does not fall on the peak, but slightly to the East of it, in a gap between the main peak and a subsidiary peak at the base of the Eastern jet. While it is tempting to speculate that these two peaks might represent the nuclei of the two galaxies that merged to form this ULIRG, it is also likely that the Eastern peak is simply a knot in the jet, and that the source is asymmetrical. Higher-resolution, higher-dynamic range observations will be necessary to confirm this.
4 The Evolutionary State of 00183
4.1 AGN or Starburst?
The literature contains conflicting evidence as to whether the radio emission from 00183 is primarily generated by star formation or an AGN.
On one hand, 00183 is a classical ULIRG, and ULIRGs are generally assumed to be predominantly powered by starburst activity. Its infrared spectrum lacks the lines (7.65 m [NeVI], and 14.32 & 24.32 m [NeV]) characteristic of an AGN (Spoon et al., 2009). It also has an inferred molecular gas mass M⊙(Norris et al., 2011), and such high molecular masses are generally found only in vigorous star-forming galaxies. Furthermore, the strength of the 11.2 m PAH feature implies an energetic starburst that may contribute up to 30% of the bolometric luminosity of the source (Spoon et al., 2004).
On the other hand, the radio luminosity of 00183 is W Hz-1, typical of powerful radio galaxies, and placing it roughly on the break between Fanaroff-Riley Type I and Type II galaxies (Martinez-Sansigre et al., 2006). As discussed in §1, this radio luminosity would require a physically unrealistic number of radio supernovae to produce it. Furthermore, the radio-infrared ratio of this object is times higher than expected for a star-forming galaxy, based on the canonical radio-FIR correlation (van der Kruit, 1971; Helou & Bicay, 1993; de Jong et al., 1985; Condon, 1992; Mao et al., 2011).
For these and other reasons, Roy & Norris (1997) and Spoon et al. (2009) argue that 00183 is powered by an AGN, which is obscured by a thick veil of dust, so that optical and near-IR observations see only the star-formation activity on the outside surface of the galaxy.
Figure 1 provides clinching evidence for this argument. The morphology of the radio source in 00183 is clearly that of a standard core+jet radio-loud AGN.
4.2 Quasar mode or radio mode?
00183 is an extremely luminous ULIRG with vigorous star formation, and contains a radio-loud AGN at its centre. Such ULIRGs appear to be advanced mergers of gas-rich spirals, caught after their first peri-passage (Toomre & Toomre, 1972; Sanders et al., 1988; Veilleux et al., 2002). The leading merger scenario (Sanders et al., 1988) predicts ULIRGs to evolve into dusty quasars before settling down as moderate mass ellipticals (Dasyra et al., 2006a, b). The above scenario is largely in agreement with merger simulations (e.g. Di Matteo et al., 2005; Hopkins et al., 2005), which show the supermassive black hole growing by accretion, becoming a proto-quasar. It then sheds its obscuring cocoon, deposited by the merger, through outflows driven by powerful quasar winds (Balsara & Krolick, 1993). The central regions will eventually be cleared of fuel, starving both the AGN and any star forming regions in the bulge, and activity will cease.
This scenario is broadly consistent with the “quasar-mode”/“radio-mode” model (Best, 2006; Croton et al., 2006; Hardcastle et al., 2007), in which the two black holes of the merging galaxies grow both through coalescence and through the accretion of cold disc gas from the host galaxies, accompanied by vigorous starburst activity in the cool gas. In this efficient quasar-mode (or cold-mode) accretion, the infall of cold gas results in an accretion disk within a hot broad-line region, producing a rapid growth of the black hole mass. Further out, the accretion disk extends into a dusty torus, while above and below the torus is the narrow-line region.
During the quasar mode accretion, the unified model (e.g. Antonucci, 1993; Barthel, 1989) explains the differences between broad-line (e.g. quasars) and narrow-line objects (e.g. narrow-line radio galaxies) in terms of orientation of the line of site relative to the torus. A radio-loud quasar is only seen as a quasar if it is seen face-on; otherwise the nucleus is obscured by the torus and it classified as a radio galaxy. However, unified models do not explain the difference between radio-loud and radio-quiet objects. The factors that cause a black hole to become radio-loud or radio-quiet are currently unclear, but may include black hole mass (Best, 2006), black hole spin (Sikora et al., 2007), magnetic field (Ye & Wang, 2005), merger history (Wilson & Colbert, 1995) or a combination of these factors.
Also missing from this description is the merger status of the two original black holes. The timescale for the black hole merger is extremely uncertain (e.g. Komossa, 2003; Wilson & Colbert, 1995; Khan et al., 2011; Preto et al., 2011; Burke-Spolaor, 2011) and so it is not clear at what stage of the above process the black holes merge, nor what the large-scale effect, if any, of that merger will be. We note a possible secondary peak discussed in §3, but defer further speculation until we have a higher resolution, higher dynamic-range, VLBI image.
Eventually enough energy is deposited into the cool inflowing gas, both from radio jets and star formation, to heat and disrupt the gas, resulting in the cessation of star-forming activity and a much less efficient accretion mode known as radio-mode or hot-mode accretion. The end product of this process is an elliptical galaxy, with little or no star formation, whose central black hole slowly accretes the hot interstellar medium.
00183 appears to be a rare example of an object caught at an early phase of the process of forming a quasar, in the brief period after the merging starburst, as the black hole ramps up to “quasar mode” activity. The radio source has already grown to a luminosity W Hz-1 (Roy & Norris, 1997).
A parallel, observational, description is given by Spoon et al. (2007) who propose an evolutionary scenario in which 00183 (located in their class ”2A”) is in a short-lived evolutionary transition from fully obscured buried nuclei to an AGN with a clumpy torus geometry.
4.3 PRONGS
Norris et al. (2006) identified a class of galaxies, subsequently christened PRONGS (Powerful Radio Objects Nested in Galaxies with Star-formation) by Mao et al. (2010), that consist of a radio-loud AGN buried within a galaxy that appears at optical/infrared wavelengths as a star-forming galaxy. Although AGNs are widely found within star-forming galaxies (e.g. Seyfert galaxies), such AGNs are relatively weak ( W Hz-1), three orders of magnitude weaker than PRONGS. Furthermore, Seyfert galaxies typically fall on the far-infrared-radio correlation (FRC: Roy et al., 1998) whereas 00183 and other PRONGS are typically 10 times too radio-luminous to follow the FRC.
PRONGS are rare in the local Universe, with only two known examples (NGC 612 & 0313-192: Ekers et al., 1978; Emonts et al., 2008; Ledlow et al., 2001; Keel et al., 2006) but seem to be increasingly common at high redshifts, with identified by Mao et al. in the ATLAS survey of seven square degrees (Norris et al., 2006; Middelberg et al., 2008). The PRONGS studied so far are smaller (50 kpc to 200 kpc) than standard radio galaxies, which range from hundreds of kpc to 4.5 Mpc(Schilizzi et al., 2001), suggesting that they may be either young or frustrated radio-loud galaxies.
00183 is clearly an extreme example of the class of PRONGS. If, as Mao et al. (2010) suggest, PRONGS are an early evolutionary stage of radio-loud galaxies, then 00183 may represent a short-lived extreme phase at the start of this process.
4.4 GPS and CSS galaxies
Gigahertz-Peaked Spectrum (GPS) and Compact Steep Spectrum (CSS) sources are similar to PRONGS in that they have a very small but powerful radio AGN at their centre. GPS sources are typically 1 kpc in size, and are widely thought to mark the earliest evolutionary phase of large-scale radio sources (Polatidis & Conway, 2003; Tinti & De Zotti, 2006; Fanti, 2009). CSS sources are one to several tens of kpc in size (O’Dea, 1998; Snellen et al., 1998; Randall et al., 2011) and represent an intermediate stage between GPS sources and the largest radio sources, FRI/II galaxies (Snellen et al., 1999). PRONGS differ from CSS/GPS sources in that they are immersed in a star-forming galaxy, whereas most CSS/GPS sources are hosted by luminous red galaxies or quasars (O’Dea, 1998; Randall et al., 2011).
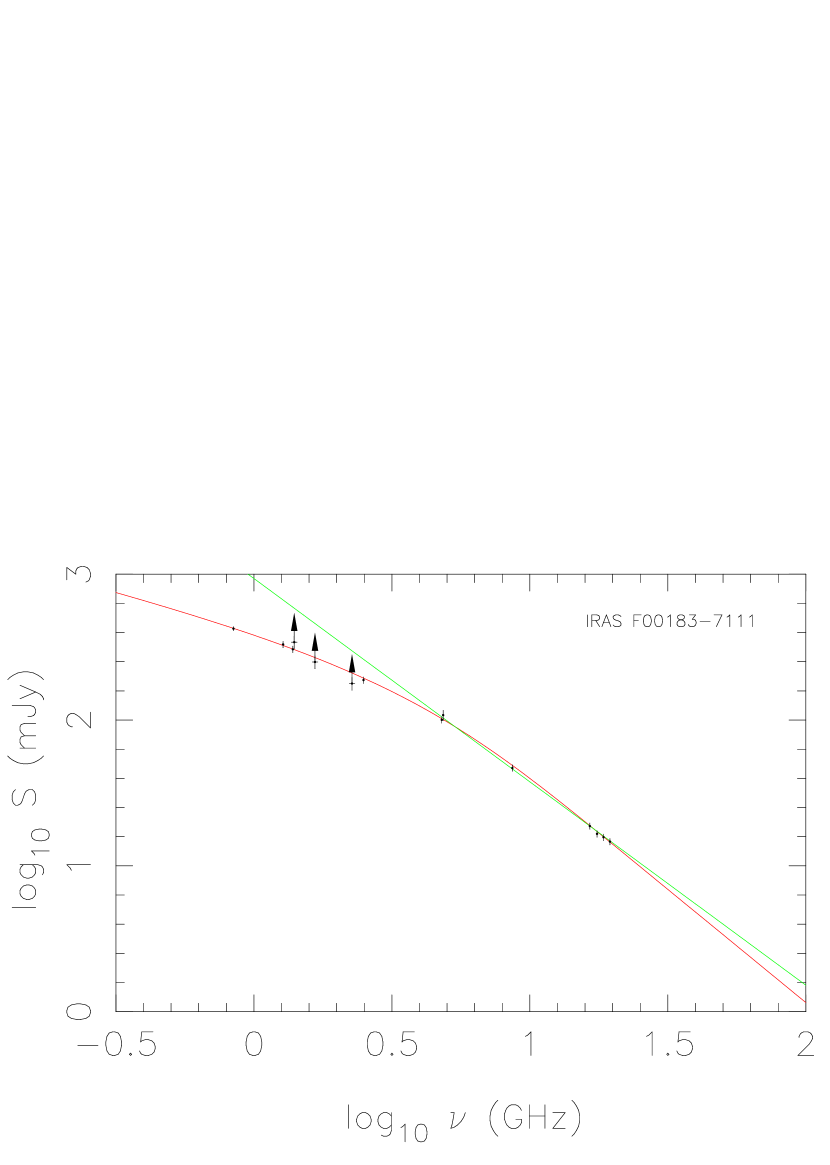
CSS sources have a steep () spectral index across the GHz frequency range, while GPS sources reach a maximum brightness at a few GHz, with the spectral index becoming positive below the maximum (Randall et al., 2011). The positive spectral index at low frequencies is thought to be caused by synchrotron self absorption, although free-free absorption may also be significant (Fanti, 2009). Fig. 4 shows the spectral energy distribution (SED) of 00183. 00183 is intermediate between these two classes, with the spectrum noticeably flattening at low frequencies without actually reaching a maximum.
We can estimate whether free-free absorption could be causing the observed turnover in this source. We assume a constant synchrotron spectral index (i.e. the value at high frequencies), and a flux density of 14.7 mJy at 19.513 GHz, which implies an un-absorbed synchrotron flux density of 1120 mJy at 843 MHz. If the turnover is caused by free-free absorption by the surrounding starburst, modelled as a foreground slab of ionised gas, then the slab has an opacity of 1 at 843 MHz. Assuming an electron temperature of 8000K, and an electron density of to cm-3 (Anantharamaiah et al., 1997), the required path length to produce the observed spectral flattening is 1.5 to 15 pc, with a covering factor of unity. This is reasonable given the intense starburst, and demonstrates that, at least in this source, the turnover can easily be caused by free-free absorption in the surrounding starburst.
In summary, the radio luminosity, size (1.7 kpc), and spectral shape mark 00183 as similar to CSS and GPS sources, but differing in that it is hosted by a star-forming ULIRG. According to the standard CSS/GPS scenario (Randall et al., 2011), the radio jets have just turned on, and are now boring their way through the dense dust and gas. 00183 is surrounded by an enormous mass of cold molecular gas ( M⊙) (Norris et al., 2011) so clearly the jets have a difficult task ahead of them. They will eventually emerge as fully-fledged giant radio lobes, at which point 00183 will probably become a classical FRII galaxy or quasar.
5 Conclusion
Our VLBI image of the extreme ULIRG F00183-7111 shows a classical core-jet radio-loud ( W Hz-1 ) AGN, which has the luminosity and morphology of an FRII galaxy, except that the total length of the source is only 1.7 kpc. This core is surrounded by a vigorous starburst accompanied by some M⊙ of molecular gas. The many magnitudes of dust extinction accompanying this starburst totally obscure any sign of this AGN at optical or infrared wavelengths.
We have placed this source in an evolutionary sequence defined by the standard quasar-mode/radio-mode model, and find that it represents the initial stage of the formation of a quasar. It is in the earliest throes of quasar-mode accretion, with the powerful radio jets still confined by the dense cool gas from the galaxies that merged to form this system.
In this respect it is very similar to the classical CSS/GPS sources, differing only in that its host galaxy appears to be at an earlier stage of post-merger evolution than most CSS/GPS hosts. Eventually the radio jets will drill their way out of the gas, at the same time heating and disrupting the gas. As a result, the current vigorous burst of star formation will be extinguished, marking the transition of this source from a star-forming ULIRG with a “quasar-mode” AGN at its centre to a powerful radio-loud quasar.
Acknowledgments
We thank the Australian LBA team whose continuing efforts make observations like this possible, and especially the University of Tasmania for making the Hobart and Ceduna antennas available, and to the CDSCC for making the Tidbinbilla antenna available. We also wish to thank Associate Professor Hiroshi Imai (Kagoshima University) for kindly giving us access to 1 cm ATCA data for IRAS F00183-7111, and Sarah Burke-Spolaor for helpful comments on black hole mergers.
The Australia Telescope is funded by the Commonwealth of Australia for operation as a National Facility managed by CSIRO. This research has made use of the NASA/IPAC Extragalactic Database (NED) which is operated by the Jet Propulsion Laboratory, California Institute of Technology, under contract with the National Aeronautics and Space Administration.
| Date | Obs. | Resolution | Ref. | ||
| (GHz) | (arcsec) | (mJy) | |||
| 1997 - 2003 | SUMMS | 0.843 | 45 | 423.7 | Mauch et al. (2003) |
| 08 Feb 2004 | ATCA | 1.276 | 6.7 | 330 | This paper |
| 25 Jan 2002 - 31 Jan 2002 | ATCA | 1.384 | 7 | 306 | Drake et al. (2004) |
| 20 Apr 2001 - 26 Apr 2002 | LBA | 1.4 | 341.8 | Drake et al. (2004) | |
| PTI | 1.665 | 0.1 | 250 | Norris et al. (1988b) | |
| 11 Aug 2000 | LBA | 2.268 | 0.015 | 178 | This paper |
| 25 Jan 2002 - 31 Jan 2002 | ATCA | 2.496 | 4 | 188 | Drake et al. (2004) |
| 05 Jan 1998 - 28 Feb 1998 | ATCA | 4.794 | 2 | 100 | Drake et al. (2004) |
| PMN | 4.85 | 252 | 108 | Wright et al. (1994) | |
| 05 Jan 1998 - 28 Feb 1998 | ATCA | 8.64 | 1 | 46.9 | Drake et al. (2004) |
| 13 Jun 2009 | ATCA | 16.489 | 18.7 | This paper | |
| 13 Jun 2009 | ATCA | 17.513 | 16.6 | This paper | |
| 13 Jun 2009 | ATCA | 18.489 | 15.7 | This paper | |
| 13 Jun 2009 | ATCA | 19.513 | 14.7 | This paper | |
| 11 Jul 2009 | ATCA | 86.84 | 28 | 3.4 | Norris et al. (2011) |
References
- Aaronson & Olszewski (1984) Aaronson, M., & Olszewski, E. W., 1984, Nature, 309, 414
- Afonso et al. (2006) Afonso, J., Mobasher, B., Koekemoer, A., Norris, R. P., & Cram, L., 2006, AJ, 131, 1216
- Allen, Roche, & Norris (1985) Allen, D. A, Roche, P. F. & Norris, R. P., 1985, MNRAS, 213, 67P
- Anantharamaiah et al. (1997) Anantharamaiah et al. 1997, ApJ, 482, 186
- Antonucci (1993) Antonucci, R. 1993, Ann. Rev. Astr. Ap., 31, 473
- Armus, Heckman, & Miley (1987) Armus, L., Heckman, T., & Miley, G., 1987, AJ, 94, 831
- Balsara & Krolick (1993) Balsara, D. S., & Krolik, J. H. 1993, ApJ, 402, 109
- Barthel (1989) Barthel, P. D. 1989, Ap. J., 336, 606
- Best (2006) Best, P. N., Kaiser, C. R., Heckman, T. M., & Kauffmann, G. 2006, MNRAS, 368, L67
- Blain et al. (2002) Blain, A. W., & Phillips, T. G. 2002, MNRAS, 333, 222
- Burke-Spolaor (2011) Burke-Spolaor, S. 2011, MNRAS, 410, 2113
- Cannon et al. (1997) Cannon, W.M., Baer, D., Feil, G., Feir, B., Newby, P., Novikov, A., Dewdney, P., Carlson, B., Petrachenko, W.T., Popelar, J., Mathieu,P., & Wietfeldt, R.D., 1997, Vistas in Astronomy, 41, 297
- Condon (1992) Condon J. J., 1992, ARA&A, 30, 575
- Croton et al. (2006) Croton, D. J., et al. 2006, MNRAS, 365, 11
- Dasyra et al. (2006a) Dasyra, K. M., et al. 2006, ApJ, 638, 745
- Dasyra et al. (2006b) Dasyra, K. M., et al. 2006, ApJ, 651, 835
- de Jong et al. (1985) de Jong T., Klein U., Wielebinski R., Wunderlich E., 1985, A&A, 147, L6
- Di Matteo et al. (2005) Di Matteo, T., Springel, V., & Hernquist, L. 2005, Nature, 433, 604
- Deller et al. (2007) Deller, A. T., Tingay, S. J., Bailes, M., & West, C. 2007, PASP, 119, 318
- Drake et al. (2003) Drake, C. L., McGregor, P. J., Dopita, M. A., & van Breugel, W. J. M. 2003, AJ, 126, 2237
- Drake et al. (2004) Drake, C. L., McGregor, P. J., & Dopita, M. A. 2004, AJ, 128, 955
- Drake et al. (2004) Drake, C. L., Bicknell, G. V., McGregor, P. J., & Dopita, M. A. 2004, AJ, 128, 969
- Ekers et al. (1978) Ekers, R. D., Goss, W. M., Kotanyi, C. G., & Skellern, D. J. 1978, AAP, 69, L21
- Fanti (2009) Fanti C., 2009, Astron. Nachr., 330, 120
- Hardcastle et al. (2007) Hardcastle, M. J., Evans, D. A., & Croston, J. H. 2007, MNRAS, 376, 1849
- Emonts et al. (2008) Emonts, B. H. C., Morganti, R., Oosterloo, T. A., Holt, J., Tadhunter, C. N., van der Hulst, J. M., Ojha, R., & Sadler, E. M. 2008, MNRAS, 387, 197
- Genzel et al. (1998) Genzel, R., et al. 1998, ApJ, 498, 579
- Gooch (1996) Gooch, R., 1996, Astronomical Data Analysis Software and Systems V, 101, 80
- Hao et al. (2007) Hao, L., Weedman, D. W., Spoon, H. W. W., Marshall, J. A., Levenson, N. A., Elitzur, M., & Houck, J. R. 2007, ApJL, 655, L77
- Heckman, Armus, & Miley (1990) Heckman, T., Armus, L., & Miley, G., 1990, ApJS, 74, 833
- Helou & Bicay (1993) Helou G., Bicay M. D., 1993, ApJ, 415, 93
- Hopkins et al. (2005) Hopkins,2005,TODO
- Houck et al. (1985) Houck, J. R., Schneider, D. P., Danielson, G. E., Neugebauer, G., Soifer, B. T., Beichman, C. A., & Lonsdale, C. J. 1985, ApJL, 290, L5
- Keel et al. (2006) Keel, W. C., White, R. E., III, Owen, F. N., & Ledlow, M. J. 2006, AJ, 132, 2233
- Kewley et al. (1999) Kewley, L. J., Heisler, C. A., Dopita, M. A., & Norris, R. P. 1999, APSS, 266, 131
- Kewley et al. (2000) Kewley, L. J., Heisler, C. A., Dopita, M. A., Sutherland, R., Norris, R. P., Reynolds, J., & Lumsden, S., 2000, ApJ, 530, 704
- Khan et al. (2011) Khan, F. M., Just, A., & Merritt, D. 2011, Ap. J., 732, 89
- Komossa (2003) Komossa, S. 2003, The Astrophysics of Gravitational Wave Sources, 686, 161
- Le Floc’h et al. (2005) Le Floc’h,2005,TODO
- Ledlow et al. (2001) Ledlow, M. J., Owen, F. N., Yun, M. S., & Hill, J. M. 2001, ApJ, 552, 120
- Lonsdale et al. (2003) Lonsdale, C. J., et al., 2003, PASP, 115, 897
- Lonsdale et al. (2006) Lonsdale,2006,TODO
- Lutz et al. (2004) Lutz, D., Sturm, E., Genzel, R., Spoon, H. W. W., & Stacey, G. J. 2004, AAP, 426, L5
- Mao et al. (2010) Mao, M. Y., Norris, R. P., Sharp, R., & Lovell, J. E. J. 2010, IAU Symposium, 267, 119
- Mao et al. (2011) Mao, M. Y., Huynh, M. T., Norris, R. P., Dickinson, M., Frayer, D., Helou, G., & Monkiewicz, J. A. 2011, Ap. J., 731, 79
- Martinez-Sansigre et al. (2006) Martinez-Sansigre, A., Rawlings, S., Garn, T., Green, D. A., Alexander, P., Klöckner, H.-R., & Riley, J. M. 2006, MNRAS, 373, L80
- Mauch et al. (2003) Mauch, T., Murphy, T., Buttery, H. J., Curran, J., Hunstead, R. W., Piestrzynski, B., Robertson, J. G., & Sadler, E. M., 2003, MNRAS, 342, 1117
- Middelberg et al. (2008) Middelberg, E., et al. 2008, A. J., 135, 1276
- Nandra & Iwasawa (2007) Nandra, K., & Iwasawa, K. 2007, MNRAS, 382, L1
- Norris (1988a) Norris, R. P., 1988, MNRAS, 230, 345
- Norris et al. (1988b) Norris, R. P., Kesteven, M.J., Allen, D.A., & Troupe, E., 1988, MNRAS, 234, 51
- Norris et al. (2006) Norris, R. P., et al., 2006, AJ, 132, 2409
- Norris et al. (2007) Norris, R. P., Middelberg, E., & Boyle, B. J. 2007, Deepest Astronomical Surveys, 380, 229
- Norris et al. (2011) Norris, R. P., Emonts, B., Feain, I., Lenc, E., Mao, M. Y., Randall, K., & Sharp, R. G., 2011, MNRAS, in preparation.
- O’Dea (1998) O’Dea, C. P. 1998, PASP, 110, 493
- O’Dowd et al. (2002) O’Dowd, M., Urry, C. M., & Scarpa, R., 2002, ApJ, 580, 96
- Polatidis & Conway (2003) Polatidis A., & Conway A., 2003, PASA, 20, 69
- Preto et al. (2011) Preto, M., Berentzen, I., Berczik, P., & Spurzem, R. 2011, Ap. J. (Letters), 732, L26
- Randall et al. (2011) Randall, K. E., Hopkins, A. M., Norris, R. P., & Edwards, P. G. 2011, MNRAS, in press, arXiv:1105.4676
- Reynolds (1994) Reynolds, J.E., 1994, A Revised Flux Scale for the AT Compact Array (ATNF Tech. Memo 39.3/040) (Epping: Australia Telescope National Facility)
- Rigopoulou et al. (1999) Rigopoulou, D., Spoon, H. W. W., Genzel, R., Lutz, D., Moorwood, A. F. M., & Tran, Q. D. 1999, AJ, 118, 2625
- Risaliti et al. (2010) Risaliti, G., Imanishi, M., & Sani, E. 2010, MNRAS, 401, 197
- Roy & Norris (1997) Roy, A. L. & Norris, R. P., 1997, MNRAS, 289, 824
- Roy et al. (1998) Roy, A. L., Norris, R. P., Kesteven, M. J., Troup, E. R., & Reynolds, J. E. 1998, MNRAS, 301, 1019
- Sanders et al. (1988) Sanders, D. B., Soifer, B. T., Elias, J. H., Madore, B. F., Matthews, K., Neugebauer, G., & Scoville, N. Z. 1988, ApJ, 325, 74
- Schilizzi et al. (2001) Schilizzi, R. T., et al. 2001, Astr. Ap., 368, 398
- Shepherd, Pearson, & Taylor (1994) Shepherd, M. C., Pearson, T. J., & Taylor, G. B., 1994, BAAS, 26, 987
- Sikora et al. (2007) Sikora, M., Stawarz, Ł., & Lasota, J.-P. 2007, Ap. J., 658, 815
- Smith et al. (1998) Smith, H. E., Lonsdale, C. J., Lonsdale, C. J., & Diamond, P. J., 1998, ApJ, 493, L17
- Snellen et al. (1998) Snellen, I. A. G., Schilizzi, R. T., de Bruyn, A. G., Miley, G. K., Rengelink, R. B., Ro”ttgering, H. J., & Bremer, M. N. 1998, AAPS, 131, 435
- Snellen et al. (1999) Snellen I. A. G., Schilizzi R. T., Miley G. K., Bremer M. N., Ro”ttgering H. J. A., van Langevelde H. J., 1999, NewAR, 43, 675
- Soifer et al. (1984) Soifer, B. T., et al. 1984, ApJL, 278, L71
- Spoon et al. (2004) Spoon, H. W. W., et al. 2004, ApJS, 154, 184
- Spoon et al. (2007) Spoon, H. W. W., Marshall, J. A., Houck, J. R., Elitzur, M., Hao, L., Armus, L., Brandl, B. R., & Charmandaris, V. 2007, Ap. J. (Letters), 654, L49
- Spoon et al. (2009) Spoon, H. W. W., Armus, L., Marshall, J. A., Bernard-Salas, J., Farrah, D., Charmandaris, V., & Kent, B. R. 2009, ApJ, 693, 1223
- Spoon & Holt (2009) Spoon, H. W. W., & Holt, J. 2009, Ap. J. (Letters), 702, L42
- Tinti & De Zotti (2006) Tinti S., De Zotti G., 2006, Astr. Ap., 445, 889
- Toomre & Toomre (1972) Toomre, A., & Toomre, J. 1972, ApJ, 178, 623
- Tran et al. (2001) Tran, Q. D., et al. 2001, ApJ, 552, 527
- Ulvestad et al. (1999) Ulvestad, J. S., Wrobel, J. M., Roy, A. L., Wilson, A. S., Falcke, H., & Krichbaum, T. P. 1999, ApJL, 517, L81
- van der Kruit (1971) van der Kruit P. C., 1971, A&A, 15, 110
- Veilleux et al. (2002) Veilleux, S., Kim, D.-C., & Sanders, D. B. 2002, ApJS, 143, 315
- Veilleux et al. (2009) Veilleux, S., et al. 2009, Ap. J. Suppl., 182, 628
- Wilman et al. (2008) Wilman, R. J., et al. 2008, MNRAS, 388, 1335
- Wilson et al. (1992) Wilson, W. E., Davis, E. R., Loone, D. G., & Brown, D. R., 1992, Journal of Electrical and Electronics Engineering, 12, 187
- Wilson & Colbert (1995) Wilson, A. S., & Colbert, E. J. M. 1995, Ap. J., 438, 62
- Wright et al. (1994) Wright, A. E., Griffith, M. R., Burke, B. F., & Ekers, R. D. 1994, APJS, 91, 111
- Wright (2006) Wright, E. L. 2006, PASP, 118, 1711
- Ye & Wang (2005) Ye, Y.-C., & Wang, D.-X. 2005, MNRAS, 357, 1155