Height structure of X-ray, EUV and white-light emission in a solar flare
Abstract
Context. The bulk of solar flare emission originates from very compact sources located in the lower solar atmosphere and seen in various wavelength ranges: near optical, UV, EUV, soft and hard X-rays, and gamma-ray emission, yet very few spatially resolved imaging observations to determine the structure of these compact regions exist.
Aims. We investigate the above-the-photosphere heights of hard X-ray (HXR), EUV and white-light (6173 ) continuum sources in the low atmosphere and the corresponding densities at these heights. Considering collisional transport of solar energetic electrons we also determine where and how much energy is deposited and compare these values with the emissions observed in HXR, EUV and continuum.
Methods. Simultaneous EUV/continuum images from AIA/HMI on-board SDO and HXR RHESSI images are compared to study a well observed gamma-ray limb flare. Using RHESSI X-ray visibilities we determine the height of the HXR sources as a function of energy above the photosphere. Co-aligning AIA/SDO and HMI/SDO images with RHESSI we infer, for the first time, the heights and characteristic densities of HXR, EUV and continuum (white-light) sources in the flaring footpoint of the loop.
Results. 35-100 keV HXR sources are found at heights between 1.7 and 0.8 Mm above the photosphere, below the 6173 continuum emission which appears at heights Mm, and the peak of EUV emission originating near 3 Mm.
Conclusions. The EUV emission locations are consistent with energy deposition from low energy electrons of keV occurring in the top layers of the fully ionized chromosphere/low corona and not by keV electrons that produce HXR footpoints in the lower neutral chromosphere. The maximum of white-light continuum emission appears between the HXR and EUV emission, presumably in the transition between ionized and neutral atmospheres suggesting free-bound and free-free continuum emission. We note that the energy deposited by low energy electrons is sufficient to explain the energetics of optical and UV emissions.
Key Words.:
Sun: flares – Sun: X-rays, gamma-rays – Sun: radio radiation – Sun: UV radiation – Acceleration of particles1 Introduction
Solar flare emission is now observed virtually over the whole electromagnetic spectrum from radio frequencies as low as MHz up to photon energies as high as a few hundred MeV. The bulk of this emission originates from the chromosphere, a small part of the solar atmosphere which is narrow in height and much smaller than the size of a flaring region. Being only about Mm () across, the chromosphere presents a formidable observational challenge in both angular and temporal resolution especially for transient phenomena like solar flares. During solar flares large numbers of energetic electrons are accelerated in the solar corona and effectively release their energy in the dense chromosphere. These energetic particles are believed to be responsible (although not always directly) for HXR, EUV, continuum ”white-light” (WL), infrared and radio emissions. On the basis of temporal correlation, the interconnection between these emissions was early realized (Najita & Orrall, 1970; Švestka, 1970). Due to the lack of height-resolving observations spectroscopic data have been mostly used to identify the structure of the emitting region (e.g. Canfield, 1974). Therefore, the actual mechanisms of WL emission and the relation to HXR emitting electrons is still subject of debate (Neidig, 1989; Neidig et al., 1993; Sylwester & Sylwester, 2000; Matthews et al., 2003; Potts et al., 2010; Watanabe et al., 2010; Kretzschmar, 2011). It is not even clear whether the emission is optically thick or thin or both. Thus the characteristic heights of continuum WL emission in various models are placed from the photosphere to the upper chromosphere. Observations supporting both (Fang & Ding, 1995; Xu et al., 2006), a photospheric origin (e.g. Boyer et al., 1985; Ding et al., 1999; Chen & Ding, 2006) presumably due to radiative back-warming, and generation of WL emission in the higher temperature regions of the upper chromosphere (e.g. Machado & Rust, 1974; Hudson, 1972) have been made. The major observational challenge here is to have simultaneous HXR, UV and WL images with sufficiently high angular resolution. The relative horizontal positions of HXR and WL flares have been investigated in detail and, although generally been found to agree (e.g. Krucker et al., 2011; Fletcher et al., 2007; Hudson et al., 2006; Metcalf et al., 2003), the uncertainty in the relative position was large due to limited absolute pointing accuracy of partial solar disk observations such as TRACE. Thus it was not possible to quantify the relative height of the sources above the photosphere in previous studies. With RHESSI (Lin et al., 2002) data, the height structure of HXR sources has become accessible for detailed observational studies (Aschwanden et al., 2002; Kontar et al., 2008; Kontar & Jeffrey, 2010; Battaglia & Kontar, 2011; Saint-Hilaire et al., 2010). These observations demonstrated that the higher energy HXR footpoints originate from the chromosphere from progressively lower heights, in good agreement with collisional downward propagation of energetic electrons (see Brown et al., 2002, for details). The newly available SDO continuum images from HMI (Wachter et al., 2011) and AIA EUV (Lemen et al., 2011) observations allow to scrutinize the spatial structure and more importantly the height structure of various emissions associated with HXR footpoints. In this paper we present the first spatially resolved simultaneous observations of HXR, EUV and WL emission from a footpoint of a solar limb flare observed with RHESSI, SDO/AIA and HMI. Using the recently developed hard X-ray visibility analysis technique (Hurford et al., 2002; Schmahl et al., 2007) we determine the characteristic heights for the different types of emission using the method presented by Battaglia & Kontar (2011); Kontar et al. (2010, 2008). The results are consistent with the EUV and continuum WL being produced above the HXR footpoints by lower energy electrons ( keV) and hence suggest not a photospheric but upper chromospheric origin of WL emission.
2 Height and density measurements in HXR and EUV
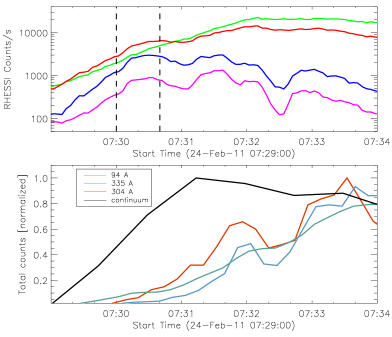
The GOES M3.5 limb flare happened on February 24th 2011 with three well-pronounced main HXR (above keV) peaks between 07:29 and 07:33 UT and an associated filament eruption to the south of the flaring site. Figure 1 (top) shows the RHESSI lightcurves in different energy bands of the thermal and non-thermal emission. The attenuator state was 1 during the main phase of the flare and the live-time was better than 90% during the whole period of the observations, hence making the effects of pulse pile-up negligible. The flare appeared in active region AR11163 and is well observed in enhanced EUV emission visible in all AIA filters, and also showed 6173 continuum emission observed by HMI. The continuum emission (with a maximum enhancement of % above the photospheric background) shows two footpoints and follows the X-ray time profile. Unfortunately, AIA images became saturated in most wavelengths before the soft X-ray peak (2nd HXR peak) of the flare. Because of this saturation, we focus the analysis on the time of the first HXR peak. During the time around 07:30:10 UT, AIA was not saturated in 94 , 193 , 304 and 335 filters near the location of the southern footpoint.
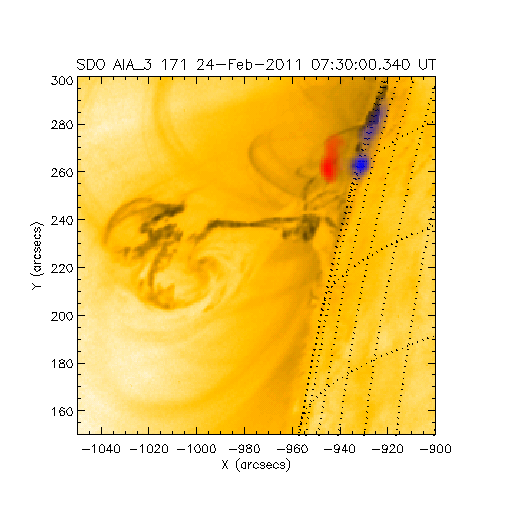
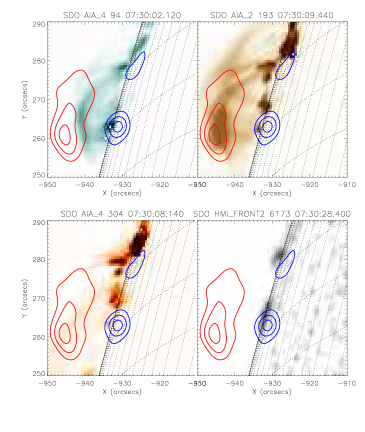
To study the flare related enhancement in EUV and continuum emissions the image from one minute before the analyzed time was subtracted. Figure 2 displays difference images in AIA 94, 193 and 304 wavelengths and the HMI continuum111Animated images of the flare are available online: http://www.astro.gla.ac.uk/users/mbattaglia/20110224_online_material/. For the RHESSI analysis a 40 second time interval at the first peak of the flare from 07:30:00 UT was chosen (see Fig. 1). The contours in Fig. 2 indicate the RHESSI emission between 07:30:00 and 07:30:40 UT at 50, 70 and 90 % of the maximum in CLEAN images (Hurford et al., 2002). The images show a coronal (SXR) source above the limb and two footpoints (HXR) sources (north and south). During the first peak the southern footpoint source was much more intense than the northern footpoint. Thus we focused the height-analysis on the southern footpoint. We note that in the subsequent peaks the northern footpoint reached the same intensity as the southern footpoint. The RHESSI spectrum suggests emission well beyond 200 keV into the -ray range. During the analyzed time interval, the HXR spectrum is well fitted with a thermal component and a single thick-target power-law with spectral index . The flare was also observed by Fermi/GBM (Meegan et al., 2009) and the corresponding spectrum from FERMI data was found virtually identical to the RHESSI spectrum. The time evolution of the EUV emission at the position of the southern HXR footpoint can be seen in Fig. 1 (bottom). The total flux in a region of 5 by 10 arcsec extent around the position of the southern HXR footpoint is shown.
Because of the limb location of the flare the height analysis is possible. However, SDO observations alone cannot infer the heights of the sources in different EUV wavelengths or for white-light emission. Here, utilizing RHESSI observations, we find the density structure of the chromosphere and importantly the reference height (projected radius of the point at the photospheric level beneath the HXR sources) as described by Battaglia & Kontar (2011) and Kontar et al. (2010, 2008). Following the method described by those authors we use visibility forward fitting to find the position of the southern footpoint as a function of HXR energy in several energy bands (30-40 keV, 40-55 keV, 55-80 keV, 80-130 keV). The energy bands were chosen large enough to guarantee good count statistics for reliable fits. Both the southern and the northern footpoint are fitted with circular Gaussians. This assures that the emission of the northern footpoint is properly accounted for, even if it is not intense enough to result in fit parameters with acceptable errors. The flare morphology was such that the radial direction (direction of electron propagation along the loop) can reasonably be seen as along the x-direction in the images (see Fig. 2). An exponential density profile (hydrostatic atmosphere at lower heights), , was fitted to the positions found by visibility forward fitting, where is the (constant) loop density, the photospheric density (Vernazza et al., 1981) which corresponds to , and is the height above the photosphere 222In this work we use a fit to the full expression for the HXR flux maximum and not the simplified version given by Eq. 7 of Brown et al. (2002). The latter is likely to underestimate the densities in a sharply changing chromosphere. See also Battaglia & Kontar (2011); Kontar et al. (2010, 2008). The loop density was assumed to be the same as the coronal source density determined from the emission measure given by the spectral fit and the size of the coronal source in RHESSI 6-12 keV images. Fitting the HXR energy-position relation with the above density model we find a scale height of km and a reference height for the radial distance between the solar disk center and the point under the footpoints at the photosphere of arcsec. The photospheric reference distance is used to find the absolute height of the EUV and WL sources above the photosphere. Using the HXR source size as the size of the magnetic flux tube, we selected a stripe along the x-direction of 5 arcsec width in the y-direction over the position of the southern RHESSI footpoint. At each horizontal distance , the AIA and HMI counts were summed over the y-direction. The height of the emission is simply the -position minus as found above. This is shown in Fig. 3. Proper co-alignment of the images is crucial for this study. The RHESSI disk center is known to better than 0.2 arcsec accuracy. Using SDO full disk images the disk center of AIA and HMI can be determined. This position of solar-disk center is found to deviate by only -0.39/0.67 arcsec in x/y direction that of RHESSI, which, although small, were taken into account for the co-alignment. The larger uncertainty is related with the roll-angle of SDO images (rotation around the disk center). To investigate the effect, the HMI image was rotated by degree relative to Sun center. This uncertainty translates to mostly -direction uncertainty of arcseconds and for the -direction for the limb event under study. For the height measurements of the EUV and HMI emissions relative to the RHESSI emission, we have taken this uncertainty into account and shown in Fig. 3. We find that the RHESSI sources at 35 - 100 keV originate from heights between 1.7 and 0.8 Mm. The WL emission peaks at 2.5 Mm, which is Mm above the 30 keV HXR emission, suggesting it originates from the upper chromosphere.
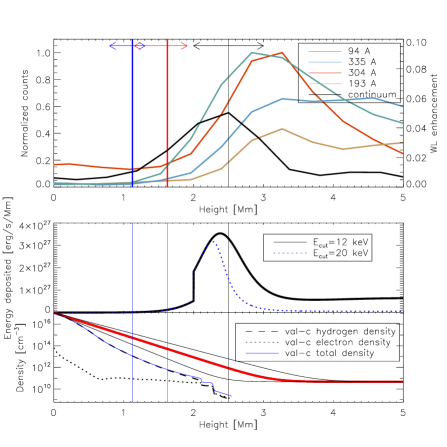
Using the density model found above and a power-law electron injection rate [electrons s-1 keV-1] found from the spatially integrated RHESSI X-ray spectrum, we can compute the energy deposition rate [ergs s-1 Mm-1] as a function of height (Brown, 1973),
| (1) |
where is the electron rate spectrum (Brown, 1971), with and the Coulomb logarithms for electron-neutral and electron-electron collisions, and and are the hydrogen and electron number densities respectively. The resulting energy deposition rate as a function of height given by Equation (1) is shown in Fig. 3 where we assumed a step change in ionization from fully ionized to neutral at a height of 2 Mm. As expected, the deposition rate is dependent on the low energy cut-off for the injected electron spectrum . From the thick target fit to the RHESSI spatially integrated HXR spectrum the cut-off energy is around keV and the spectral index =3.9. This leads to a total power of . However, the cut-off is generally unknown as the low energy part of X-ray spectrum is dominated by thermal emission, so lower cut-off values are possible and likely (e.g. Emslie, 2003; Hannah et al., 2009). However, even with keV, the energy deposited appears much larger than emitted in other wavelengths. For the southern footpoint, an enhancement of % over the total solar irradiance of over a source area of arcsec2 leads to a total power emitted of . The energy in the non-thermal electrons is therefore up to an order of magnitude larger than what is needed to power the WL emission, which often constitutes the bulk of flare emitted energy (Neidig, 1989). We note that the WL energetics obtained using 6173 continuum is found to be lower than using TRACE wavelengths near the 1700 continuum, and assuming black body emission to deal with the TRACE response (e.g. Fletcher et al., 2007), but close to the values reported by Neidig (1989) based on spectroscopy above 2500 . Indeed, various optical bands show different levels of enhancement during flares (Kretzschmar, 2011). In addition, the maximum of 6173 continuum is reached later in the flare, after the analyzed time interval.
3 Discussion and Conclusions
Our observations suggest that the WL emission originates from the upper chromosphere or lower transition region with a density of between and . These upper and lower limits of the density are due to the uncertainties in the fit of the density scale height. Figure 3 (bottom) displays the fitted density model, as well as the upper and lower limits for the density. The arrows in Fig. 3 (top) illustrate the uncertainty in the RHESSI source heights resulting from the uncertainty in the density scale height. The peak of WL emission is found about 1 Mm higher than the position of the lowest observed RHESSI energy range (30 - 40 keV). Note that despite all the uncertainties in the height due to the density fit or due to relative pointing error, the WL source is still above the 30-40 keV RHESSI sources. Due to the presence of the SXR coronal emission in the X-ray spectrum, the non-thermal HXR spectrum below 20 keV is not known. However, extrapolating the height function found in Section 2 to lower energies, a source at 12 keV would be seen at about 2 Mm. This coincides with the height of the maximum energy deposition as found from Eq. 1 for cut-off energies of 12 keV (Fig. 2). The observed position of the maximum of the WL emission would then hint towards energy deposition by the low energy part of the non-thermal electron distribution, contrary to the often made assumption of electron cut-off energies in the range of 20 keV. This also suggest that WL and HXR sources above 30 keV should be spatially separated by 1 Mm with decreasing separation in events towards the disk center. However, we note that the height of the maximum energy deposition, especially in the case of low initial cut-off energies, is influenced by the loop density and the length of the loop. Assuming that the acceleration of the particles happens in the center of what is observed as the coronal source Fig. 2 indicates a precipitation distance of about 13 arcsec from the site of acceleration to the footpoints. This value was used for the computation of the energy deposition rate. In this case, the maximum energy deposition of electrons with energy keV will be near the top of the loop. Should the loop density be lower or the acceleration region extended, the lower energy electrons would be depositing their energy deeper. The other interesting aspect of this flare is that HXR emission above keV is well fitted by a single power-law. Non-uniform ionization of plasma produces a break at the energy corresponding to the column depth of the transition region, which is observed in other flares (Kontar et al., 2002; Su et al., 2011). The absence of such break points to the transition region above the stopping depth of 20 keV electrons again is consistent with the height measurements. The observation of strong emission from heights Mm suggests that a substantial part of the WL continuum is formed in an optically thin or finite optically thick region with ionized or partially ionized plasma in the upper chromosphere favoring free-bound and free-free emission of the continuum. This is additionally supported by the height of the AIA emission at 94, 335 and 193 (representing temperatures K) originating from around 3 Mm and above the WL emission peak. Finally, it is likely that the WL is powered by lower energy electrons keV, which do not penetrate deep into the solar chromosphere.
Acknowledgements.
The authors thank the anonymous referee for helpful comments and suggestions. This work is supported by the Leverhulme Trust (M.B., E.P.K.), STFC rolling grant (E.P.K.). Financial support by the European Commission through the FP7 HESPE network is gratefully acknowledged.References
- Aschwanden et al. (2002) Aschwanden, M. J., Brown, J. C., & Kontar, E. P. 2002, Sol. Phys., 210, 383
- Battaglia & Kontar (2011) Battaglia, M. & Kontar, E. P. 2011, ApJ, 735, 42
- Boyer et al. (1985) Boyer, R., Sotirovsky, P., Machado, M. E., & Rust, D. M. 1985, Sol. Phys., 98, 255
- Brown (1971) Brown, J. C. 1971, Sol. Phys., 18, 489
- Brown (1973) Brown, J. C. 1973, Sol. Phys., 31, 143
- Brown et al. (2002) Brown, J. C., Aschwanden, M. J., & Kontar, E. P. 2002, Sol. Phys., 210, 373
- Canfield (1974) Canfield, R. C. 1974, Sol. Phys., 34, 339
- Chen & Ding (2006) Chen, Q. R. & Ding, M. D. 2006, ApJ, 641, 1217
- Ding et al. (1999) Ding, M. D., Fang, C., & Yun, H. S. 1999, ApJ, 512, 454
- Emslie (2003) Emslie, A. G. 2003, ApJ, 595, L119
- Fang & Ding (1995) Fang, C. & Ding, M. D. 1995, A&AS, 110, 99
- Fletcher et al. (2007) Fletcher, L., Hannah, I. G., Hudson, H. S., & Metcalf, T. R. 2007, ApJ, 656, 1187
- Hannah et al. (2009) Hannah, I. G., Kontar, E. P., & Sirenko, O. K. 2009, ApJ, 707, L45
- Hudson (1972) Hudson, H. S. 1972, Sol. Phys., 24, 414
- Hudson et al. (2006) Hudson, H. S., Wolfson, C. J., & Metcalf, T. R. 2006, Sol. Phys., 234, 79
- Hurford et al. (2002) Hurford, G. J., Schmahl, E. J., Schwartz, R. A., et al. 2002, Sol. Phys., 210, 61
- Kontar et al. (2002) Kontar, E. P., Brown, J. C., & McArthur, G. K. 2002, Sol. Phys., 210, 419
- Kontar et al. (2010) Kontar, E. P., Hannah, I. G., Jeffrey, N. L. S., & Battaglia, M. 2010, ApJ, 717, 250
- Kontar et al. (2008) Kontar, E. P., Hannah, I. G., & MacKinnon, A. L. 2008, A&A, 489, L57
- Kontar & Jeffrey (2010) Kontar, E. P. & Jeffrey, N. L. S. 2010, A&A, 513, L2+
- Kretzschmar (2011) Kretzschmar, M. 2011, A&A, 530, A84+
- Krucker et al. (2011) Krucker, S., Hudson, H. S., Jeffrey, N. L. S., et al. 2011, apJ, in press
- Lemen et al. (2011) Lemen, J. R., Title, A. M., Akin, D. J., et al. 2011, Sol. Phys., 106
- Lin et al. (2002) Lin, R. P., Dennis, B. R., Hurford, G. J., et al. 2002, Sol. Phys., 210, 3
- Machado & Rust (1974) Machado, M. E. & Rust, D. M. 1974, Sol. Phys., 38, 499
- Matthews et al. (2003) Matthews, S. A., van Driel-Gesztelyi, L., Hudson, H. S., & Nitta, N. V. 2003, A&A, 409, 1107
- Meegan et al. (2009) Meegan, C., Lichti, G., Bhat, P. N., et al. 2009, ApJ, 702, 791
- Metcalf et al. (2003) Metcalf, T. R., Alexander, D., Hudson, H. S., & Longcope, D. W. 2003, ApJ, 595, 483
- Najita & Orrall (1970) Najita, K. & Orrall, F. Q. 1970, Sol. Phys., 15, 176
- Neidig (1989) Neidig, D. F. 1989, Sol. Phys., 121, 261
- Neidig et al. (1993) Neidig, D. F., Wiborg, P. H., & Gilliam, L. B. 1993, Sol. Phys., 144, 169
- Potts et al. (2010) Potts, H., Hudson, H., Fletcher, L., & Diver, D. 2010, ApJ, 722, 1514
- Saint-Hilaire et al. (2010) Saint-Hilaire, P., Krucker, S., & Lin, R. P. 2010, ApJ, 721, 1933
- Schmahl et al. (2007) Schmahl, E. J., Pernak, R. L., Hurford, G. J., Lee, J., & Bong, S. 2007, Sol. Phys., 240, 241
- Su et al. (2011) Su, Y., Holman, G. D., & Dennis, B. R. 2011, ApJ, 731, 106
- Sylwester & Sylwester (2000) Sylwester, B. & Sylwester, J. 2000, Sol. Phys., 194, 305
- Švestka (1970) Švestka, Z. 1970, Sol. Phys., 13, 471
- Vernazza et al. (1981) Vernazza, J. E., Avrett, E. H., & Loeser, R. 1981, ApJS, 45, 635
- Wachter et al. (2011) Wachter, R., Schou, J., Rabello-Soares, M. C., et al. 2011, Sol. Phys., 19
- Watanabe et al. (2010) Watanabe, K., Krucker, S., Hudson, H., et al. 2010, ApJ, 715, 651
- Xu et al. (2006) Xu, Y., Cao, W., Liu, C., et al. 2006, ApJ, 641, 1210