The Young, the Old, and the Dusty: Stellar Populations of AGN Hosts
Abstract
Studying the average properties of active galactic nuclei (AGN) host stellar populations is an important step in understanding the role of AGN in galaxy evolution and the processes which trigger and fuel AGN activity. Here we calculate model spectral energy distributions (SEDs) that include emission from the AGN, the host galaxy stellar population, and dust enshrouded star formation. Using the framework of cosmic X-ray background population synthesis modeling, the model AGN hosts are constrained using optical (B band) and near infrared (J band, 3.6 m, 5.7 m, 8.0 m, and 24 m) luminosity functions and number counts. It is found that at 1, type 1 and type 2 AGN hosts have similar stellar populations, in agreement with the orientation based unified model and indicative of secular evolution. At 1, type 2 AGN hosts are intrinsically different from type 1 AGN hosts, suggesting that the simple orientation based unified model does not hold at 1. Also, it is found that if Compton thick (CT) AGN evolve like less obscured type 2 AGN, then, on average, CT AGN hosts are similar to type 2 AGN hosts; however, if CT obscuration is connected to an evolutionary stage of black hole growth, then CT AGN hosts will also be in specific evolutionary stages. Multi-wavelength selection criteria of CT AGN are discussed.
1 Introduction
It is known that all massive galaxies have a central supermassive black hole (SMBH) (e.g., Kormendy & Richstone, 1995). Yet it is unknown why only a small fraction of these SMBHs are actively accreting as active galactic nuclei (AGN). Several theories attempt to explain the fueling mechanism of AGN: major mergers (e.g., Sanders et al., 1988; Hopkins et al., 2006), minor mergers and gravitational instabilities within the host galaxy (e.g., Crenshaw et al., 2003; Kormendy & Kennicutt, 2004; Pierce et al., 2007; Shapiro et al., 2008), nuclear starbursts (e.g., Davies et al., 2007; Ballantyne, 2008), supernova explosions within nuclear starbursts (e.g., Chen et al., 2009; Kumar & Johnson, 2010), and collisions of warm halo clouds with the nuclear region (McKernan et al., 2010b). Given the large range of observed AGN properties, it is likely that different fueling mechanisms come into play for different AGN populations. Current observations suggest that powerful quasars are triggered by major mergers but moderate luminosity AGN are more likely to be triggered by stochastic fueling incidents (Ballantyne et al., 2006a; Hasinger, 2008; Hopkins & Hernquist, 2009; Lutz et al., 2010). However, it is not yet clear which fueling mechanisms are dominant in which portions of the AGN population.
The unified model of AGN (Antonucci, 1993) explains the different observed levels of AGN obscuration as a simple geometric effect. This model assumes that the central engines of all AGN are identical and the level of obscuration is dependent on the line of sight between the observer and the central engine. Thus type 2 AGN are obscured by column densities 1022 cm-2, because the observer is looking through the dusty torus, in contrast to type 1 AGN which are unobscured ( 1022 cm-2) because the observer is looking down the throat of the dusty torus. Since the central engines are identical, it is expected that, on average, the host galaxies of various spectral types of AGN will be similar. However, different black hole fueling mechanisms are likely to lead to different relationships between the various spectral types of AGN. In the major merger AGN fueling paradigm, the AGN is triggered while deeply embedded in gas and dust and thus when the AGN first turns on, it is highly obscured. Eventually the radiation pressure pushes away the remaining gas and dust revealing an unobscured quasar (e.g., Page et al., 2004; Hopkins et al., 2006; Rigopoulou et al., 2009). In the major merger paradigm, type 1 and type 2 AGN have host galaxies which are in different evolutionary stages. Conversely, in the nuclear starburst fueling paradigm, type 1 and type 2 AGN hosts can be similar since on average the unified model can hold (Ballantyne, 2008). This shows that tests of the unified model can be used to explore which processes are viable options for AGN fueling and in which sections of the AGN population different mechanisms are relevant.
Classifying the host galaxies of Compton thick (CT) AGN, AGN with 1024 cm-2, is of special interest. It is expected that a large fraction of AGN with CT levels of obscuration are in a young evolutionary stage characterized by rapid black hole and host bulge growth (Sanders et al., 1988; Fabian, 1999; Hopkins et al., 2006; Fabian et al., 2009; Draper & Ballantyne, 2010; Treister et al., 2010). Thus, understanding the host properties of CT AGN may offer special insight into the AGN triggering process and the formation of massive galaxies. Large samples of CT AGN are difficult to identify because, by definition, CT AGN suffer from extreme levels of obscuration (e.g., Ghisellini et al., 1994). Therefore, previous studies of AGN host galaxies have not been able to study the stellar populations of CT AGN.
Galaxy optical colors are often described in terms of the red sequence and the blue cloud, where objects located on the red sequence are characterized by massive older stellar populations and objects on the blue cloud are less massive and have young stellar populations and current star formation. Between the red sequence and the blue cloud is a lightly populated region referred to as the green valley. Some studies find that AGN feedback is connected to the shut down of host star formation (e.g., McKernan et al., 2010a; Bluck et al., 2011) and thus certain types of AGN hosts preferentially reside in the green valley (e.g., Hickox et al., 2009; Griffiths & Stern, 2010; Wold et al., 2010; Smolčić & Riechers, 2011). Thus AGN activity is potentially a stage in galaxy evolution where feedback from the AGN could shut down star formation, causing the host galaxy to age from the blue cloud, across the green valley, and onto the red sequence (Faber et al., 2007; Schawinski et al., 2007). However, other studies find that the colors of an AGN and its host are more closely related to the amount of available obscuring material rather than the evolutionary stage of the host stellar population (Brusa et al., 2009; Georgakakis et al., 2009; Cardamone et al., 2010; Rovilos et al., 2011). Indeed, Cardamone et al. (2010) show that AGN are intrinsically bimodal in color and that many AGN which appear to be on the red sequence are actually located in the blue cloud once dust extinction is taken into account. Thus further investigation is necessary to establish the nature of AGN host galaxy stellar populations and the role of AGN feedback in regulating star formation. This point is especially salient as several possible AGN fueling mechanisms include either causal or concurrent star formation. Some studies even show that AGN obscuration may in part be due to nuclear starburst disks (e.g., Thompson et al., 2005; Davies et al., 2007; Ballantyne, 2008). In order to understand how host galaxy processes affect the central SMBH and the role of the central SMBH in host galaxy evolution, the nature of stellar populations of AGN hosts must be well understood.
As AGN hosts exhibit size-able object-to-object variability, it is difficult to elucidate trends in the AGN population by fitting individual objects. Thus, in order to study larger trends in AGN–host galaxy interactions, the average stellar properties of a large ensemble of AGN hosts is investigated here. To this end the stellar synthesis models of Bruzual & Charlot (2003) are used to explore the stellar populations of AGN hosts. As in previous studies (Ballantyne et al., 2006b; Draper & Ballantyne, 2011), the AGN SEDs are calculated using the photoionization code Cloudy (Ferland et al., 1998). The cosmic X-ray background (CXRB) synthesis modeling framework is used to characterize the AGN population. The model SEDs are then used to move the CXRB framework into other wavelength regions. This allows the space density and evolution of AGN host galaxies to be determined by the most comprehensive census of AGN activity. By comparing these models against various observations in the optical through mid-infrared (mid-IR) spectral ranges, constraints are placed on the average stellar populations of type 1, Compton thin type 2 (here referred to simply as type 2), and CT AGN at various redshifts. In Section 2 the AGN spectral model and stellar population model are described. Section 3 presents the results of the model. In Sections 4 and 5 the results are discussed and summarized. AB magnitudes are used, unless otherwise stated, and = 0.7, = = 0.7 is assumed as necessary.
2 The Model
2.1 Methodology
In order to study the average properties of AGN host galaxy stellar populations, a model is created which combines knowledge of AGN space density and evolution from deep X-ray surveys and CXRB population synthesis models with stellar population studies. A model SED is computed which includes the emission from the AGN, the host galaxy stellar population, and ongoing dust enshrouded star formation. This AGN and host SED covers the wide spectral range of hard X-ray to mid-IR. The calculation of the AGN model SED is discussed in Section 2.3 and the details of the host stellar population model SED calculation are discussed in Section 2.4. To account for dust enshrouded star formation, the templates of Rieke et al. (2009) are used, which extend from 5 m to 30 cm, and are determined by averaging empirical SEDs of local purely star forming galaxies. While dust enshrouded star formation may contribute to the galaxy SED at wavelengths shorter than 5 m, generally the near IR AGN and host SEDs are dominated by either emission from the AGN or the Bruzual & Charlot (2003) portion of the host SED. Examples of the rest frame AGN and host SEDs are shown in Figure 1, where the dot-dashed lines show AGN SEDs, the dashed lines show stellar population SEDs, and the dotted lines show the Rieke et al. (2009) templates.
A Gaussian stellar mass () distribution was used with = 109.5 M⊙ and = 1012 M⊙. The average was set at 1010.9 M⊙ with a standard deviation of 0.4 dex, in agreement with the sample of X-ray selected, 1 AGN hosts presented by Pierce et al. (2010). It is assumed that the mass-to-light ratio of the host galaxy is constant within each waveband and thus the host galaxy flux scales linearly with the host . Therefore, the stellar population SED is calculated for = 1 M⊙ and then re-normalized to = 109.5 – 1012 M⊙ before the stellar population and AGN SEDs are combined. Creating host SEDs at several masses in the AGN host mass spectrum allows the consideration of AGN and host colors for hosts of various masses. When considering space densities, however, it is important to consider not only the range of AGN host masses but also the probability that an AGN host be a certain . The space density calculations presented are therefore weighted sums across the mass spectrum of AGN hosts where the weight is determined by the Gaussian distribution described above. Specifically, when calculating luminosity functions and number counts the weighted sum over the Gaussian distribution is used; however, when considering flux-flux plots, only the range of is used. In agreement with current observational results, the distribution used does not evolve with redshift (Bluck et al., 2011).
A variety of broad band data from the optical through mid-IR is used to constrain the host models. These model constraints are described in Section 2.5, and include mid-IR number counts, the J band AGN and host space density as a function of redshift and the absolute J band magnitude, , and the type 1 AGN and host B band luminosity function. We begin by assuming that the unified model (e.g., Antonucci, 1993) holds and therefore, since all AGN are essentially the same system viewed along different lines of sight, there is only one class of AGN host galaxies.
2.2 CXRB Synthesis Model
It is known that the CXRB encodes the accretion history of SMBHs and as such is a powerful tool for scientific inquiry into accretion processes (Fabian & Barcons, 1992). The CXRB synthesis model framework can be used in wavelength regions outside of the X-ray spectral region by modeling the SEDs of AGN and their host galaxies. Thus the advances in CXRB synthesis modeling (e.g., Risaliti et al., 1999; Ballantyne et al., 2006a; Gilli et al., 2007; Treister et al., 2009b; Draper & Ballantyne, 2009) can be used to further the understanding of AGN at all wavelengths. Particularly, CXRB synthesis models provide constraints on the distribution of , the fraction of type 2 AGN, , and the fraction of CT AGN, . Here a simple distribution is assumed where type 1 AGN are evenly distributed among = 20.0, 20.5, 21.0, 21.5, type 2 AGN are evenly distributed among = 22.0, 22.5, 23.0, 23.5, and CT AGN are evenly distributed among = 24.0, 24.5, 25.0. Ballantyne et al. (2006a) showed that this distribution is consistent with CXRB observations and provides results which are negligibly different from the observed distribution of Risaliti et al. (1999) (Ballantyne et al., 2006a, b). The shape of the CXRB combined with deep X-ray surveys has also been used to constrain (e.g., Ballantyne et al., 2006a). At a given and redshift, where = 0.4 (Ballantyne et al., 2006a) and = 4.7. The normalization of is set such that at = 0 and = 41.5, the type 2 to type 1 ratio is 4:1 (see Section 2.2 of Draper & Ballantyne, 2009).
Both the original and the composite model of CT AGN evolution of Draper & Ballantyne (2010) are considered. The original, non-evolving model assumes that CT AGN are a simple extension of the Compton thin type 2 AGN population and that, when assuming the Ueda et al. (2003) hard X-ray luminosity function, 44 of all obscured AGN are CT. In this model there is a population of CT AGN which are nearly as common as Compton thin type 2 AGN and which are in all ways similar to Compton thin type 2 AGN except for the presence of more obscuration along our line of sight. Contrastingly, the composite model assumes that CT AGN are a population of AGN distinct from the Compton thin type 2 AGN population. Simulations show that gas rich galaxy mergers will cause dust and gas to be funneled into the nuclear region of the galaxy, triggering star formation and accretion onto the central SMBH (e.g., Hopkins et al., 2006). Due to the large reservoir of material, the SMBH will accrete very rapidly and be very highly obscured (Fabian, 1999; Fabian et al., 2008, 2009). Thus it is expected that CT AGN are high Eddington ratio sources. Draper & Ballantyne (2010) found that if all CT AGN are rapidly accreting sources, than the local space density of CT AGN is under-predicted, and thus a population of low Eddington ratio CT AGN are necessary to explain the observed space density of CT AGN. These low accretion rate CT AGN are likely obscured by molecular clouds within the host bulge. Observational evidence of this low luminosity CT AGN population has been found in the local universe (Terashima & Wilson, 2003; González-Martín et al., 2009). Furthermore, Draper & Ballantyne (2010) showed that if CT AGN have moderate Eddington ratios, the space density of CT AGN with 1043 erg s-1 at 0 is greatly over-predicted. Therefore, the evolving model of CT AGN has an Eddington ratio dependent with 86 of all AGN which are accreting at 90 of their Eddington rate being CT and 60 of all AGN which are accreting at 1 of their Eddington rate being CT. In this model CT AGN are a distinct population of AGN associated with specific stages of AGN evolution and evolves with both , the AGN 2–10 keV luminosity, and redshift. Both the evolving model and the non-evolving model are consistent with the CXRB and the local space density of CT AGN with 1043 erg s-1 (Draper & Ballantyne, 2010).
2.3 AGN SEDs
In order to compute the model AGN SEDs, the photoionization code Cloudy version C08.00 (Ferland et al., 1998) is used, following the same procedure as in Section 2 of Draper & Ballantyne (2011). These SEDs cover the wavelength range of very hard X-ray through far-IR and include the transmitted AGN emission, the diffuse emission emitted along the line of sight by the obscuring material around the AGN, and the reflected emission off the inner face of the obscuring cloud. The inner radius of the obscuring material is assumed to be 10 pc. As in Draper & Ballantyne (2011), the obscuring clouds are assigned neutral hydrogen densities, , in agreement with typical molecular clouds; the Compton thin clouds have = 104 cm-3 and the Compton thick clouds have = 106 cm-3.
2.4 Host Galaxy Stellar Population Model
The host galaxy stellar populations are modeled using GALAXEV 111available at http://www. cida.ve/ bruzual/bc2003 (Bruzual & Charlot, 2003). This model calculates stellar population SEDs over the wavelength range of 91Å– 160 m. Using an isochrone synthesis technique, GALAXEV can evolve stellar populations with three stellar evolution library options. We assume the stellar evolution models of the ’Padova 1994’ library and the stellar spectra of the STELIB/BaSeL 3.1 semi-empirical library. GALXEV models can be computed for six different metallicities in the range = 0.005Z⊙ - 2.5Z⊙. Both the Salpeter (1955) and Chabrier (2003) initial mass functions (IMFs) are available in the GALAXEV code. Here we assume solar metallicity (Kauffmann et al., 2007; Silverman et al., 2009) and the Chabrier (2003) IMF (Silverman et al., 2009). The sensitivity of the results to these assumptions is assessed in Section 3. GALAXEV also allows for a variety of star formation histories, including constant star formation rate, instantaneous bursts, and exponentially declining star formation rate. An exponentially declining star formation history (Kauffmann et al., 2007; Silverman et al., 2009) with an -folding time of 0.5 Gyr is used here. This star formation history allows for a simple parametrization of the average age of the stellar population while not requiring the entire stellar population to be a single age. GALAXEV does not include re-radiation of energy absorbed by dust; however, the majority of this re-emission by cool dust occurs at wavelengths longer than those considered here.
The stellar population SEDs are computed in four different redshift bins: 1, 1 2, 2 3, and 3 5, where is the redshift. We assume that the host galaxy has a dominate stellar population (DSP) which is slightly younger than the average age of the universe in each redshift bin, and is given by the Gaussian distribution described in Section 2.1. A younger stellar population (YSP) which accounts for 0.1 (Kauffmann et al., 2007; Shi et al., 2009) is also included. The age of the YSP is selected such that (4000Å) 1.5 (Kauffmann et al., 2003; Silverman et al., 2009), using (4000Å) = , where is the flux in the 4000–4100 Å wavelength range and is the flux in the 3850–3950 Å wavelength range (Balogh et al., 1999). For the stellar population models used here, (4000Å) 1.5 corresponds to a stellar population age of 2 Gyr. The age of the YSP and DSP in each redshift bin is summarized in Table 1. At 2, the older and younger stellar populations are the same age and thus at 2 3 the entire stellar population is 2 Gyr old and at 3 5 the entire stellar population is 1 Gyr old. Extinction due to dust, as described by , is allowed to vary between redshift bins, but not within redshift bins. While in some objects the AGN emission is likely to be extincted by extended dust structures within the host galaxy (e.g., Martínez-Sansigre et al., 2010), this is not true for all objects. As this study focuses on modeling the average properties of AGN and their hosts, a detailed modeling of the complex geometry of obscuring material in individual sources is beyond the scope of this work. Thus, it is assumed here that all of the extinction suffered by the AGN emission occurs within a few tens of parsecs of the central engine. The dust which extincts the stellar population is not allowed to further extinct the AGN emission.
2.5 Model Constraints
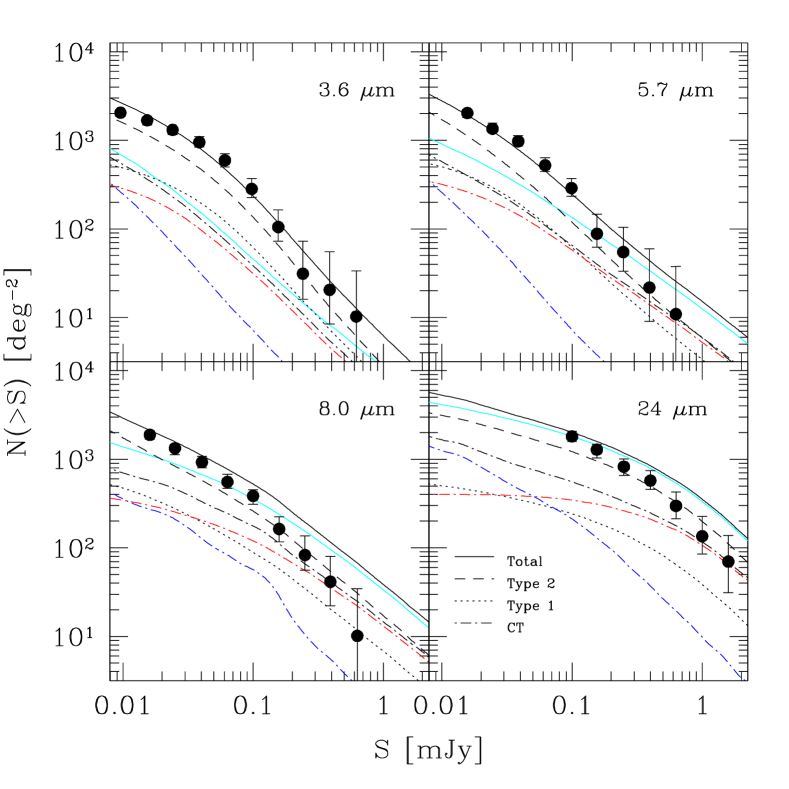
A variety of data in a broad range of spectral regions was used to constrain the stellar population models. The number counts are computed at 3.6, 5.7, 8.0 and 24 m and compared to the AGN observed by Spitzer Space Observatory in the GOODS fields with 1 10-16 erg s-1 cm-2, where is the 2–8 keV flux (Treister et al., 2006). This X-ray flux limit is taken into consideration in the number counts calculated here, thus the number counts presented are computed for the same population probed by the observational data points. These number counts are dominated by type 2 AGN and their hosts and therefore are primarily useful to constrain the type 2 AGN host population. The number of sources at wavelength per square degree with flux greater than , (), is found by
| (1) |
where = 3.05 10-4 deg2 sr-1, is the hard X-ray luminosity function of Ueda et al. (2003) or, when referring to the evolving model, is the evolving Eddington ratio space density calculated by Draper & Ballantyne (2010), in units of Mpc-3, is the luminosity distance, and is the 2–10 keV rest-frame luminosity which corresponds to the observed-frame flux at redshift z.
As the number counts are dominated by type 2 AGN and their hosts, a separate data set must be used to constrain the type 1 AGN host stellar populations. The most obvious choice is the optical luminosity function for type 1 Seyferts and QSOs and their hosts. Using the X-ray luminosity function, the type 1 AGN and host B band luminosity function, can be calculated using the following equation:
| (2) |
This luminosity function is considered in three redshift bins — 0.4, 1.0 1.55, and 1.55 2.1.
Further constraints were considered in order to rule out possible degeneracies between stellar population age and extinction due to absorption by dust. The first of these additional constraints was the AGN and host J band space density as a function of redshift in several bins. First, the AGN and host J band luminosity function, , must be calculated. This is done in the same manner as above. Therefore,
| (3) |
The normalization constant depends on the AGN spectral type being considered. For type 1 AGN, = , while for type 2 AGN, = , and for CT AGN, = . For comparison with the J band AGN and host space density measured by Assef et al. (2011), is then binned into six bins.
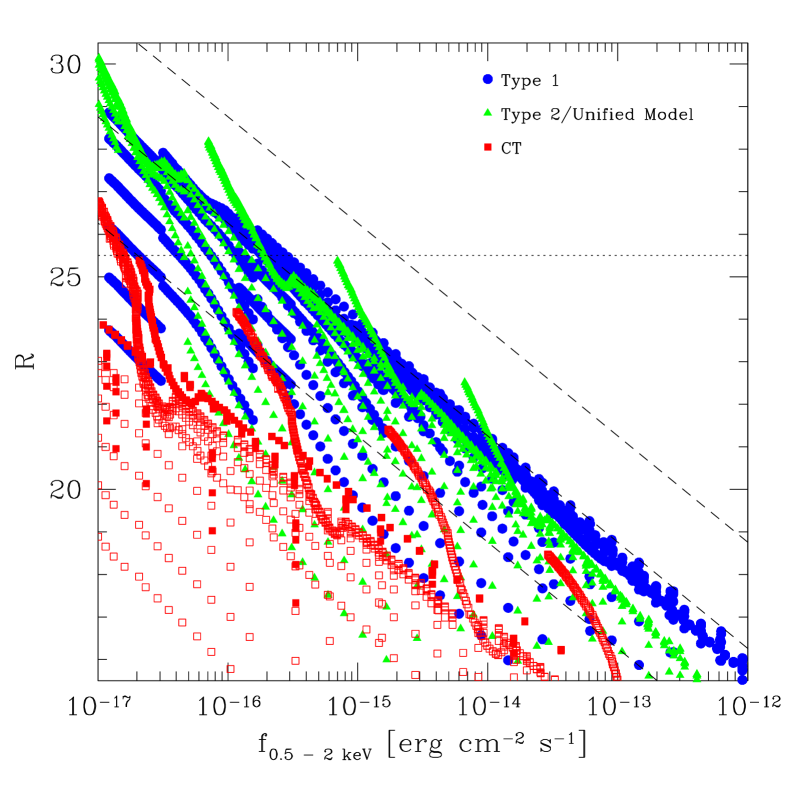
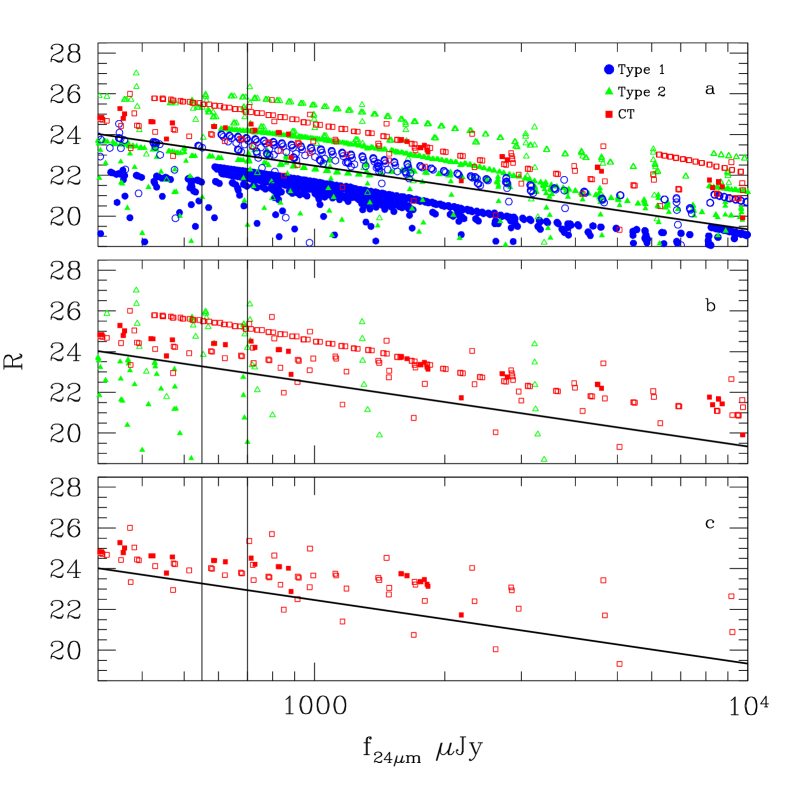
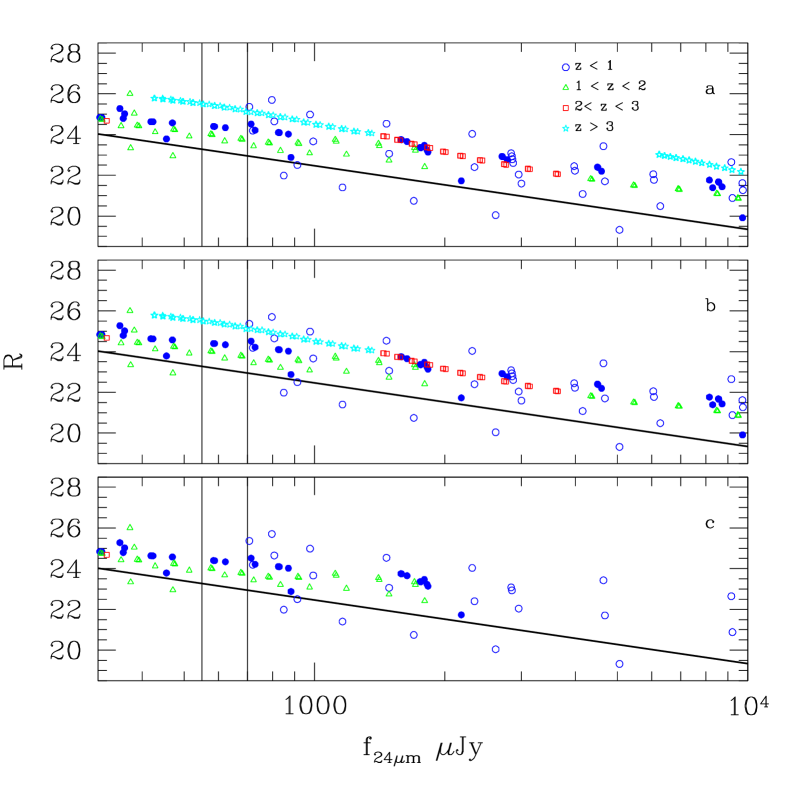
Additionally, the optical colors were considered in the form of the U-B versus MB color-magnitude diagram (CMD). Also, it is well documented that AGN and their hosts tend to have X-ray to optical flux ratios of 01 (e.g. Alexander et al., 2001; Brandt et al., 2001; Rovilos et al., 2010), with CT AGN hosts generally falling below this ratio. Here the ratio between the soft X-ray flux, , and the R band flux, , = 01 is used to ensure that the absolute optical fluxes are in agreement with observations.
2.6 Procedure
With all the necessary ingredients in place, we begin by assuming that the unified model holds, and therefore, on average, type 1, type 2, and CT AGN hosts are identical. The AGN space density, distribution, type 1/type 2 AGN ratio, and are set by the CXRB model used. The age of the stellar populations is assigned such that the dominant stellar population age is slightly less than the mean Hubble time in each redshift bin and a younger stellar population is assigned the age corresponding to the average observed (4000 Å) for AGN host galaxies. The stellar population ages are summarized in Table 1. The host distribution is Gaussian within the observed AGN host range. The only free parameters are the host galaxy dust enshrouded star formation rate and the extinction due to dust. These two free parameters are used to fit the near and mid-IR AGN and host number counts. The dust enshrouded star formation rate is determined by cycling through the Rieke et al. (2009) templates in order of increasing infrared luminosity in steps corresponding to a change in SFR of 1 M⊙ yr-1, until the 24 m number counts are over-estimated at all flux levels. The template of the highest luminosity to not over-estimate the mid-IR number counts is selected as the best fit template. The dust extinction in the Bruzual & Charlot (2003) models is set using the total effective V band optical depth obscuring young stars, . SEDs are computed with = 0.0, 1.0, 2.0, 5.0, 7.5, 10, 15, 20, and 25. This corresponds to = 0.0 - 1.0, with the exact values of depending on the age of the stellar population. The with a reduced , , closest to 1.0, with respect to the 35 number counts data points at 3.6 m, 5.7 m, 8.0 m, and 24 m, is selected as the best fit model. The resulting model is then compared to the suite of optical and near IR observations described in Section 2.5 in order to evaluate the appropriateness of the model fit to observations. In this manner the average AGN host galaxy properties are elucidated without the complications which arise from object-to-object variability. Next, the assumption of the unified model is tested by considering the specific constraints for different spectral types. Multiple star formation scenarios and the evolution of are also considered.
3 Results
3.1 Unified Model of AGN Hosts
In this section, it is assumed that the unified model holds and therefore type 1, type 2, and CT AGN have, on average, identical host galaxies. First, the maximum dust enshrouded star formation rate (SFR) allowed by the near and mid-IR number counts for X-ray selected AGN observed by Spitzer in the GOODS fields, as reported by Treister et al. (2006), is determined. Figure 1 shows that the mid-IR emission is due primarily to the AGN and dust enshrouded star formation; therefore, fitting the 24 m number counts can be used to set an upper limit on the average AGN host dust enshrouded SFR. In order to not over-estimate the AGN and host mid-IR number counts, the average AGN host must have a SFR 2 M⊙ yr-1. This SFR is consistent with the findings of Ballantyne et al. (2006b), who found that an AGN host SFR 1 M⊙ yr-1 provides a good fit to Spitzer’s measurement of the AGN contribution to mid-IR portion of the cosmic infrared background, and is similar to the SFR of local normal spiral galaxies (e.g., Lee et al., 2009). According to the Kennicutt (1998) relation, this SFR corresponds to an infrared star formation luminosity 1010 L⊙.
Next, the dust content of the average AGN host galaxy is fixed by fitting the near IR AGN and host number counts. It is found that if the average AGN host has 0.5, the near IR number counts are under-predicted. However, if the average AGN host has 0.4, the near and mid-IR number counts are over-predicted. As it is known that higher redshift galaxies tend to be dustier than local galaxies (e.g., Dunne et al., 2003; Santini et al., 2010), it is assumed that 1 AGN hosts contain less dust than 1 AGN hosts. If the average AGN host at 1 has 0.25 and the average 1 AGN host has 0.5, the predicted number counts are in good agreement with the near and mid-IR number counts observations, with = 1.2. If the average 1 AGN host has 0.25, the mid-IR number counts are over-predicted. In contrast, the model constraints are not very sensitive to the age of the older, dominant stellar population, which can be changed by 1 Gyr with only minor effects. The age of the younger stellar mass population is constrained to within 0.5 Gyr.
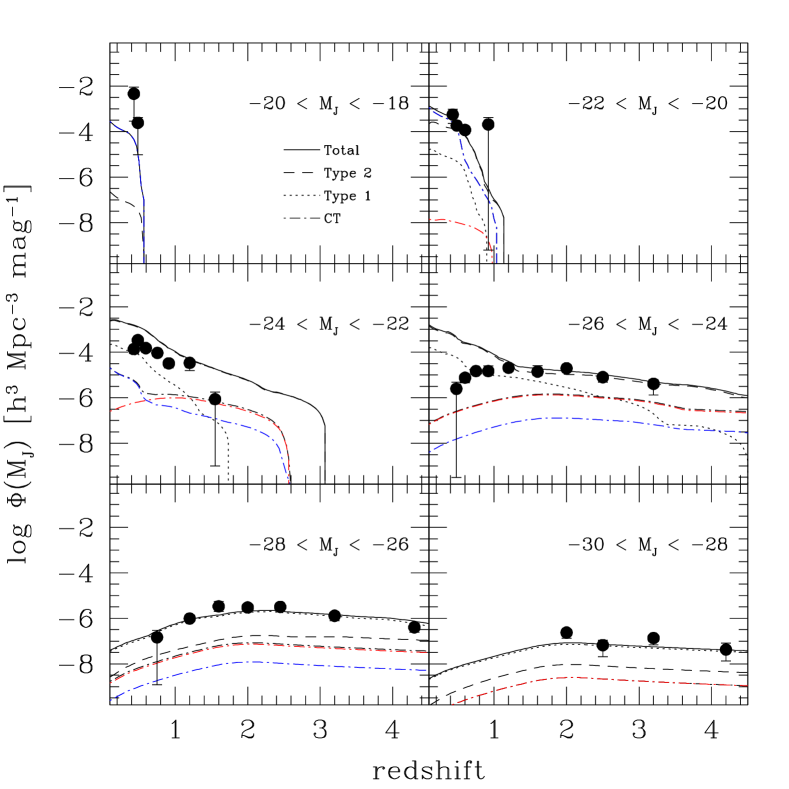
This unified model of AGN hosts is also in good agreement with the other model constraints. The J band AGN and host space density is in decent agreement with observations, as shown in Figure 2. The data points in Figure 2 show the results of Assef et al. (2011). At 0.75 the IR and X-ray selected AGN sample of Assef et al. (2011) was chosen using a specific selection criterion for optically extended sources. As the models used here do not account for the spatial extent of the AGN host galaxies, this exact selection criterion cannot be replicated. This gives rise to an obvious discrepancy between the model predictions presented here and the observed J band space density reported by Assef et al. (2011). Thus at 0.75 we over-predict the AGN and host space density in magnitude bins of medium brightness and under-predict the fainter magnitude bins. Type 2 AGN hosts dominate the J band space density at -26 for 0.75, with type 1 AGN hosts dominating the brightest magnitude bins.
According to Figure 6 of Pierce et al. (2010), type 1 and type 2 AGN tend to be found in the 0.55 U-B 1.4 and -23.5 -19 region of the CMD. This region of the CMD is well populated by the model adopted here as many combinations of AGN and host galaxy fit this criteria. Furthermore, the AGN and hosts fit the expected ratio, as shown by the green triangles in Figure 3. Thus the unified model of AGN hosts explains the average trends of AGN and host observations in the optical through mid-IR spectral regions.
In order to understand how well constrained these findings are, the same procedure is followed using a supersolar metallicity, = 2.5, a subsolar metallicity, = 0.2, and the Salpeter (1955) IMF. In all of these scenarios, it is found that the stellar ages described in Section 2.4 are able to fit the model constraints well; however different values are necessary. The columns labeled ”Unified/type 2 AGN host” in Table 2 summarize the values for the different models considered. As the Rieke et al. (2009) templates are independent of the GALAXEV stellar population models, the average AGN host dust enshrouded SFR is not affected by changing the metallicity or IMF of the host galaxy stellar population.
Overall, the near and mid-IR AGN and host number counts, as well as the J band space density, optical colors, and X-ray to optical ratio of AGN and their hosts are in good agreement with observations if type 1, type 2, and CT AGN have, on average, similar host galaxies. Also, the near and mid-IR number counts require AGN hosts at 1 be dustier than AGN hosts at 1. We now investigate if this finding holds when spectral type specific model constraints are considered.
3.2 Type 1 AGN Hosts
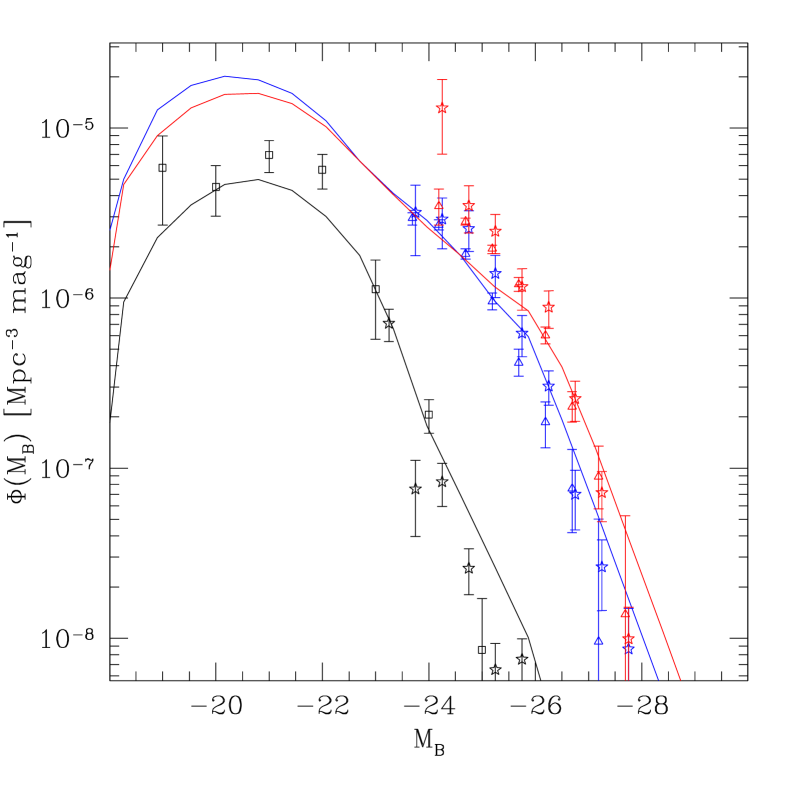
In order to study the host galaxies of type 1 AGN, we begin by calculating the type 1 AGN contribution to the type 1 AGN and host B band luminosity function. The predicted AGN only B band luminosity function is shown as the dot-dashed lines in Figure 4, where black lines and data refer to 0.4, blue lines and data refer to 1.0 1.55, and red lines and data refer to 1.55 2.1. The takes into account the 50 B band type 1 AGN and host B band luminosity function data points shown in Figure 4. When only the AGN contribution to the B band luminosity function is considered, = 14. It is clear that except for at the very brightest magnitudes, a contribution from the host galaxy is necessary in order to fit the observed type 1 AGN and host B band luminosity function.
If the same stellar population described in Section 3.1 is used to calculate the type 1 AGN and host B band luminosity function, the predicted 1 luminosity functions are not in agreement with observations. The unified model gives a = 13 fit to the B band luminosity function. This is shown by the dashed lines in Figure 4. For the 0.4 type 1 AGN and hosts, the lower limit of the unified AGN host model B band luminosity function (solid black line in Figure 4) is in decent agreement with observations. As the type 2 AGN hosts are constrained by the IR AGN and host number counts as described in Section 3.1, this suggests that at 1, AGN hosts can be described by the unified AGN host model, but at 1 the unified AGN host model cannot properly predict the type 1 AGN and host B band luminosity function. Thus at 1, type 1 and type 2 AGN must be hosted by two distinct galaxy populations. The lowest with respect to the B band luminosity function is found when type 1 AGN hosts have 0.05 at 1. For this model = 4.3, which is not formally a good fit to the data points, but is dominated by the over-prediction of the two faintest Croom et al. (2004) data points at both 1.0 1.55 and 1.55 2.1. If these points are not included = 2.5. As these data points refer to observations of faint AGN at high redshift, it is likely that the observational sample is not complete at these fluxes. Thus, at 1 type 1 and type 2 AGN hosts are similarly dusty. However, at 1, type 1 AGN hosts are less dusty than type 2 AGN hosts. Also, on average, it appears that type 1 and type 2 AGN hosts have similarly aged stellar populations, at least at 2, where the model can be well constrained.
The type 1 AGN host stellar population described above is in good agreement with the other model constraints considered. Figure 5 shows the number counts for type 1 AGN and their hosts as dotted lines. This model has a = 1.3 with respect to the observed number counts. For the unified model, a = 1.2 was found with respect to the IR number counts; thus reducing the dust extinction in type 1 AGN hosts at 1 has little effect on the total IR number counts. Type 1 AGN and hosts make a considerable contribution to the shorter wavelength number counts, but at mid-IR wavelengths they make a minimal contribution. Again shown as dotted lines, Figure 6 demonstrates that type 1 AGN and hosts dominate the J band space density for -26 and make a significant contribution in the -26 -24 magnitude bin. However, at fainter absolute magnitudes, the type 1 AGN hosts make only a nominal contribution to the J band AGN and host space density.
The region of the CMD where type 1 AGN and their hosts tend to be found, as shown by the upside down triangles in Figure 6a of Pierce et al. (2010), is -23.5 -19 and 0.55 U-B 1.4. This region of the CMD is well populated by a variety of AGN and host model combinations. The majority of type 1 AGN and host model SEDs used here are in agreement with the ratio, as exhibited by the blue circles in Figure 3. At fainter soft X-ray fluxes it appears that the type 1 AGN and hosts fall below the expected ratio. These sources are located at 2.0 where the observed R band flux measures rest frame UV emission. Due to the observed frame R band filter redshifting out of optical wavelengths, it is unclear whether the = 0 1 relation should hold at high redshift. These high redshift type 1 AGN and hosts can be brought into agreement with = 0 1 by increasing the extinction due to dust in the host stellar population or by increasing the age of the host stellar population. Thus if the locally observed ratio holds at high redshift, this suggests that at the peak of quasar activity, type 1 AGN hosts either had older stellar populations than type 2 AGN hosts at the same redshift or were dustier than 1.0 2.0 type 1 AGN hosts. If the stellar populations of type 1 AGN hosts at 2 are older than the stellar populations of type 2 AGN hosts at the same epoch, this implies an evolutionary scenario where recently triggered AGN are obscured and then blow out the obscuring gas and dust in order to reveal an unobscured AGN and an older host. It is also possible that, since the fraction of gas rich galaxies at 2 is larger than at 1 2 (Dahlen et al., 2007), type 1 AGN hosts located at 2 contain more dust than type 1 AGN hosts located at 1 2. Both of these possibilities are consistent with quasars being triggered by major mergers, which is expected to be the dominate quasar fueling mechanism at 2 3.
When considering the subsolar metallicity, supersolar metallicity and Salpeter (1955) IMF models, the values for which supply the best fit for the type 1 AGN and host B band luminosity function change, but the general trend that type 1 and type 2 AGN host stellar populations are similar at 1 and different at 1 remains. The values for type 1 AGN hosts in the different models are shown in the columns labeled ”Type 1 AGN host” in Table 2. In all models the type 1 AGN hosts are similar in dust content to the type 2 AGN at 1 and the type 1 AGN hosts are less dusty than the type 2 AGN hosts at 1. Thus, regardless of the metallicity or IMF, type 1 and type 2 AGN hosts are similar at 1 and intrinsically different at 1.
3.3 Star Formation in AGN Hosts
The emission due to obscured star formation is taken into account using the Rieke et al. (2009) star formation templates. The mid-IR AGN and host number counts suggest that the average AGN host has a dust obscured SFR 2 M⊙ yr-1, the same SFR as normal local spiral galaxies (e.g., Lee et al., 2009). However, recent studies suggest that a larger, but still modest, AGN host SFR is expected (e.g., Lutz et al., 2010; Melbourne et al., 2011). Furthermore, studies also find that the AGN host SFR tends to increase with redshift (Lutz et al., 2010), AGN luminosity (Thompson et al., 2009), or both (Serjeant & Hatziminaoglou, 2009; Serjeant et al., 2010). As several AGN fueling mechanisms, such as the starburst disk model of Ballantyne (2008), require processes related to star formation, it is important to consider if it is possible for AGN hosts to have average SFR 2 M⊙ yr-1. Thus several SFR evolutions are considered here.
The Wilman et al. (2010) SFR evolution depends on both AGN and redshift, finding
| (4) |
When the Wilman et al. (2010) SFR evolution is used, the average 1 SFR must still be 2 M⊙ yr-1 in order to not over-predict the mid-IR number counts. However samples of AGN hosts with average SFRs an order of magnitude higher than this ( 18-41 M⊙ yr-1) have been observed (Lutz et al., 2010; Melbourne et al., 2011; Seymour et al., 2011). In order to explain these observations, a population of enhanced star formation sources are considered. The normalization factor for the proportionality in equation 4 is set such that the average SFR for AGN hosts at 1 is 20 M⊙ yr-1. In order to not over-estimate the faint end of the 24 m number counts, enhanced star formation sources can account for at most 15 of the AGN population.
Similar fractions of enhanced star formation sources are found using other SFR evolutions. Serjeant et al. (2010) used Herschel Space Observatory observations of type 1 SDSS selected quasars to study the evolution of SFR in quasar hosts, finding that AGN host SFR displays strong luminosity dependent evolution with redshift. This leads to a SFR evolution of the form
| (5) |
where -1.9 - 42, where is the absolute I band magnitude of the quasar. If the average 1 SFR is set at 20 M⊙ yr-1, enhanced star formation sources can at most be 5 of the AGN population.
If AGN host SFR does not evolve with luminosity, and instead only evolves with redshift, then the average AGN host SFR can be considerably higher. If the average AGN host SFR redshift evolution found by Serjeant et al. (2010) for moderate luminosity AGN, SFR , is applied to all AGN hosts, an average 1 SFR 16 M⊙ yr-1 for both type 1 and type 2 AGN is in good agreement with the mid-IR AGN and host number counts, with = 1.3. This average SFR corresponds to SFR(=0.0) = 0.5 M⊙ yr-1, which is in excellent agreement with Kim et al. (2006) who, using a sample of local type 1 SDSS quasars, found that the average local AGN host SFR 0.5 M⊙ yr-1. Furthermore, in the redshift only SFR evolution, for an average 1 SFR 20 M⊙ yr-1, 80 of AGN hosts can be enhanced star formation sources.
Thus, if the AGN host SFR evolution is dependent on luminosity, either through luminosity evolution or luminosity dependent redshift evolution, enhanced star formation sources are 5-15 of the AGN population, but if AGN host SFR only evolves with redshift, the average AGN host SFR can be up to 16 M⊙ yr-1. This finding is fully consistent with the 15 m AGN luminosity function at 0.7 observed by Fu et al. (2010). Furthermore, Lutz et al. (2010) find that for moderate luminosity AGN, the SFR does not evolve with and that only at the highest quasar luminosities does the AGN host SFR seem to depend on the AGN luminosity. Therefore, the fraction of enhanced star formation sources found here is a lower limit to the true fraction of enhanced star formation sources.
3.4 CT AGN Hosts
Observational and theoretical evidence suggests that CT levels of obscuration of an AGN may be due to an evolutionary stage where the SMBH and host bulge are both in a phase of rapid growth (e.g. Sanders et al., 1988; Fabian, 1999; Page et al., 2004; Ballantyne, 2008; Fabian et al., 2009; Draper & Ballantyne, 2010; Nardini & Risaliti, 2011). According to galaxy merger simulations, gas rich mergers will ignite a burst of star formation and rapid black hole growth (e.g. Hopkins et al., 2006). In this scenario, it is expected that CT AGN hosts would be a subset of the ultraluminous infrared galaxy (ULIRG) population, characterized by 1012 L⊙, where is the 8–1000 m luminosity. In order to test this scenario, we attempt to model the CT AGN hosts with stellar populations similar to those found in ULIRGs hosting AGNs. Rodríguez Zaurín et al. (2010) find that ULIRGs hosting AGNs have an average stellar population age of 0.3 Gyr which dominates the stellar mass of the galaxy with an average 1010.8 M⊙ and standard deviation of 0.35 dex and an average 0.6. This scenario is tested using both the non-evolving and evolving models described in Section 2.2.
Due to the observational challenges of identifying CT AGN, there is no data set specific to the optical or near infrared properties of CT AGN hosts. Thus the near and mid-IR AGN number counts measured from an X-ray flux limited sample of AGN, with 1 10-16 erg s-1 cm-2 (Treister et al., 2006), are used to place limits on the average CT AGN host galaxy. The X-ray flux limit of the Spitzer GOODS AGN sample is taken into account in the number counts calculation. Thus, despite the fact that a large fraction of CT AGN are missed by deep X-ray surveys (Hasinger, 2008), the dot-dashed lines in Figures 5 and 7 show the CT AGN which would have been selected by the Treister et al. (2006) selection criteria. The J band space density, X-ray to optical flux ratio, and optical colors are also used to ensure the model CT AGN hosts are consistent with observations of the AGN population as a whole.
3.4.1 Non-evolving Model
The non-evolving model of Draper & Ballantyne (2010) assumes that CT AGN evolve like less obscured type 2 AGN. In order to match the peak of the CXRB at 30 keV, it is required that 44 of obscured AGN are CT. When the CT AGN host stellar populations are modeled in agreement with the findings of Rodríguez Zaurín et al. (2010), the IR number counts are greatly over-predicted. This suggests that on average, CT AGN in the non-evolving model cannot be hosted by ULIRGs. In fact, when using the non-evolving model, the average CT AGN host cannot even be a luminous infrared galaxy (LIRG), which is characterized by 1011 L⊙. In order for the near and mid-IR number counts to not be over-predicted at the faint end, the average non-evolving model CT AGN host must have 1010.75 L⊙, corresponding to a star formation rate of 10 M⊙ yr-1, according to the Kennicutt (1998) relation. The youngest the non-evolving model CT AGN host average stellar population can be, and not over-predict the mid-IR number counts, is 1 Gyr old which requires 1.0. The contribution of the non-evolving model CT AGN and their hosts to the near and mid-IR number counts is shown as the dot-dashed line in Figure 5.
In the non-evolving model, CT AGN dominate the low redshift, faint region of the J band space density. Figure 6 shows the CT AGN and host contribution to the J band space density as the dot-dashed lines. As expected by the higher dust content, CT AGN hosts occupy a region of the CMD which is on average slightly redder and fainter than the type 1 and type 2 AGN hosts. The CT AGN tend to lie below the ratio, as the majority of the soft X-ray flux of CT sources is absorbed by the CT obscuring material. Figure 3 shows the ratio of CT AGN and their hosts as red squares. Changing the metallicity or IMF used for the host galaxy stellar population does not change these results.
When the enhanced star formation sources are considered, the CT AGN hosts must be similar to the type 2 AGN hosts, regardless of host galaxy stellar population metallicity and IMF. Similarly, when the redshift evolution of AGN host SFR is included, the CT AGN hosts must be similar to the type 2 AGN hosts. Thus, if does not evolve with AGN Eddington ratio, then CT AGN and their hosts are expected to be a simple extension of the less obscured type 2 AGN population. This would require that AGN triggered by mergers be a small minority of the quasar population.
3.4.2 Evolving Model
The evolving model allows CT AGN to evolve independently of the less obscured type 2 AGN. Instead, is assumed to be Eddington ratio dependent. In order to fit the peak of the CXRB at 30 keV, the local CT AGN space density, and the 1 IR CT AGN space density, it is found that 86 of AGN with Eddington ratios 0.9 are CT, 60 of AGN with Eddington ratios 0.01 are CT, and 0 of AGN with intermediate Eddington ratios are CT.
As AGN with weaker accretion rates are observed to have older stellar populations (Kauffmann et al., 2003, 2004, 2007), the low Eddington ratio AGN are assumed to have the same mass distribution as the type 1 and type 2 AGN but an older stellar population and very little star formation. The age of the low Eddington ratio CT AGN host stellar populations are summarized in Table 1. If the low Eddington ratio CT AGN hosts have the same as the type 1 and type 2 AGN hosts, the near and mid-IR number counts are over-predicted. Increasing the dust in the low Eddington ratio CT AGN hosts to 1.0 brings the model predictions into agreement with the faint end of the IR number counts, as shown by the blue dot-dashed lines in Figure 7. The larger amount of dust in the CT AGN hosts as compared to the type 2 AGN hosts makes sense as only galaxies containing a large amount of dust will be able to host an AGN with CT levels of obscuration.
In the evolving model, the high Eddington ratio CT AGN hosts should be galaxies in a phase of rapid star formation and black hole growth. Therefore, the high Eddington ratio CT AGN hosts should be LIRGs or ULIRGs. Indeed we find that if the stellar populations of the high Eddington ratio CT AGN hosts have = 1012 L⊙ from star formation, 0.6, with a stellar population of age 0.3 Gyr which dominates , in agreement with the average stellar population of ULIRGs which host an AGN (Rodríguez Zaurín et al., 2010), the near and mid-IR number counts predictions are in agreement with deep observations. The high Eddington ratio CT AGN and host number counts are shown as the red dot-dashed lines in Figure 7. The over-prediction at the bright end of the number counts is due to the incompleteness of the survey at bright fluxes. As the GOODS fields cover only 0.1 deg2 (Treister et al., 2006), GOODS misses bright, rare objects. If the stellar population is assumed to be younger than 0.3 Gyr, the number counts are over-predicted. Similarly if the 0.6 or if the average 1011 M⊙, the number counts are over-predicted. Thus, the stellar population described here is the upper limit for how bright the high Eddington ratio CT AGN hosts can be without over-predicting the IR number counts.
The CT AGN host galaxies are also in good agreement with the other model constraints considered here. The CT AGN host contribution to the J band space density is shown as the dot-dashed lines in Figure 8, where the red lines refer to the high Eddington ratio CT AGN and their hosts and the blue lines refer to the low Eddington ratio CT AGN and their hosts. As expected the high Eddington ratio sources dominate the CT AGN and host contribution in the brighter magnitude bins while the low Eddington ratio sources dominate at the fainter magnitude bins. The optical colors are also in agreement with observations. The low Eddington ratio CT AGN hosts are on average redder and fainter than the type 1 and type 2 AGN hosts, while the high Eddington ratio CT AGN hosts are on average as bright or slightly brighter than the type 1 and type 2 AGN hosts but on average a little redder than the type 1 and type 2 AGN hosts. As with the non-evolving model, most of the CT AGN hosts lie below the empirical average ratio, as expected by the high levels of soft X-ray absorption fundamental to CT AGN. In Figure 9 the versus for CT AGN and their hosts are shown as the red squares with the low Eddington ratio objects shown as filled red squares and the high Eddington objects shown as open red squares. The same result is found when the host galaxy IMF or metallicity is varied.
As the high Eddington ratio CT AGN are a small fraction of the overall AGN population, the evolving model CT AGN hosts are not affected by the consideration of the enhanced star formation sources. Thus the CT AGN hosts of the evolving model are in agreement with the AGN evolution scenario where major mergers trigger nuclear starbursts and highly obscured AGN activity.
3.5 Evolution of
The evolution of , the type 2 AGN fraction, is important for understanding the AGN life cycle and how AGN and their host galaxies interact (e.g., Ballantyne et al., 2006a). In the unified model, is the covering factor of the dusty torus, and thus the evolution of shows a fundamental evolution of the torus parameters (Ballantyne et al., 2006b). Several studies suggest that evolves with and possibly also with redshift (e.g., Ueda et al., 2003; Simpson, 2005; Ballantyne et al., 2006a; Hasinger, 2008; Fabian et al., 2009; Winter et al., 2009). However, other studies find that it is not necessary for to evolve with (e.g., Lawrence & Elvis, 2010) nor with redshift (e.g., Gandhi & Fabian, 2003; Treister & Urry, 2005) in order to explain observations. Indeed, we find that the number counts and J band space density can be fit with a constant . For 0.4, the type 1 AGN and host B band luminosity function can also be satisfactorily fit with a constant . However, fitting the type 1 AGN and host B band luminosity function at 1 requires that is not constant. If is constant, the best fit 7.0 and the type 1 AGN and host B band luminosity function predicts a considerably larger population of B band magnitude, 23, 1 2 type 1 AGN than observed. Thus, it is found that in order to fit the type 1 AGN and host B band luminosity function at 1, must evolve with .
The argument for evolution of with redshift is less conclusive. Figure 10 shows the type 1 AGN and host B band luminosity function assuming that does not evolve with redshift, which gives = 6.5. When does evolve with redshift, the best fit = 4.3. While the for both the evolving and the non-evolving models do not represent formal good fits to the observed data points, the model in which does evolve with redshift provides a better fit to the data. In the scenario where does not evolve with redshift, it is necessary that at higher redshift the type 1 AGN host galaxies be dustier than locally. This is in contrast to the scenario where does evolve with redshift and type 1 AGN hosts are less dusty at higher redshift compared to the local population. In order to not over-predict the IR number counts, the type 2 AGN hosts must also be dustier at higher redshift than locally. Assuming that does not evolve with redshift has minimal affect on the J band space density, optical colors, and ratio.
A comparison of Figure 4 and Figure 10, suggests that not only evolves with , but also with redshift. Also, the model where evolves with both and redshift provides a better fit to the type 1 AGN and host B band luminosity function has measured by . As neither the evolving nor non-evolving models provide a formally good fit to the observed luminosity function, the possibility that does not evolve with redshift cannot be conclusively ruled out; however, the evolution of the B band type 1 AGN and host luminosity function suggests that does evolve with redshift. In order to fit the type 1 AGN and host B band luminosity function must evolve with .
3.6 Summary of Results
Using a variety of optical and near and mid-IR data, we have constrained the stellar populations of AGN host galaxies. Table 3 summarizes the average AGN host galaxy for different AGN spectral types. It is found that at 1 type 1 and type 2 AGN hosts are similar, but at 1 type 1 AGN hosts are less dusty than type 2 AGN hosts. The majority of AGN have an average SFR 2 M⊙ yr-1, however there is evidence of a population of enhanced star formation sources which account for 5–15 of the AGN population and has SFR 20 M⊙ yr-1. Also, it is found that if CT AGN evolve like type 2 AGN, then CT AGN hosts are similar to type 2 AGN hosts and if CT levels of obscuration are indicative of specific evolutionary stages in the AGN life cycle, then CT AGN hosts are also in specific evolutionary stages. Furthermore, it is shown that evolves with and is likely to evolve with redshift.
4 Discussion
4.1 Hosts of CT AGN
For both the evolving and non-evolving models, the CT AGN host stellar populations suffer from at least as much dust extinction as the type 2 AGN host stellar populations. Observations suggest that at least some of the observed extinction of heavily obscured AGN may be due to extended dust structures or molecular clouds within the host galaxy (Brand et al., 2007; Polletta et al., 2008; Martínez-Sansigre et al., 2010), so it is expected that the stellar populations of CT AGN will be enshrouded in dust. It is within the limits imposed by the model constraints for the high Eddington ratio CT AGN hosts to have an average which is in agreement with ULIRGs hosting AGN (Rodríguez Zaurín et al., 2010).
The AGN evolution scheme, in which mergers trigger large nuclear starbursts and AGN activity, claims that the AGN activity will initially be very highly obscured while the black hole grows very rapidly. As the black hole grows, the radiation pressure on surrounding dusty gas will increase until the AGN feedback blows out the obscuring material and halts the star formation in the host nuclear region (Sanders et al., 1988; Page et al., 2004; Rigopoulou et al., 2009; Hopkins et al., 2006). In this scheme CT AGN should have young stellar populations and possibly high levels of on going star formation. The non-evolving model places a lower limit on the stellar population age of 1 Gyr. However, when the enhanced star formation sources are included, the non-evolving model CT AGN hosts have similar stellar ages to the type 2 AGN hosts, in contrast to the expectations of the AGN evolution scheme. For the high Eddington ratio CT AGN in the evolving model, the lower limit on the stellar population age is 0.3 Gyr, the average stellar age of ULIRGs hosting an AGN (Rodríguez Zaurín et al., 2010). The low Eddington ratio CT AGN hosts of the evolving model can be of similar age as the type 1 and type 2 AGN, but the near and mid-IR predicted number counts are in better agreement with the observations if these AGN hosts have slightly older stellar populations than the average type 1 and type 2 AGN hosts. It has been demonstrated that galaxies hosting AGN with lower [OIII] luminosities have larger values for (4000 Å) compared to galaxies hosting AGN with high [OIII] luminosities (Kauffmann et al., 2003, 2004, 2007). Thus it is expected that AGN with lower Eddington ratios are in hosts with older stellar populations, in agreement with the findings of this study.
The stellar populations of CT AGN hosts for the evolving model and the non-evolving model are in agreement with the expectations from the AGN evolution scheme. The non-evolving model finds that the average CT AGN host has recently (1 Gyr ago) undergone a large burst of star formation, but that current star formation rates are more modest. The evolving model finds that high Eddington ratio CT AGN hosts have recently (0.3 Gyr ago) undergone a large burst of star formation and that current star formation rates may also be elevated. If the enhanced star formation sources are included, the non-evolving model AGN hosts have stellar populations of similar age as the type 2 AGN, and thus are in better agreement with the orientation based unified model than with the AGN evolution scheme. The evolving model CT AGN hosts are consistent with the AGN evolution scheme regardless of the inclusion of the enhanced star formation sources.
In summary, the non-evolving model CT AGN hosts are a simple extension of the type 2 AGN host population while the evolving model CT AGN are consistent with the paradigm where major mergers cause both intense starbursts and AGN activity. In the evolving model, low Eddington ratio CT AGN hosts will appear as galaxies with old and dusty stellar populations while the high Eddington ratio CT AGN hosts will appear as IR bright starburst galaxies.
4.2 Enhanced Star Formation in AGN Hosts
It is found that 5-15 of AGN hosts can be enhanced star formation sources with an average SFR 20 M⊙ yr-1, a factor of 10 higher than the majority of AGN hosts. This is expected to be a lower limit of the fraction of enhanced star formation sources as some sources may have such highly embedded star formation that the majority of the reprocessed emission due to star formation is at wavelengths longer than 24 m. Observations at longer wavelengths, such as in the far-IR with the Herschel or the millimeter/sub-mm regime with the Atacama Large Millimeter/submillimeter Array (ALMA), are necessary for uncovering the evolution of star formation rates in AGN hosts (Draper & Ballantyne, 2011). Even deep radio observations are a useful tool in determining the highly embedded star formation rates of AGN hosts (Ballantyne, 2009). Indeed, by stacking sub-mm observations of X-ray selected AGN, Lutz et al. (2010) found that the average AGN host SFR 30 M⊙ yr-1. Furthermore, Lutz et al. (2010) found that the AGN host SFR evolves strongly with redshift but with evidence of luminosity dependent evolution only for the highest luminosity AGN. In the scenario where AGN host SFRs are not luminosity dependent, it is found that more than half of AGN hosts can be enhanced star formation sources.
The fact that the mid-IR AGN and host number counts are over-predicted by an average SFR 2 M⊙ yr-1, despite observational evidence that there is a population of AGN with an average SFR an order of magnitude higher than this upper limit, suggests that there are two populations of AGN. The majority of AGN hosts, at least at 1, have SFRs similar to local spiral galaxies and 5-15 of AGN hosts have markedly higher SFRs. The existence of these two populations of AGN hosts can be interpreted in two complimentary ways. The first interpretation is that the AGN hosted by galaxies with enhanced SFRs are being fueled by different mechanisms than the lower star formation objects. At 1, the lower star formation objects are likely dying quasars which were triggered by major mergers while the enhanced star formation objects are likely Seyferts which are both fueled and obscured by circumnuclear starburst disks, as investigated by Ballantyne (2008). The other interpretation is that all AGN are fueled by processes related to nuclear starbursts, whether those starbursts are triggered by mergers or through secular processes, and on average, the nuclear starburst phase overlaps with the active AGN phase for 5-15 of the AGN lifetime. Further exploration of these two populations of AGN hosts is necessary to determine the processes which trigger and fuel AGN activity.
4.3 Methods for Finding CT AGN
It is well documented that the integrated emission of AGN observed in deep X-ray surveys is insufficient to account for the intensity of the CXRB at 30 keV and that the shape of the CXRB necessitates that the missing population of AGN be highly obscured (e.g., Ballantyne et al., 2006a; Draper & Ballantyne, 2009; Treister et al., 2009b). Given the uncertainties of the normalization of the CXRB and the AGN hard X-ray luminosity functions, different models predict vastly different numbers of missing CT AGN (e.g., Gilli et al., 2007; Draper & Ballantyne, 2009; Treister et al., 2009b). As these highly obscured AGN are missed in deep X-ray surveys (Hasinger, 2008), it is important to consider other methods to identify the elusive CT AGN population.
One possibility is that the majority of X-ray bright optically inactive galaxies (XBONGs) host CT AGN (Fiore et al., 2008, 2009; Treister et al., 2009a; Rovilos et al., 2010). XBONGs are X-ray sources found in deep surveys which have no optical counterparts with 25.5 and make up a substantial portion of deep survey X-ray sources (Aird et al., 2010). It is thought that these sources are either heavily obscured AGN and/or high redshift quasars (Alexander et al., 2001; Mainieri et al., 2005; Rovilos et al., 2010). Considering the sources above the dotted horizontal line in Figures 3 and 9 suggests that a small fraction of optically faint X-ray sources may be CT AGN, but the majority of this population is 1 type 2 AGN. Thus it is unlikely that XBONGs host the majority of the missing CT AGN population.
Another method used to identify CT AGN candidates is to search for infrared bright sources which have an infrared excess, usually defined by 1000, where is the 24 m flux (e.g. Polletta et al., 2006; Alexander et al., 2008; Donley et al., 2008; Fiore et al., 2008, 2009; Treister et al., 2009a). Some concern has been raised that this method will also pick out lower redshift type 2 AGN masquerading as high redshift CT AGN (Georgakakis et al., 2010). We therefore investigate the population of AGN selected by the infrared excess criteria.
Fiore et al. (2008) suggest that using the criteria 1000 and - 4.5 selects a distinct class of sources, the majority of which are CT AGN. However, according to both the evolving and non-evolving model CT AGN and host SEDs developed here, the Fiore et al. (2008) criteria selects low to moderately X-ray bright AGN at moderate to high redshift. The vast majority of the selected AGN are obscured, but a significant fraction are still Compton thin. Similarly, Donley et al. (2008) find that the Fiore et al. (2008) criteria is likely to select dusty star forming templates and low X-ray flux AGN. However, Donley et al. (2008) find no evidence that the selected AGN are CT.
A more effective method of identifying CT AGN candidates is based on the selection criteria of Polletta et al. (2008): 1000 and 1.0 mJy. Furthermore, it appears that samples with a lower limit, such as 700 Jy or even 550 Jy, also contain a large fraction of highly obscured AGN (Donley et al., 2010, and references therein). Fainter samples of infrared bright galaxies are found to be predominately powered by star formation rather than by AGN (e.g., Pope et al., 2008). Figure 11a shows that representatives of all spectral types of AGN can be found with 1000 and 550 Jy. These sources will be located at all redshifts. However, the majority of type 1 and type 2 AGN are bright in the soft X-ray. For both the evolving and non-evolving models, the vast majority of infrared excess AGN with 550 Jy and f0.5-2 10-15 erg cm-2 s-1 are CT AGN, as shown in Figure 11b. Figure 12b, which shows the redshift distribution of the CT AGN with f0.5-2 10-15 erg cm-2 s-1, illustrates that these X-ray faint CT AGN are located at all redshifts. For the evolving model the vast majority of these CT AGN are high Eddington ratio sources. This criteria will select a small number of type 2 AGN with enhanced star formation, but the majority of sources selected in this manner are indeed CT.
If an infrared excess AGN has 10-16 erg cm-2 s-1 and 550 Jy, than the AGN is CT and located at 2. This is true for both the evolving and non-evolving models. An interesting consequence of this is that a size-able population of 2 CT AGN should have 10-15 10-16 erg s-1 cm-2. According to the evolving model, nearly all of the 10-16 erg cm-2 s-1 sources are high Eddington ratio sources and according to the non-evolving model these low X-ray flux sources are nearly all enhanced star formation sources. It is therefore expected that X-ray stacking of IR bright sources with 1000 and low soft X-ray flux will yield a large fraction of the 2 high luminosity CT AGN population. This shows that combining observations in multiple spectral regions, such as mid-IR, optical, and X-ray observations, is the most efficient way of identifying CT AGN candidates.
Identifying and characterizing the elusive CT AGN population is a necessary part of understanding the history of accretion and galaxy evolution. However, due to the observational challenges of studying highly obscured sources, multi-wavelength investigations are necessary to identify and understand the nature of CT AGN.
4.4 Implications for the Unified Model and AGN Fueling Mechanisms
Several recent studies suggest that there are two distinct processes which lead to AGN activity, secular evolution and merger events (e.g., Ballantyne et al., 2006a; Hasinger, 2008; Hopkins & Hernquist, 2009; Lutz et al., 2010). In the latter paradigm, quasar activity is activated by galaxy mergers which cause gas and dust to be funneled into the nuclear region (e.g., Sanders et al., 1988; Fabian, 1999; Page et al., 2004; Hopkins et al., 2006), whereas moderate luminosity AGN are fueled by gravitational instabilities internal to the host galaxy or through minor interactions (e.g., Crenshaw et al., 2003; Kormendy & Kennicutt, 2004; Pierce et al., 2007; Shapiro et al., 2008). It is probable that if different forms of AGN activity are caused by contrasting fueling mechanisms, the relationship between various AGN spectral types may be different for the high and moderate luminosity populations.
This study finds that the average type 1 and type 2 AGN hosts have similar stellar populations and similar levels of dust attenuation at 1. At 1 type 1 and type 2 AGN hosts appear to be fundamentally different. Even though the high redshift type 1 and type 2 hosts have similar stellar populations, the type 1 AGN and host B band luminosity function requires that type 1 AGN hosts have significantly lower levels of dust extinction than what is required for type 2 AGN hosts to be in agreement with the observed near and mid-IR number counts. At 1, type 1 AGN hosts are intrinsically less dusty than type 2 AGN hosts. This suggests that the orientation based unified model works well for describing the local Seyfert population, but may not be appropriate for the high redshift, high luminosity quasar population. This conclusion is consistent with the findings of several other recent studies (e.g., Ballantyne et al., 2006b; Hopkins & Hernquist, 2009; Draper & Ballantyne, 2010; Lutz et al., 2010). For galaxies which are evolving secularly, the unified model appears to be an apt description. However, the violent growth experienced by black holes and their host bulges during major merger events does not appear to fit into the orientation based unified scheme.
It is likely that different AGN fueling mechanisms will result in different relationships between AGN spectral types. In the merger scenario, young AGN are highly obscured and old quasars are unobscured (e.g., Sanders et al., 1988; Fabian, 1999; Page et al., 2004; Hopkins et al., 2006). Different spectral types of AGN fueled by secular processes related to nuclear starbursts are expected to be in agreement with the orientation based unified model due to the disky nature of the nuclear starburst which is likely to both fuel and obscure the AGN (e.g., Ballantyne, 2008). In the evolving model, it is found that mergers can play a strong role in fueling high , 1 quasars. However, in the non-evolving model, when the enhanced star formation sources are considered, it appears that the dominant fueling mechanism is not mergers. Instead, the difference between spectral types may only be that some galaxies have less dust and gas than others at 1. In the non-evolving model, it appears that secular processes are the dominate AGN fueling mechanism at all redshift. For both the evolving and non-evolving model, at 1 the processes which lead to AGN activity are most likely secular. However, the findings of this study suggest that the dominant AGN fueling process changes at 1, since at 1 the average type 1 and type 2 AGN hosts are more similar than at higher redshift. In order to understand the mechanisms which trigger and fuel AGN, it is important for future studies to pay careful attention to which fueling mechanisms are dominant in different subsets of the AGN population.
Thus, it has been shown that the relationship between different AGN spectral types is a helpful tool for understanding the dominant processes responsible for triggering and fueling AGN activity. It is found that at 1 the orientation based unified model holds, suggesting that the dominant AGN fueling mechanisms at 1 are secular processes. At 1, the orientation based unified model does not seem to hold. The evolving CT AGN model suggests that at 1 mergers are an important AGN fueling mechanism; however, the non-evolving CT AGN model suggests that even at 1 the dominant AGN fueling mechanisms are secular processes and that mergers play only a minor role in fueling AGN at all redshifts.
4.5 and redshift Evolution of
Understanding the evolution of is an important step in understanding the nature of AGN obscuration and the interplay between an AGN and it’s host galaxy. If evolves with AGN , this suggests that the obscuring material is close enough to the central engine that dust sublimation (Lawrence, 1991) and/or radiation pressure fed winds (Königl & Kartje, 1994) affect portions of the obscuring material. If evolves with redshift this would indicate that the evolution of the obscuring material is somehow connected to the evolution of the host galaxy (Ballantyne et al., 2006b). While most model constraints used in this study are not very sensitive to the evolution of , the type 1 AGN and host B band luminosity function does prove to be a valuable test of the evolution of . This study finds that must evolve with AGN and that probably evolves with redshift.
If does not evolve with , the predicted 1 2 type 1 AGN and host B band luminosity functions are not in agreement with observations. Using the host galaxy stellar population age and as free parameters does not allow for an appropriate fit to the data. The over-prediction of 23 sources at 1 2 is not due to observational bias as 23 is significantly brighter than the depth of B band coverage accessible to surveys (e.g., B band 5 level for COSMOS is = 26.7; Scoville et al., 2007). Lawrence & Elvis (2010) argue that does not evolve with and that apparent evolution of with is due to X-ray observational biases. However, the 1 type 1 AGN and host B band luminosity function data used here is based on optical selection criteria (Hartwick & Schade, 1990; Croom et al., 2004). The Della Ceca et al. (1996) type 1 AGN and host B band luminosity function does use a sample defined through X-ray selection, and the 0.4 predicted type 1 AGN and host B band luminosity function is in reasonable agreement with observation even if does not evolve with . This suggests that X-ray observational biases do not create an artificial evolution of with . Therefore, at least for 1, must evolve with .
While this study cannot rule out the possibility that is constant with redshift, our findings suggest that does evolve mildly with redshift. While some studies suggest that must evolve with redshift (e.g. La France et al., 2005; Ballantyne et al., 2006a, b; Treister & Urry, 2006), the evidence is still tentative. If AGN are fueled by different mechanisms, one might assume that the type 1/type 2 ratio will be different for the different mechanisms. Therefore, if different mechanisms dominate during different epochs, the type 1/type 2 ratio should also include some redshift evolution. It is possible that the slower secular evolution processes of Seyfert galaxies do not require evolution of with redshift or that the evolution is very mild, since this form of galaxy evolution is governed by stochastic processes. However, in the quasar regime, where AGN fueling is initiated by major mergers, a stronger evolution of with redshift may be necessary. Indeed, the type 1 AGN and host B band luminosity function which is least well fit by a non-evolving is the highest redshift bin considered, which is the redshift bin closest to the peak of quasar activity. While this study does not conclusively show that evolves with redshift, the findings presented here suggest that does exhibit some evolution with redshift.
It is found that evolves with and is likely to evolve with redshift. This suggests that the obscuring medium is close enough to the central engine to be affected by dust sublimation (Lawrence, 1991) and/or radiation pressure fueled winds (Königl & Kartje, 1994). Also, the type 1 AGN and host B band luminosity function is an excellent X-ray independent tool to test the fraction of type 1 AGN predicted by X-ray observations.
5 Summary
By applying observational constraints at optical through mid-IR wavelengths to AGN host stellar population models, the average stellar properties of AGN hosts have been constrained and hard X-ray through mid-IR SEDs have been developed which include emission from the AGN and the host galaxy stellar population and dust enshrouded star formation222AGN and host SEDs are available by contacting the authors.. The findings of this study are summarized as follows.
•Type 1 and type 2 AGN hosts have similar stellar populations at 1.
•At 1, type 1 and type 2 AGN hosts have stellar populations of similar age, but type 1 AGN hosts are intrinsically less dusty than type 2 AGN hosts.
•The orientation based unified model provides a good description of the 1 Seyfert population. The unified model does not seem to hold at 1, where quasar activity triggered by major mergers becomes more prevalent.
•Multi-wavelength data is consistent with the paradigm in which (high Eddington ratio) CT AGN have recently undergone intense star formation. In the non-evolving model the AGN activity does not start until the starburst is 1 Gyr old and the stellar population is highly obscured by dust. In the evolving model, it is possible that the average high Eddington ratio CT AGN host galaxy is a LIRG or ULIRG, with the AGN activity starting one average 0.3 Gyr after the starburst.
•5-15 of the type 1 and type 2 AGN population may have enhanced levels of star formation, with average SFR 20 M⊙ yr-1.
•If the enhanced star formation sources are included, the evolving model CT AGN hosts are unaffected, but the non-evolving model CT AGN hosts are not consistent with the AGN evolution scheme and instead are consistent with the orientation based unified scheme. Thus, if CT AGN are similar to type 2 AGN, then CT AGN host galaxies are similar to type 2 AGN host galaxies; however, if CT AGN are a distinct population of AGN in a special evolutionary stage, then the host galaxies of CT AGN are also in a special evolutionary stage.
•In order to fit the type 1 AGN and host B band luminosity function it is necessary for to evolve with . However, future work studying the dependence of on redshift is necessary to elucidate the connection between AGN and their hosts. Understanding the redshift evolution of will offer insight into how AGN are fueled and the nature of AGN obscuration.
•While the actual values of depend on the metallicity and IMF used in the Bruzual & Charlot (2003) host galaxy population synthesis model, the qualitative findings of this study are independent of, and robust against the uncertainties in, the host galaxy metallicity and IMF.
References
- Aird et al. (2010) Aird, J., et al., 2010, MNRAS, 401, 2531
- Alexander et al. (2001) Alexander, D.M., Brandt, W. N., Hornschemeier, A. E., Garmire, G. P., Schneider, D. P., Bauer, F. E., & Griffiths, R. E., 2001, AJ, 122, 2156
- Alexander et al. (2008) Alexander, D.M., et al., 2008, ApJ, 687, 835
- Antonucci (1993) Antonucci, R., 1993, ARA&A, 31, 473
- Assef et al. (2011) Assef, R.J., et al., 2011, ApJ, 728, 56
- Ballantyne et al. (2006a) Ballantyne, D.R., Everett, J.E., & Murray, N., 2006a, ApJ, 639, 740
- Ballantyne et al. (2006b) Ballantyne, D.R., Shi, Y., Rieke, G.H., Donley, J.L, Papovich, C., & Rigby, J.R., 2006b, ApJ, 653, 1070
- Ballantyne (2008) Ballantyne, D.R., 2008, ApJ, 685, 787
- Ballantyne (2009) Ballantyne, D.R., 2009, ApJ, 698, 1033
- Balogh et al. (1999) Balogh, M.L., Morris, S.L., Yee, H.K.C., Carlberg, R.G., & Ellingson, E., 1999, ApJ, 527, 54
- Bluck et al. (2011) Bluck, A.F.L., Conselice, C.J., Almaini, O., Laird, E.S., Nandra, K., & Grützbauch, R., 2011, MNRAS, 410, 1174
- Brand et al. (2007) Brand, K., et al., 2007, ApJ, 663, 204
- Brandt et al. (2001) Brandt, W.N., et al., 2001, AJ, 122, 1
- Brusa et al. (2009) Brusa, M., et al., 2009, A&A, 507, 1277
- Bruzual & Charlot (2003) Bruzual, G. & Charlot, S., 2003, MNRAS, 344, 1000
- Cardamone et al. (2010) Cardamone, C.N., Urry, C.M., Schawinski, K., Treister, E., Brammer, G., & Gawiser, E., 2010, ApJ, 721, L38
- Chabrier (2003) Chabrier, G., 2003, PASP, 115, 763
- Chen et al. (2009) Chen, Y.-M., Wang, J.-M., Yan, C.-S., Hu, C., & Zhang, S., 2009, ApJ, 695, L130
- Crenshaw et al. (2003) Crenshaw, D.M., Kraemer, S.B., & Gabel, J.R., 2003, AJ, 126, 1690
- Croom et al. (2004) Croom, S. M., Smith, R. J., Boyle, B. J., Shanks, T., Miller, L., Outram, P. J., & Loaring, N. S., 2004, MNRAS, 349, 1397
- Dahlen et al. (2007) Dahlen, T., Mobasher, B., Dickinson, M., Ferguson, H. C., Giavalisco, M., Kretchmer, C., & Ravindranath, S., 2007, ApJ, 654, 172
- Davies et al. (2007) Davies, R.I., Müller Sánchez, F., Genzel, R., Tacconi, L.J., Hicks, E.K.S., Friedrich, S., & Sternberg, A., 2007, ApJ, 671, 1388
- Della Ceca et al. (1996) Della Ceca, R., Zamorani, G., Maccacaro, T., Setti, G., & Wolter, A., 1996, ApJ, 465, 650
- Donley et al. (2010) Donley, J.L., Rieke, G.H., Alexander, D.M., Egami, E., & Pérez-González, P.G., 2010, ApJ, 719, 1393
- Donley et al. (2008) Donley, J.L., Rieke, G.H., Pérez-González, P.G., & Barro, G., 2008, ApJ, 687, 111
- Draper & Ballantyne (2011) Draper, A.R. & Ballantyne D.R., 2011, ApJ, 729, 109
- Draper & Ballantyne (2010) Draper, A.R. & Ballantyne D.R., 2010, ApJ, 715, L99
- Draper & Ballantyne (2009) Draper, A.R. & Ballantyne D.R., 2009, ApJ, 707, 778
- Dunne et al. (2003) Dunne, L., Eales, S.A., & Edmunds, M.G., 2003, MNRAS, 341, 589
- Faber et al. (2007) Faber, S.M., et al., 2007, ApJ, 665, 265
- Fabian (1999) Fabian, A.C., 1999, MNRAS, 308, L39
- Fabian & Barcons (1992) Fabian, A.C. & Barcons, X., 1992, ARA&A, 30, 429
- Fabian et al. (2008) Fabian, A.C., Vasudevan, R.V., Gandhi, P., 2008, MNRAS, 385, L43
- Fabian et al. (2009) Fabian, A.C., Vasudevan, R.V., Mushotzky, R.F., Winter, L.M., & Reynolds, C.S., 2009, MNRAS, 394, L89
- Ferland et al. (1998) Ferland, G.J., Korista, K.T., Verner, D.A., Ferguson, J.W., Kingdon, J.B., & Verner, E.M., 1998, PASP, 110, 761
- Fiore et al. (2008) Fiore, F., et al., 2008, ApJ, 672, 94
- Fiore et al. (2009) Fiore, F., et al., 2009, ApJ, 693, 447
- Fu et al. (2010) Fu, H., et al., 2010, ApJ, 722, 653
- Gandhi & Fabian (2003) Gandhi, P. & Fabian, A.C., 2003, MNRAS, 339, 1095
- Georgakakis et al. (2009) Georgakakis, A., Clements, D.L., Bendo, G., Rowan-Robinson, M., Nandra, K., & Brotherton, M.S., 2009, MNRAS, 394, 533
- Georgakakis et al. (2010) Georgakakis, A., Rowan-Robinson, M., Nandra, K., Digby-North, J., Pérez-González, P. G., & Barro, G., 2010, MNRAS, 406, 420
- Ghisellini et al. (1994) Ghisellini, G., Haardt, R., & Matt, G., 1994, MNRAS, 267, 743
- Gilli et al. (2007) Gilli, R., Comastri, A., Hasinger, G., 2007, A&A, 463, 79
- González-Martín et al. (2009) González-Martín, O., Masegosa, J., Márquez, I., & Guainazzi, M., 2009, ApJ, 704, 1570
- Griffiths & Stern (2010) Griffiths, R.L. & Stern, D., 2010, AJ, 140, 533
- Hartwick & Schade (1990) Hartwick, F.D.A & Schade, D., 1990, ARA&A, 28, 437
- Hasinger (2008) Hasinger, G., 2008, A&A, 490, 905
- Hickox et al. (2009) Hickox, R.C., et al., 2009, ApJ, 696, 891
- Hopkins & Hernquist (2009) Hopkins, P.F. & Hernquist, L., 2009, ApJ, 694, 599
- Hopkins et al. (2006) Hopkins, P.F., Hernquist, L., Cox, T.J., DiMatteo, T., Roberson, B., & Springel, V., 2006, ApJS, 163, 1
- Kauffmann et al. (2007) Kauffmann, G., et al., 2007, ApJS, 173, 357
- Kauffmann et al. (2004) Kauffmann, G., White, S.D.M., Heckman, T.M., Ménard, B., Brinchmann, J., Charlot, S., Tremonti, C., & Brinkmann, J., 2004, MNRAS, 353, 713
- Kauffmann et al. (2003) Kauffmann, G., et al., 2003, MNRAS, 346, 1055
- Kennicutt (1998) Kennicutt, R.C., 1998, ARA&A, 36, 189
- Kim et al. (2006) Kim, M., Ho, L.C., Im, M., 2006, ApJ, 642, 702
- Königl & Kartje (1994) Königl, A. & Kartje, J.F., 1994, ApJ, 434, 446
- Kormendy & Kennicutt (2004) Kormendy, J. & Kennicutt, R.C., 2004, ARA&A, 42, 603
- Kormendy & Richstone (1995) Kormendy, J. & Richstone, D., 1995, A&A, 33, 581
- Kumar & Johnson (2010) Kumar, P. & Johnson, J.L., 2010, MNRAS, 404, 2170
- La France et al. (2005) La Franca, F., et al., 2005, ApJ, 635, 864
- Lawrence (1991) Lawrence, A., 1991, MNRAS, 252, 586
- Lawrence & Elvis (2010) Lawrence, A. & Elvis, M., 2010, ApJ, 714, 561
- Lee et al. (2009) Lee, J.C., et al., 2009, ApJ, 706, 599
- Lutz et al. (2010) Lutz, D., et al., 2010, ApJ, 712, 1287
- Mainieri et al. (2005) Mainieri, V., et al., 2005, A&A, 437, 805
- Martínez-Sansigre et al. (2010) Martínez-Sansigre, A., et al., 2010, ApJ, 706, 184
- McKernan et al. (2010a) McKernan, B., Ford, K.E.S., & Reynolds, C.S., 2010a, MNRAS, 407, 2399
- McKernan et al. (2010b) McKernan, B., Maller, A., & Ford, K.E.S., 2010b, ApJ, 718, L83
- Melbourne et al. (2011) Melbourne, J., et al., 2011, AJ, in press
- Nardini & Risaliti (2011) Nardini, E. & Risaliti, G., 2011, MNRAS, in press
- Page et al. (2004) Page, M.J., Stevens, J.A., Ivison, R.J., & Carrera, F.J., 2004, ApJ, 611, L85
- Pierce et al. (2010) Pierce, C.M., et al., 2010, MNRAS, 408, 139
- Pierce et al. (2007) Pierce, C.M., et al., 2007, ApJ, 660, L19
- Polletta et al. (2008) Polletta, M., Weedman, D., Hönig, S., Lonsdale, C.J., Smith, H.E., & Houck, J., 2008, ApJ, 675, 960
- Polletta et al. (2006) Polletta, M.d.C., et al., 2006, ApJ, 642, 673
- Pope et al. (2008) Pope, A., et al., 2008, ApJ, 689, 127
- Rieke et al. (2009) Rieke, G.H., Alonso-Herrero, A., Weiner, B.J., Pérez-González, P.G., Blaylock, M., Donley, J.L., & Marcillac, D., 2009, ApJ, 692, 556
- Rigopoulou et al. (2009) Rigopoulou, D., et al., 2009, MNRAS, 400, 1199
- Risaliti et al. (1999) Risaliti, G., Maiolino, R., & Salvati, M., 1999, ApJ, 522, 157
- Rodríguez Zaurín et al. (2010) Rodríguez Zaurín, J., Tadhunter, C.N., & González Delgado, R.M., 2010, MNRAS, 403, 1317
- Rovilos et al. (2011) Rovilos, E., Fotopoulou, S., Salvato, M., Burwitz, V., Egami, E., Hasinger, G., & Szokoly, G., 2011, A&A, in press
- Rovilos et al. (2010) Rovilos, E., Georgantopoulos, I., Akylas, A., & Fotopoulou, S., 2010, A&A, 522, 11
- Salpeter (1955) Salpeter, E.E., 1955, ApJ, 121, 161
- Sanders et al. (1988) Sanders, D.B., Soifer, B.T., Elias, J.H., Madore, B.F., Matthews, K., Neugebauer, G., & Scoville, N.Z., 1988, ApJ, 325, 74
- Santini et al. (2010) Santini, P., et al., 2010, A&A, 518, L154
- Schawinski et al. (2007) Schawinski, K., Thomas, D., Sarzi, M., Maraston, C., Kaviraj, S., Joo, S.-J., Yi, S.K., & Silk, J., 2007, MNRAS, 382, 1415
- Scoville et al. (2007) Scoville, N., et al., 2007, ApJS, 172, 38
- Serjeant et al. (2010) Serjeant, S., et al., 2010, A&A, 518, L7
- Serjeant & Hatziminaoglou (2009) Serjeant, S. & Hatziminaoglou, E., 2009, MNRAS, 397, 265
- Seymour et al. (2011) Seymour, N., et al., 2011, MNRAS, 413, 1777
- Shapiro et al. (2008) Shapiro, K.L., et al., 2008, ApJ, 682, 231
- Shi et al. (2009) Shi, Y., Rieke, G.H., Ogle, P., Jiang, L., & Diamond-Stanic, A.M., 2009, ApJ, 703, 1107
- Silverman et al. (2009) Silverman, J.D., et al., 2009, ApJ, 695, 171
- Simpson (2005) Simpson, C., 2005, MNRAS, 360, 565
- Smolčić & Riechers (2011) Smolčić, V. & Riechers, D.A., 2011, ApJ, in press
- Terashima & Wilson (2003) Terashima, Y., & Wilson, A.S., 2003, ApJ, 583, 145
- Thompson et al. (2009) Thompson, G.D., Levenson, N.A., Uddin, S.A., Sirocky, M.M., 2009, ApJ, 697, 182
- Thompson et al. (2005) Thompson, T.A., Quataert, E., & Murray, N., 2005, ApJ, 630, 167
- Treister et al. (2006) Treister, E., et al., 2006, ApJ, 640, 603
- Treister et al. (2009a) Treister, E., et al., 2009, ApJ, 706, 535
- Treister et al. (2009b) Treister, E., Urry, C.M., & Virani, S., 2009, ApJ, 696, 110
- Treister et al. (2010) Treister, E., Natarajan, P., Sanders, D.B., Urry, C.M., Schawinski, K., & Kartaltepe, J., 2010, Science, 328, 600
- Treister & Urry (2006) Treister, E. & Urry, C.M., 2006, ApJ, 652, L79
- Treister & Urry (2005) Treister, E., & Urry, C.M., 2005, ApJ, 630, 115
- Ueda et al. (2003) Ueda, Y., Akiyama, M., Ohta, K., &Miyaji, T., 2003, ApJ, 598, 886
- Wilman et al. (2010) Wilman, R.J., Jarvis, M.J., Mauch, T., Rawlings, S., & Hickey, S., 2010, MNRAS, 405, 447
- Winter et al. (2009) Winter, L.M., Mushotzky, R.F., Reynolds, C.S., & Tueller, J., 2009, ApJ, 690, 1322
- Wold et al. (2010) Wold, I., Sheinis, A.I., Wolf, M.J., & Hooper, E.J., 2010, MNRAS, 408, 713
| Type 1 and 2 AGN host | Low Eddington ratio CT AGN host¶¶The Low Eddington ratio CT AGN hosts are only relevant in the evolving model. The age of the stellar population of the evolving model high Eddington ratio CT AGN hosts is the same in all bins and is shown in the bottom row of Table 3. | |||
|---|---|---|---|---|
| YSP††Younger Stellar Population | DSP‡‡Dominant Stellar Population | YSP††Younger Stellar Population | DSP‡‡Dominant Stellar Population | |
| (0.1) | (0.9) | (0.1) | (0.9) | |
| 0.5 | 2.0 | 7.0 | 4.5 | 10 |
| 0.5 1 | 2.0 | 7.0 | 4.5 | 7.0 |
| 1 2 | 2.0 | 4.5 | 4.5 | 4.5 |
| 2 3 | 2.0 | 2.0 | 2.0 | 2.0 |
| 3 | 1.0 | 1.0 | 1.0 | 1.0 |
| Model | Unified/type 2 AGN host | Type 1 AGN host | |||
|---|---|---|---|---|---|
| IMF | Metallicity | 1 | 1 | 1 | 1 |
| Chabrier (2003) | 0.25 | 0.5 | 0.25 | 0.05 | |
| Chabrier (2003) | 0.2 | 0.3 | 0.5 | 0.3 | 0.1 |
| Chabrier (2003) | 2.5 | 0.2 | 0.7 | 0.1 | 0.05 |
| Salpeter (1955) | 0.1 | 0.1 | 0.1 | 0.0 | |
| AGN population | Stellar population age | SFR | ||
|---|---|---|---|---|
| (Gyr) | 1 | 1 | (M⊙ yr-1) | |
| Type 1 AGN | col 2 & 3 Table 1 | 0.25 | 0.05 | 2.0 (20) |
| Unified/type 2 AGN | col 2 & 3 Table 1 | 0.25 | 0.5 | 2.0 (20) |
| Non-evolving model CT AGN | ||||
| w/o enhanced star formation sources | 1.0 | 1.0 | 1.0 | 10 |
| w/ enhanced star formation sources | col 2 & 3 Table 1 | 0.25 | 0.5 | 2.0 (20) |
| Evolving model CT AGN | ||||
| Low Eddington ratio CT AGN | col 4 & 5 Table 1 | 1.0 | 1.0 | 1.0 |
| High Eddington ratio CT AGN | 0.3 | 0.6 | 0.6 | 175 |
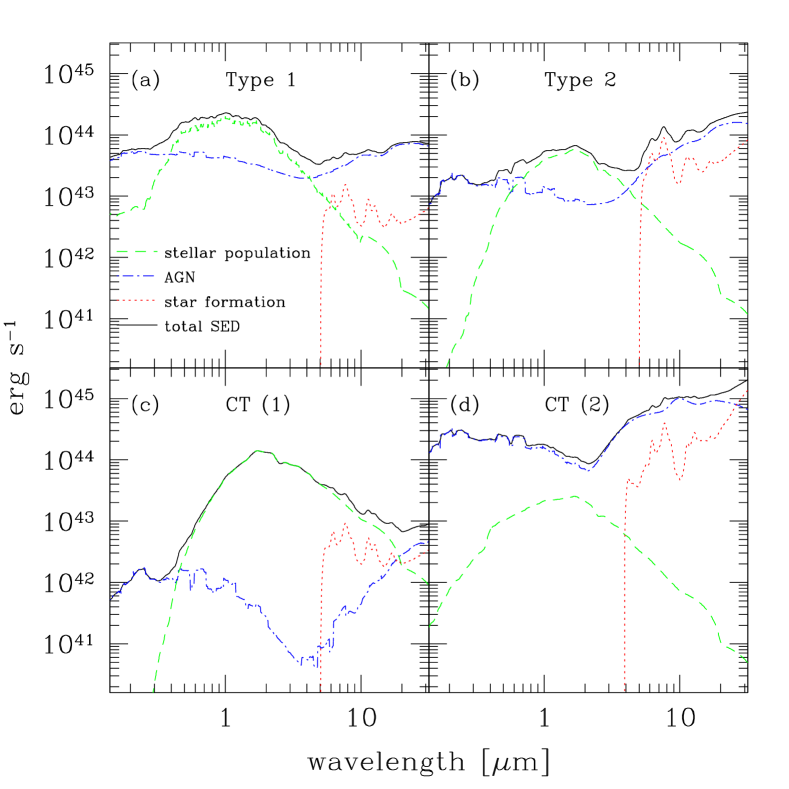
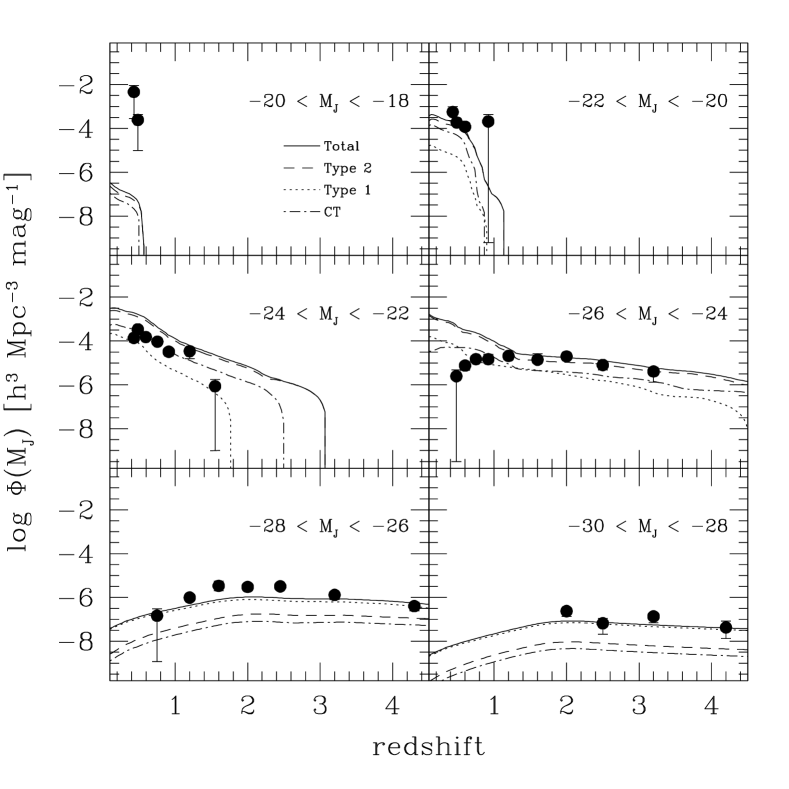
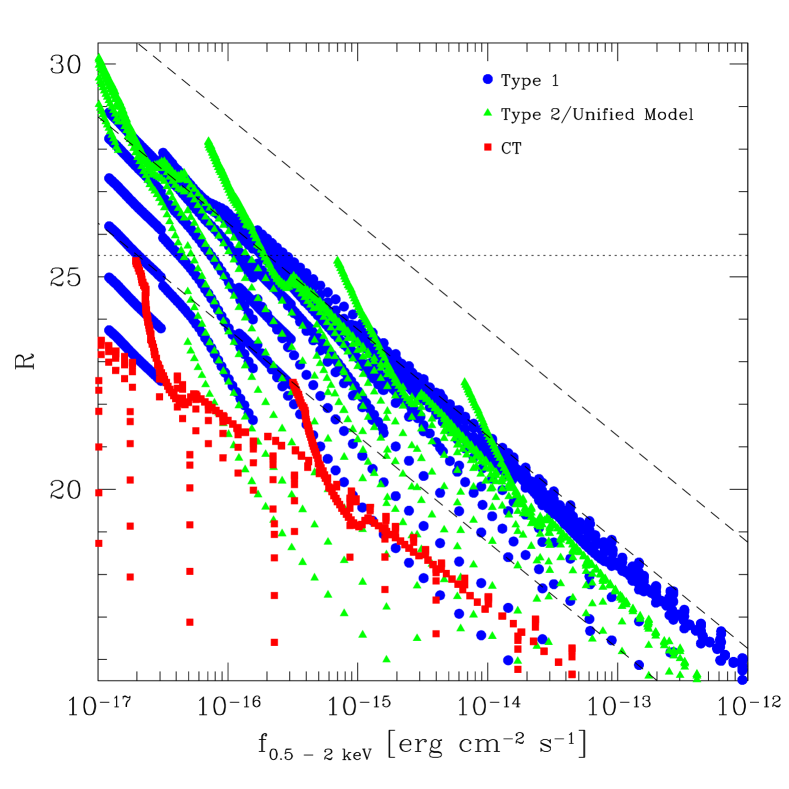
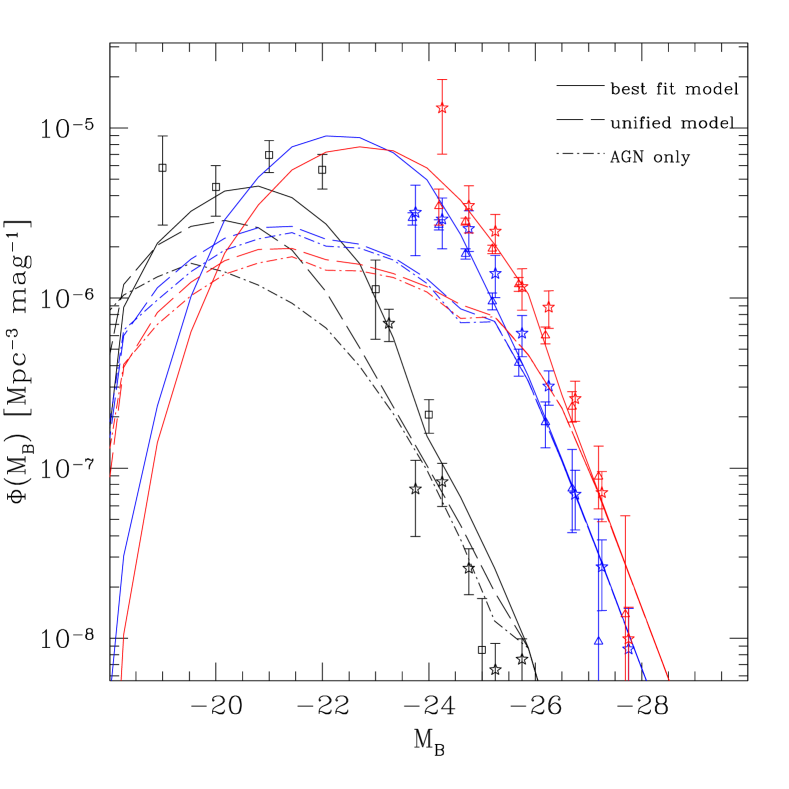
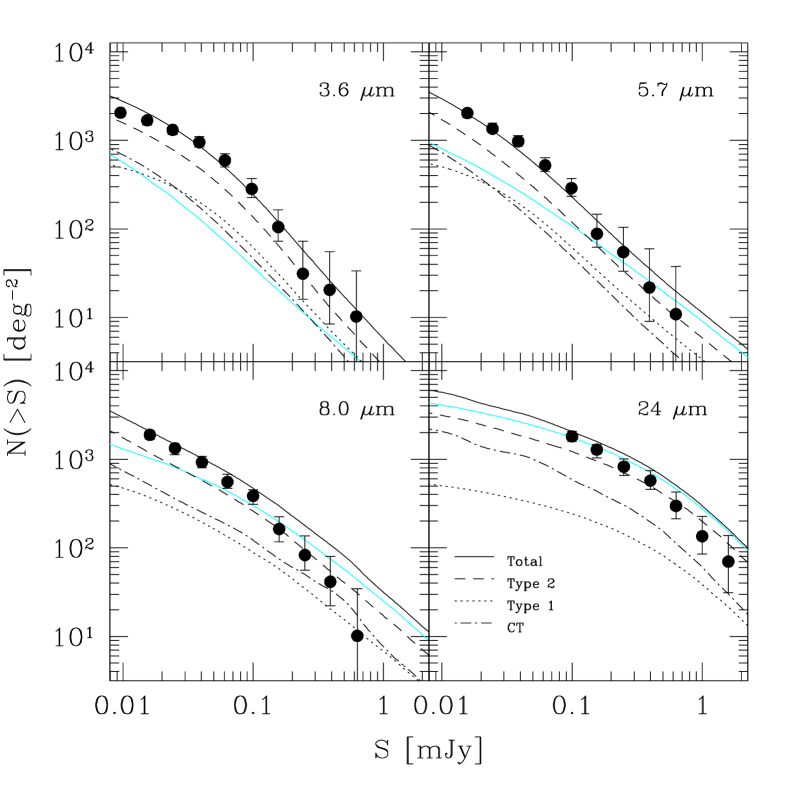
=