22institutetext: Institute of Astronomy & Astrophysics, National Observatory of Athens, Palaia Penteli, 15236, Athens, Greece
33institutetext: Max-Planck Institut für Extraterrestrische Physik, Giessenbachstrasse 2, 85748 Garching, Germany
On the Lx-L ratio as a diagnostic for Compton-thick AGN
As the mid-IR luminosity represents a good isotropic proxy of the AGN power, a low X-ray to mid-IR luminosity ratio is often claimed to be a reliable indicator for selecting Compton-thick AGN. We assess the efficiency of the X-ray to mid-IR luminosity ratio diagnostic by examining the 12 IRAS AGN sample (intrinsic ) for which high signal-to-noise XMM-Newton observations have been recently become available. We find that the vast majority (ten out of eleven) of the AGN that have been classified as Compton-thick on the basis the X-ray spectroscopy by Brightman & Nandra present a low luminosity ratio, i.e. lower than a few percent of the average AGN ratio which is typical of reflection-dominated Compton-thick sources. We note that at low ratios we also find a comparable number of AGN, most of which are heavily absorbed but not Compton-thick. This implies that although most Compton-thick AGN present low ratios, at least in the local, Universe, the opposite is not necessarily true. Next, we extend our analysis to higher redshifts. We perform the same analysis in the Chandra Deep Field South where excellent quality Chandra (4 Ms) and XMM-Newton (3 Ms) X-ray spectra are available. We derive accurate X-ray luminosities for Chandra sources using X-ray spectral fits, as well as 6luminosities from spectral energy distribution fits. We find eight AGN (intrinsic ) with low ratios in total, after excluding one source where the 6 emission primarily comes from star-formation. One of these sources has been already demonstrated to host a Compton-thick nucleus, while for another one at a redshift of we argue it is most likely Compton-thick on the basis of its combined Chandra and XMM-Newton spectrum. In agreement with the low redshift sample, we find a large number of non Compton-thick ‘contaminants’ with low X-ray to mid-IR luminosity ratios. The above suggest that a low ratio alone cannot ascertain the presence of a Compton-thick AGN, albeit the majority of low AGN are heavily obscured. More interestingly, the two most reliable Compton-thick AGN in the high redshift Universe have high ratios, showing that this method cannot provide complete Compton-thick AGN samples.
Key Words.:
X-rays: general; X-rays: diffuse background; X-rays: galaxies; Infrared: galaxies1 Introduction
The deep X-ray Universe has been probed at unparalleled depth thanks to the Chandra mission. The deepest Chandra X-ray surveys revealed an AGN sky density above 10.000 (Alexander et al., 2003; Luo et al., 2008; Xue et al., 2011), probing flux limit of (for a review see Brandt & Hasinger, 2005). In contrast, the optical surveys for QSOs reach sky densities of about few hundred per square degree at a magnitude limit of mag (e.g. Wolf et al., 2003). Optical spectroscopic methods, which detect AGN using the [OIII] () or the [NeV] lines (), (Hao et al., 2005; Bongiorno et al., 2010; Gilli et al., 2010), manage to recover a large fraction of low-luminosity AGN (Georgantopoulos & Akylas, 2010) but these are applicable only at a limited redshift range, because these lines are redshifted outside the optical band at high redshifts. Therefore, hard (2-10 keV) X-ray surveys have provided so far the most powerful method for the detection of AGN and thus have provided the most detailed picture of the accretion history of the Universe (e.g. Ueda et al., 2003; LaFranca et al., 2005; Aird et al., 2010).
However, even the efficient hard X-ray surveys may be missing a substantial fraction of the most heavily obscured sources, the Compton-thick AGN, which have column densities . At these high column densities, the attenuation of X-rays is mainly due to Compton-scattering rather than photoelectric absorption. Although there are only a few dozen of Compton-thick AGN identified in the local Universe, (see Comastri, 2004, for a review), there is concrete evidence for the presence of a much higher number. The peak of the X-ray background at 20-30 keV (e.g. Frontera et al., 2007; Churazov et al., 2007; Moretti et al., 2009) can be reproduced by invoking a significant number of Compton-thick sources at moderate redshifts. However, the exact density of Compton-thick sources required by X-ray background synthesis models still remains an open issue (Gilli, Comastri & Hasinger, 2007; Sazonov et al., 2008; Treister, Urry & Virani, 2009). Additional evidence for the presence of a numerous Compton-thick population comes from the directly measured space density of black holes in the local Universe (see Soltan, 1982). It is found that this space density is a factor of 1.5-2 higher than that predicted from the X-ray luminosity function (Marconi et al., 2004; Merloni & Heinz, 2008), although the exact number depends on the assumed efficiency in the conversion of gravitational energy to radiation.
The INTEGRAL and SWIFT missions explored the X-ray sky at energies above 10 keV with the aim to provide the most unbiased samples of Compton-thick AGN in the local Universe. Owing to the limited imaging capabilities of these missions (coded-mask detectors), the flux limit probed is very high ( ), allowing only the detection of AGN at very low redshifts. These surveys did not detect large numbers of Compton-thick sources (e.g. Ajello et al., 2008; Tueller et al., 2008; Paltani et al., 2008; Winter et al., 2009; Burlon et al., 2011). The fraction of Compton-thick AGN in these surveys does not exceed a few percent of the total AGN population. In contrast, optical and mid-IR surveys yield Compton-thick AGN fractions which range between 10 and 20% (Akylas & Georgantopoulos, 2009; Brightman & Nandra, 2011). As Burlon et al. (2011) point out, it is possible that even these ultra-hard surveys are biased against the most heavily obscured ( ) Compton-thick sources.
At higher redshifts, a number of efforts have been made to identify Compton-thick AGN by means of either X-ray hardness ratios (Brunner et al., 2008; Gilli et al., 2011) or X-ray spectroscopy (Tozzi et al., 2006; Georgantopoulos et al., 2009; Comastri et al., 2011; Feruglio et al., 2011) in the deepest Chandra and XMM-Newton observations. In particular, Comastri et al. (2011), provided the most direct X-ray spectroscopic evidence yet for the presence of Compton-thick nuclei at high redshift, reliably identifying two Compton-thick AGN at z=1.536 and z=3.700.
The mid-IR wavelengths have attracted much attention for providing an alternative way to detect heavily obscured systems. This is because the absorbed radiation by circumnuclear dust is re-emitted in the IR part of the spectrum (Soifer, Helou & Werner, 2008), rendering heavily obscured AGN copious mid-IR emitters. In such systems, the 2-10 keV X-ray emission can be diminished by almost two orders of magnitude (e.g. Matt et al., 2004), while at the same time the isotropic mid-IR emission remains largely unattenuated. Daddi et al. (2007); Fiore et al. (2008); Georgantopoulos et al. (2008); Treister et al. (2009b); Eckart et al. (2010); Donley et al. (2010) propose that a fraction of infrared excess, -bright sources which are undetected in X-rays are associated with Compton-thick AGN. Their main argument is based again on the fact that the X-ray to IR luminosity ratio is very low, suggestive of significant amounts of absorption (but see Georgakakis et al., 2010; Georgantopoulos et al., 2011).
The detection of a low luminosity ratio has recently been used as the main instrument for the detection of faint Compton-thick AGN which remain undetected in X-rays (e.g. Alexander et al., 2008; Goulding et al., 2011). This is because the luminosity is an excellent proxy of the AGN power, as it should be dominated by very hot dust which is heated by the AGN (e.g. Lutz et al., 2004; Maiolino et al., 2007). At these wavelengths the contribution by the stellar-light and colder dust heated by young stars should be minimal. Yaqoob & Murphy (2011) criticise the above results claiming that the ratio is not a robust indicator of Compton-thick obscuration. They perform Monte-Carlo X-ray spectral simulations of heavily obscured AGN. They caution that Compton-thick AGN may have the same X-ray to mid-IR luminosity ratio with heavily obscured AGN which have a column density of a few times , depending on the exact value of the covering fraction and photon index.
In this paper, we attempt to assess the efficiency of the ratio method, i.e. to estimate the percentage of Compton-thick AGN among low sources, but also to evaluate whether there are any bona-fide Compton-thick AGN with substantially high ratios. First, we are using local AGN, the IRAS 12 sample of Rush, Malkan & Spinoglio (1993), to assess the reliability and effectiveness of the ratio selection. For this sample there are excellent quality X-ray spectroscopic observations available (Brightman & Nandra, 2011), and therefore we know a priori which objects are Compton-thick. Second, we are selecting candidate Compton-thick AGN among the low AGN in the CDFS. We are presenting a detailed X-ray spectral analysis of these sources, using the most sensitive X-ray data ever obtained, the 4 Ms Chandra data, combined with the 3 Ms XMM-Newton data. Our aim is to detect unambiguous signs of Compton-thick obscuration, such as direct detection of a large column density, or a flat spectral index, or a high equivalent-width Fe K line. We adopt , and throughout the paper.
2 Data
2.1 The IRAS 12sample
2.1.1 XMM data
The extended IRAS 12 galaxy survey (Rush et al., 1993) is a sample of 893 MIR selected local galaxies, which contains a high fraction of AGN (over 10% according to optical spectroscopy). The sample is taken from the IRAS Faint Source Catalogue, version 2 (FSC-2) and imposes a flux limit of 0.22 Jy, including only sources with a rising flux density from 12 to 60 microns (in order to minimise the contamination by stars) and with a Galactic latitude of . There are XMM-Newton observations available for 126 galaxies from the 12 sample.
2.1.2 Mid-IR data
For the local sources, we used photometry from the NASA Extragalactic Database (NED). The most commonly used datasets are the 2MASS survey (Skrutskie et al., 2006) for the near-IR, and IRAS, ISO, and Spitzer catalogues for the near-IR mid-IR and far-IR. We used only broad-band photometry datapoints, and avoided measurements made with apertures smaller than the apparent sizes of the sources. The number of data-points used range from seven (IRAS07599+6508) up to 33 (Mrk231).
2.2 CDFS
2.2.1 Chandra
The CDFS 4 Ms observations consist of 53 pointings obtained in the years 2000 (1 Ms), 2007 (1 Ms) and 2010 (2 Ms). The analysis of the first 1 Ms data is presented in Giacconi et al. (2002) and Alexander et al. (2003), while the analysis of the 23 observations obtained up to 2007 is presented in Luo et al. (2008). 462 X-ray sources have been detected in the 2 Ms data by Luo et al. (2008). The average aim point is , (J2000). The observations cover an area of about 440 arcmin2. The present CDFS 4 Ms survey reaches a sensitivity limit of and in the hard (2-8 keV) and soft (0.5-2 keV) band respectively (Xue et al., 2011). The Galactic column density towards the CDFS is (Dickey & Lockman, 1990).
2.2.2 XMM-Newton
The CDFS area was surveyed with XMM-Newton in several different epochs spread over almost nine years. The data presented in this paper are obtained combining the observations awarded to our project in AO7 and AO8 (Comastri et al., 2011). These observations are performed in four different epochs between July 2008 and March 2010, while the archival data were obtained in the period July 2001 - January 2002. The total exposure, after cleaning from background flares, is 2.82 Ms for the two MOS and 2.45 Ms for the PN detectors. An extended and detailed description of the full data set including data analysis and reduction and the X-ray catalogue will be published in Ranalli et al. (in preparation).
2.2.3 Mid-IR
The central regions of the CDFS have been observed in the mid-IR by the Spitzer mission as part of the Great Observatory Origin Deep Survey (GOODS). These observations cover areas of about in both fields using the IRAC (3.6, 4.5, 5.8 and 8.0) and the MIPS (24 and 70 ) instruments on board Spitzer. We construct a uniform dataset of infrared fluxes by matching the 2 Ms X-ray catalogue of Luo et al. (2008) with the IRAC catalogue from the SIMPLE survey (Damen et al., 2011), which covers the total area of the CDFS. We find counterparts for 446 out of the 462 sources. We also use the FIDEL survey of the CDFS (see Magnelli et al., 2009) to get photometric information on longer wavelengths ( and ). There are 161 sources with mid-IR data in the four IRAC bands, 210 sources with five bands (IRAC + MIPS 24 ) and finally 69 sources with mid-IR data in six bands (IRAC+ MIPS, 24 and 70 ). For the remaining six sources we have only information in less than four IRAC bands. For these sources we do not derive spectral energy distribution (SED) fits.
3 Analysis
3.1 12 sample
For the local sample we are using the XMM-Newton spectroscopic information presented in Brightman & Nandra (2011). These authors provided X-ray spectral fits with particular emphasis on revealing the Compton-thick sources. There are 60 high X-ray luminosity sources (i.e. with intrinsic ) among the 126 sources, with XMM-Newton observations presented in Brightman & Nandra (2011). These 60 sources are classified as bona-fide AGN on the basis of the high X-ray luminosity alone. The X-ray luminosity classification is based on the fact that the most X-ray luminous star forming galaxies (e.g. NGC 3256; Moran, Lehnert & Helfand, 1999), present a 2-10 keV luminosity below , without showing evidence for AGN activity. Among these 60 sources, there are ten AGN which show X-ray spectral evidence for Compton-thick obscuration according to Brightman & Nandra (2011). That is they present in their X-ray spectra either a) high equivalent-width (EW) Fe lines, or b) flat spectral indices indicative of a reflection component, or c) direct detections of an absorption turn-over with .
3.2 CDFS
3.2.1 Chandra spectra
For the CDFS sample we derive X-ray spectra for the sources in the Luo et al. (2008) catalogue using the 4 Ms data (Xue et al., 2011).
We used the SPECEXTRACT script in the CIAO v4.2 software package to extract the spectra of all 462 X-ray sources in our sample. The extraction radius varies between 2 and 4 arcsec with increasing off-axis angle. At low off-axis angles (4 arcmin) this area encircles 90% of the light at an energy of 1.5 keV. The same script extracts response and auxiliary files. The addition of the spectral files was performed with the FTOOL task MATHPHA. For the addition of the response and auxiliary files we used the FTOOL ADDRMF, and ADDARF respectively, weighting according to the number of photons in each spectrum.
We fit the spectra using an absorbed power-law model PLCABS (Yaqoob, 1997) which properly takes into account Compton-scattering up to column densities of . We used the XSPEC v12.5 software package for the spectral fits (Arnaud, 1996). We used the C-statistic technique (Cash, 1979) specifically developed to extract spectral information from data with a low signal-to-noise ratio. We derive accurate X-ray luminosities from the X-ray spectral fits. This is the most reliable method for deriving X-ray luminosities. Instead, the derivation of the X-ray luminosity through the X-ray count rate and an average photon-index can distort substantially the relation.
3.2.2 XMM-Newton spectra
For each individual XMM-Newton orbit, source counts were collected from a circular region of 12 arcsec radius, centered on the source position. Local background data were taken from nearby regions, separately for the PN, MOS1 and MOS2 detectors where no source is found in the full exposure image. The area of the background region had 20 arcsec radius. The spectral data from individual exposures were summed up for the source and background, respectively, and the background subtraction was made assuming the common scaling factor for the source/background geometrical areas. Both PN and MOS spectra are extracted in the 0.5-8 keV energy area. MOS1 and MOS2 spectra are summed using the FTOOLS MATHPHA task. Response and effective area files were computed by averaging the individual files using the FTOOLS ADDRMF and ADDARF tasks.
3.3 Spectral energy distributions
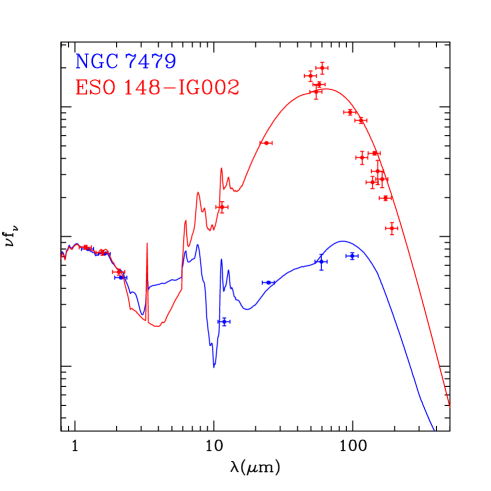
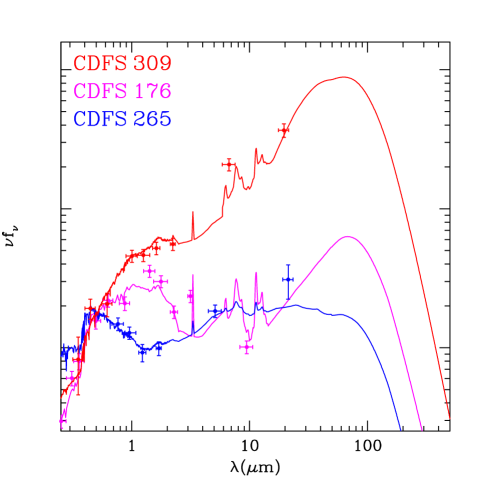
We constructed SED to obtain an idea on the dominant powering mechanism (AGN or star-formation) in the mid-IR part of the spectrum. The SEDs are also used in order to obtain an accurate estimate of the infrared luminosities. We used a minimisation technique to fit the optimum combinations of host galaxy and pure AGN SED templates to the broad-band spectra of our objects. The starburst templates we use, are those from the SWIRE template library of Polletta et al. (2007), which is a compilation of observed SED of nearby galaxies (M82, NGC6090, Arp220, IRAS20547, IRAS22491). In addition, we use the templates of Chary & Elbaz (2001). The AGN templates we use come from Silva, Maiolino & Granato (2004), who combine nuclear SEDs of Seyferts with a range of absorption columns. We also construct a sample of AGN templates using the type-1 QSO SED from Richards et al. (2006) and applying dust absorption following Rosenthal, Bertoldi & Drapatz (2000), in order to account for the 9.7 absorption feature. In Fig. 1, we show an example SED of Compton-thick sources in both the high and low-redshift Universe.
4 Results
4.1 The IRAS 12sample
We present the diagram for the nearby sources in Fig. 2. The X-ray luminosity is uncorrected for obscuration while the 6 luminosity includes both the torus and the star-formation component (see discussion). The lines denote various Compton-thick AGN areas. These have been derived in the following fashion. We adopt the average luminosity dependent AGN relation of Fiore et al. (2009) derived in the COSMOS field. We then scale down this relation by a factor of 30. This is an approximation to the average reflected luminosity relative to the intrinsic emission from the backside of the torus in the 2-10 keV band in reflection-dominated AGN (e.g. Comastri, 2004). Alternatively, 3% is the relation between the absorbed and unabsorbed 2-10 keV luminosity for a column density of and a power-law spectrum of . We show an alternative scenario, where the relation of Fiore et al. (2009) is scaled for only 1% reflected emission (Vignali et al., 2004). We also give the relation derived by Lutz et al. (2004) in the local Universe, together with its associated uncertainty scaled down again by 3% (dashed area). Throughout the paper, we use only the Fiore et al. (2009) 3% reflection limit for assessing the number of Compton-thick sources. We see that most (ten out of eleven) of the sources classified as Compton-thick on the basis of X-ray spectroscopy lie below the Compton-thick lines. However, we see that many more sources (twelve) which are not Compton-thick, according to the XMM-Newton X-ray spectroscopic diagnostics, would be classified as candidate Compton-thick AGN on the basis of the low ratio. All these are presented in Table 1. It is not unlikely that some of the low sources are indeed Compton-thick sources, but XMM-Newton failed to identify them owing to the limited photon statistics. At least two of them NGC424, (Iwasawa et al., 2001; Burlon et al., 2011) and UGC8058 (Mrk231), Braito et al. (2004), are Compton-thick AGN according to SWIFT and BeppoSAX spectroscopy.
| Name | fraction | CT | EW | ||||
|---|---|---|---|---|---|---|---|
| (1) | (2) | (3) | (4) | (5) | (6) | (7) | (8) |
| NGC 17 | 0.0196 | 41.29 | 43.82 | 0 | - | 0.440 | |
| NGC 424 | 0.0118 | 41.60 | 43.93 | 1 | - | 0.024 | |
| NGC 1068 | 0.0380 | 41.11 | 44.14 | 0.74 | b | - | - |
| NGC 1194 | 0.0136 | 41.53 | 43.58 | 0.91 | - | 0.059 | |
| NGC 1320 | 0.0890 | 40.83 | 43.41 | 0.83 | a | 0.082 | |
| NGC 1667 | 0.0152 | 40.62 | 43.69 | 0 | a | 0.391 | |
| F 07599+6508 | 0.1488 | 41.90 | 45.79 | 0.96 | - | - | 0.027 |
| UGC 5101 | 0.0394 | 41.70 | 44.10 | 0 | - | 0.229 | |
| Mrk231 | 0.0422 | 42.28 | 45.23 | 0.95 | - | 0.011 | |
| NGC 4968 | 0.0099 | 40.66 | 43.44 | 0.92 | a | 0.172 | |
| NGC 5256 | 0.0279 | 41.62 | 44.07 | 0 | - | 0.608 | |
| Mrk 273 | 0.0378 | 41.98 | 44.20 | 0 | - | 0.192 | |
| Mrk463 | 0.0504 | 42.46 | 45.03 | 0.98 | - | 0.008 | |
| Mrk848 | 0.0402 | 41.54 | 44.51 | 0.79 | - | - | |
| †2MASX J15504152 | 0.0303 | 41.87 | 43.79 | 0.48 | c | - | |
| NGC 6552 | 0.0265 | 41.79 | 44.55 | 0.95 | b | - | - |
| F 19254-7245 | 0.0617 | 42.23 | 44.60 | 0.88 | - | 0.064 | |
| NGC 6890 | 0.0081 | 40.52 | 43.13 | 0.24 | c | 0.237 | |
| NGC 7479 | 0.0079 | 40.57 | 43.92 | 0.70 | a | - | |
| NGC 7582 | 0.0053 | 41.05 | 43.44 | 0 | c | 0.04 | - |
| NGC 7674 | 0.0289 | 41.95 | 44.32 | 0.58 | c | - | 0.132 |
| ESO 286-IG019 | 0.0430 | 41.56 | 44.19 | 0.85 | - | - | |
| ESO 148-IG002 | 0.0446 | 41.78 | 44.07 | 0 | c | - | - |
-
The columns are: (1) Name; (2) Spectroscopic redshift; (3) Logarithm of luminosity in the 2-10 keV band uncorrected for absorption in units of ; (4) Logarithm of 6 luminosity in units of ; (5) Fraction of the AGN contribution to the luminosity; (6) Compton-thick classification from Brightman & Nandra (2011) based on: a: direct measurement of the column density; b: large EW of Fe K line; c: large reflection component; (7) column density in units of from Brightman & Nandra (2011); (8) Equivalent-width of the 6.2PAH in units of from Wu et al. (2009); †: Source not in the low- sample.
| ID | C-stat | fraction | C-stat | C-stat | counts | ||||||||
|---|---|---|---|---|---|---|---|---|---|---|---|---|---|
| (1) | (2) | (3) | (4) | (5) | (6) | (7) | (8) | (9) | (10) | (11) | (12) | (13) | (14) |
| 9 | 1.615 | 438 | 1.5 | 1.8 | 11.77 | 0.92 | 439 | 456 | 130 | ||||
| 95 | 5.73 | 505 | 1.0 | 2.7 | 12.96 | 1.0 | 505 | 508 | 137 | ||||
| 197 | 3.64 | 474 | 0.46 | 0.59 | 11.74 | 0.97 | 437 | 472 | 37 | ||||
| 282 | 2.223 | - | - | - | 0.14 | 0.38 | 11.95 | 0.87 | 1.2 | 477 | 472 | 24 | |
| 293 | 3.10 | - | - | - | 0.15 | 0.65 | 11.75 | 0.96 | 452 | 455.5 | 22 | ||
| 309 | 2.579 | - | - | - | 0.35 | 1.5 | 11.61 | 0.81 | 497 | 498 | 52 | ||
| 382 | 0.664 | 487 | 0.63 | 0.1 | 10.75 | 0.1 | 488 | 497 | 179 | ||||
| 398 | 1.222 | 483 | 1.50 | 0.54 | 11.77 | 0.88 | 470 | 465 | 94 | ||||
| 407 | 1.367 | 3.9 | 464 | 0.13 | 0.12 | 10.83 | 0.35 | 3.5 | 464 | 464 | 48 |
-
The columns are: (1) ID in the catalogue of Luo et al. (2008); (2) Redshift from Luo et al. (2010); two and three decimal digits denote photometric and spectroscopic redshift respectively; source not detected in the BVR bands Cardamone et al. (2010) or K band Taylor et al. (2009) and thus the photometric redshift may be uncertain. Rafferty et al. (2011) gives a photometric redshift of z=2.30 and z=3.02 for the sources CDFS-197 an CDFS-293 respectively; (3) Column density in units , (4) Photon-index; and (5) C-statistic value for 509 degrees of freedom for both and free; (6) X-ray flux in the 2-10 keV band in units of , as estimated from the X-ray spectroscopy; (7) X-ray luminosity in the 2-10 keV band (uncorrected for X-ray absorption) in units of ; (8) Logarithm of total 6 luminosity (star-formation and torus) in units of solar luminosity; (9) Fraction of torus contribution relative to total luminosity at 6 , according to SED decomposition; (10) Column density in units for photon index fixed to ; (11) C-statistic value for 510 degrees of freedom; (12) Photon-index for column density ; (13) C-statistic value for 510 degrees of freedom; (14) Net counts (background subtracted) in the 0.5-8 keV band; All errors quoted refer to the 90% confidence level.
| model | mission | EW | C-stat | ||
| (1) | (2) | (3) | (4) | (5) | (6) |
| CDFS-9 | |||||
| PL | XMM | - | 2892/2497 | ||
| PL + Line | XMM | 2886/2496 | |||
| PL | Chandra + XMM | - | 3334/3008 | ||
| PL + Line | Chandra + XMM | 3316/3007 | |||
| CDFS-398 | |||||
| PL | XMM | - | 2947/2499 | ||
| PL + Line | XMM | 2940/2498 | |||
| PL | Chandra + XMM | 0.74 | - | 3405/3008 | |
| PL + Line | Chandra + XMM | 0.33 | 3395/3007 | ||
| PEX + Line | Chandra + XMM | - | 3407/3010 | ||
-
The columns are: (1) Model; (2) Data used in the fits; (3) Column density in units of ; (4) Photon Index; (5) EW (rest-fame) of the FeK line; (6) C-statistic value divided by degrees of freedom; All errors correspond to the 90% confidence level.
| ID | C-stat | C-stat | ||||||
|---|---|---|---|---|---|---|---|---|
| (1) | (2) | (3) | (4) | (5) | (6) | (7) | (8) | (9) |
| 96 | 0.310 | 0.76 | 41.23 | 10.07 | 503 | 0.53 | 512 | |
| 159 | 0.664 | 0.78 | 41.81 | 10.28 | 539 | 0.24 | 549 | |
| 166 | 0.340 | 0.54 | 41.12 | 9.61 | 438 | 440 | ||
| 178 | 0.735 | 1.22 | 41.76 | 10.32 | 452 | 449 | ||
| 208 | 0.738 | 0.72 | 41.92 | 10.55 | 488 | 0.75 | 496 |
-
The columns are: (1) Name in the catalogue of Luo et al. (2008); (2) Spectroscopic redshift from Luo et al. (2010); (3) X-ray flux in the 2-10 keV band in units of , as estimated from the X-ray spectroscopy; (4) Logarithm of the obscured X-ray luminosity in the 2-10 keV band in units of ; (5) Logarithm of the total 6 luminosity (star-formation and torus) in units of solar luminosity; (6) Photon index for column density fixed to , as derived from the Chandra spectral fits; (7) Corresponding C-statistic value; (8) Column density in units of for photon index fixed to ; (9) Corresponding C-statistic value; All errors refer to the 90% confidence level.
4.2 CDFS
We exclude all sources with an intrinsic X-ray luminosity of , as many of these could be associated with normal galaxies. 283 sources have luminosities above this level. The diagram is shown in Fig. 3. There are nine sources which would be characterised as Compton-thick on the basis of the low ratio (see Table 2). In Table 2 we present the Chandra spectral fit results. Throughout the paper, we use the Luo et al. (2008) identification numbers. Four low- sources could be classified as Compton-thick: CDFS-309, CDFS-95, CDFS-197, and CDFS-398. CDFS-309 has been discussed in detail in Feruglio et al. (2011) and was found to present a Compton-thick source on the basis of an Fe K line with a high EW. Due to the limited photon-statistics we cannot tell whether the source is flat or obscured with . However, the addition of an FeK line improves the statistic by yielding an EW of 3.6 keV. CDFS-95 and CDFS-197 have column densities somewhat below the Compton-thick limit ( ), but are nevertheless consistent with being Compton-thick within the errors. However, for both sources there are only photometric redshifts available and therefore the column density estimates are uncertain.
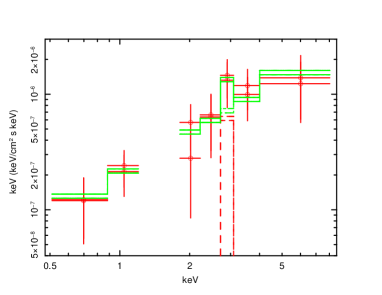
Only two low- sources have fluxes . These sources have been also detected by XMM-Newton , allowing a spectral fit with both the photon-index and the column density considered as free parameters. These are CDFS-9 and CDFS-398. In Table 3 we present the spectral fit results for these two sources. The spectrum of CDFS-9 is highly absorbed with a column density of , but certainly it is not a Compton-thick source. From Table 3 we see that the Chandra spectrum of CDFS-398 is flat (). Since the source is detected by XMM-Newton , there are good photon statistics available allowing a more complex fit to the spectrum. We consider two spectral models to fit its X-ray spectrum. (1) an absorbed power-law spectrum with the addition of an FeK line, (plcabs+zga), and (2) a reflection dominated model with an FeK line, pexrav+zga. The spectral fits to the combined Chandra and XMM-Newton data are given in table 3. This source displays a very flat spectrum at the 90% confidence level. This flat spectrum is characteristic of reflection-dominated Compton-thick sources (Matt et al., 2004). The rest-frame EW of the Fe K line is keV, which is again consistent with Compton-thick emission (Fukazawa et al., 2011). The X-ray spectrum is presented in Fig. 4.
For clarity, we summarise the numbers of sources in the various subsamples given in his section in Table 5.
5 Discussion
5.1 The local sample
In this work, we use the 60 bona-fide AGN, with luminosities from the 12 IRAS sample. XMM-Newton observations of these sources are presented in Brightman & Nandra (2011) and Brightman & Nandra (2011b). 22 of these AGN present low ratios. In particular, their X-ray luminosity is lower than the 3% of the average AGN luminosity-dependent relation as derived by Fiore et al. (2009). This is assumed to be the fraction of the reflected 2-10 keV emission from the backside of the torus, relative to the intrinsic 2-10 keV luminosity. Although this value of reflected emission is often observed in the local Universe (e.g. Comastri, 2004), it should only be considered as a rough approximation. For example, it is likely that in some cases it could be even smaller (Ueda et al., 2007; Comastri et al., 2010). It is noteworthy that the method can retrieve the vast majority (ten out of eleven) of the Compton-thick AGN found by Brightman & Nandra (2011). This ascertains that the empirical limit adopted above is proven to be efficient for the selection of Compton-thick sources. The X-ray spectroscopy reveals that ten out of the 22 low AGN are Compton-thick AGN following the classification of Brightman & Nandra (2011). Most of the remaining twelve sources are heavily obscured having , but these are not formally Compton-thick, at least according to the XMM-Newton spectroscopy. This suggests that the low ratio technique presents roughly a 45% success rate in the detection of Compton-thick sources in the local Universe. Interestingly, the level of contamination is not extremely sensitive on the exact value of the adopted upper limit. For example, from Fig. 2, we can easily estimate that by lowering the adopted threshold e.g. by as much as a factor of three (i.e. adopting a 1% reflection fraction), we end up with eleven sources, six of which are classified as Compton-thick by Brightman & Nandra (2011). The number of Compton-thick sources rises to seven taking into account UGC8058 which is a Compton-thick source according to BeppoSAX spectroscopy (Braito et al., 2004) as noted above.
One important parameter which is often ignored is the fraction of the star-formation contribution to the 6 emission. In most cases (15/23) the torus component is the dominant contributor to the 6 luminosity. In the remaining cases the torus contribution to the 6 emission is small i.e. 30% (see Table 1). In the same table, we give the equivalent-width (EW) of the PAH (Polycyclic Aromatic Hydrocarbon) features at 6.2as reported in Wu et al. (2009). A high EW (usually above 0.3 ) is considered as an indication of a strong star-forming component. We see that sources that have a small torus contribution, as derived from the SED fit, generally display high EW. The only marginal case is Mrk273 which displays no torus in its SED while the EW of the 6.2PAH feature is . For the sources that display a dominant star-forming contribution, one should be cautious in using the ratio as a Compton-thick diagnostic, because the above ratio represents only a lower-limit to the true value. In principle, in these cases one could use instead the torus 6luminosity. Nevertheless, the degeneracies on the SED decomposition could play a crucial role, that is, in some cases the combination of different tori with star-forming models yield equally good fits although the relative torus contribution changes. Such degeneracies will be significantly overcome with the use of Herschel data which will be able to provide tight constraints on the star-forming contribution. When we reject the sources with low torus contribution, 30%, we are left with 14 low- sources (see Table 5). Out of these, six are Compton-thick according to the XMM-Newton spectroscopy (NGC1068, NGC1320, NGC4968, NGC6552, NGC7479, NGC7674).
5.2 CDFS
In most cases (seven out of nine) the torus component is the dominant contributor (over 80%) to the 6 luminosity. In the case of CDFS-382, the SED decomposition shows that the torus contribution is negligible and therefore the classification becomes problematic. Yet another source (CDFS-407) presents a low (30%) torus contribution to the 6emission. However, even taking into account the corrected 6luminosity which comes from the torus, we find that this source would be marginally classified as a low ratio source.
In conclusion, in the CDFS, there are eight low AGN among the 283 luminous AGN ( ), after exclusion of the CDFS-382 which has zero torus contribution. At face value, i.e. assuming that all sources are Compton-thick, this would correspond to a Compton-thick fraction of 3%. In agreement with the results in the local sample, not all the low AGN appear to be associated with Compton-thick sources. On the basis of the flat spectra (indicative of reflection dominated spectra), as well as the presence of strong Fe K lines, we estimate that at least two sources are Compton-thick (CDFS-309 and CDFS-398). One of these (CDFS-309 at a redshift of z2.6) has been already reported as a Compton-thick source by Feruglio et al. (2011) while the other one (CDFS-398 at a redshift of z=1.222) is reported here for the first time. Another two (CDFS-95, CDFS-197) are heavily obscured ( ) and thus consistent with being Compton-thick. For these sources there are only photometric redshifts available and thus the column densities remain somewhat uncertain.
The fraction of Compton-thick AGN mentioned above (between two and four out of 283 sources) should be considered only as a lower limit. This is because there could be many more Compton-thick AGN at lower luminosities. There are 85 additional candidates with low luminosity ratio which have an intrinsic X-ray luminosity in the 2-10 keV band. Many of these could be associated with normal galaxies (e.g. Georgakakis et al., 2003, 2007; Tzanavaris, Georgantopoulos & Georgakakis, 2006), as well as low-luminosity AGN with no obscuration. For example, Georgakakis et al. (2010) find that many low-luminosity AGN in the sample of Terashima et al. (2002) present low X-ray to mid-IR luminosity ratios. Nevertheless, there are five sources among them which show evidence for a flat spectrum (see Table 4). In principle these could be associated with heavily obscured nuclei. Unfortunately, as they have faint fluxes, it is difficult to disentangle whether the hard spectra are caused by a moderate column density, or a genuinely flat spectrum, which could be the trademark of a reflection dominated Compton-thick AGN. There is no evidence for the presence of an Fe K line in these spectra.
5.3 Comparison with previous results in the CDFS
Interestingly, there are two bona-fide Compton-thick sources which do not present low ratios. These are the sources CDFS-176 and CDFS-265 at a spectroscopic redshift of and respectively. These sources have been reported as Compton-thick by Norman et al. (2002), Tozzi et al. (2006), and Georgantopoulos, Georgakakis & Akylas (2007). Recently, Comastri et al. (2011) have confirmed the presence of Compton-thick nuclei on the basis of both flat spectra and high-EW Fe K lines. The most likely explanation for a high X-ray to 6 luminosity ratio is the large intrinsic dispersion of this relation. This can be clearly seen in Fig. 1. It appears that the Compton-thick AGN in Comastri et al. (2011) have a relatively low 6 luminosity compared to sources such as CDFS-309. Hence, only the last source lies below the Compton-thick line of Fig. 3. In any case, the existence of Compton-thick AGN which have high ratios certainly poses problems for the completeness of the method in identifying Compton-thick AGN.
Additionally, Tozzi et al. (2006) have proposed a number of Compton-thick candidates on the basis of flat spectra in the 1 Ms observations of the CDFS (see also Georgantopoulos et al., 2007). All these candidates, with the exception of CDFS-178, present high luminosity ratios (see Fig. 3). This source, at a spectroscopic redshift of , is among our low X-ray luminosity sources which present a flat X-ray spectrum.
| Total | Torus30% | |||||
|---|---|---|---|---|---|---|
| all | CT | non-CT | all | CT | non-CT | |
| Local | 22 | 10 | 12 | 14 | 6 | 8 |
| CDFS | 9 | 4 | 5 | 7(8)† | 4 | 3(4) † |
-
† Source CDFS-407 has a low (30%) torus contribution in the flux, but it would still be considered low taking into account this contribution.
6 Summary and conclusions
In this paper, we are assessing the efficiency of the low ratio technique for discovering Compton-thick AGN. The principle behind this method is that in Compton-thick sources, the X-ray rest-frame luminosity, is diminished by almost two orders of magnitude while the 6 luminosity is left unattenuated.
The advantages of the present work in comparison with previou applications of the method are the following:
-
•
We use a ’calibration’ sample in the local Universe. This consists of a sample with high-quality XMM-Newton observations available (Brightman & Nandra, 2011b) and thus with a priori knowledge of the fraction of Compton-thick sources.
-
•
At higher redshift, we employ the most sensitive X-ray observations so far available, namely the 4 Ms Chandra observations, combined with the 3 Ms XMM-Newton observations in the CDFS (Comastri et al., 2011).
-
•
We derive the X-ray luminosities using proper X-ray spectral fits instead of the usually employed X-ray fluxes in combination with an average X-ray spectral index.
-
•
We use SED decomposition to ascertain that the nuclear contribution is not contaminated by significant amounts of star-forming emission.
Our conclusions can be summarised as follows:
-
•
In the local sample the vast majority (ten out of eleven) of the Compton-thick AGN appear to have low ratios. However, the opposite is not true, i.e. there is a large number of low sources which are probably not Compton-thick. This would make the efficiency of the method for selecting Compton-thick sources 50%.
-
•
In the CDFS we select eight low AGN with intrinsic luminosities (after exclusion of one source where the 6 emission comes from star-formation). One of these (CDFS-309 at a redshift of ) is already shown to host a Compton-thick nucleus, while for another one (CDFS-398 at z=1.222) we argue here for the first time that it is Compton-thick.
-
•
A large fraction of the low CDFS sources cannot be confirmed as Compton-thick on the basis of the X-ray spectroscopy, but they are nevertheless highly obscured, having column densities above . This suggests that the ratio cannot be used on its own to reliably classify sources as Compton-thick.
-
•
Finally, there at least two bona-fide Compton-thick sources from Comastri et al. (2011) which do not appear to present low ratios, casting further doubt on the validity of this method for selecting Compton-thick sources.
Acknowledgements.
IG and AC acknowledge the Marie Curie fellowship FP7-PEOPLE-IEF-2008 Prop. 235285. AC, RG and CV acknowledge receipt of ASI grants I/023/05/00 and I/88/06. NC acknowledges financial support from the Della Riccia foundation. The Chandra data used were taken from the Chandra Data Archive at the Chandra X-ray Center.References
- Aird et al. (2010) Aird, J., Nandra, K., Laird, E. S., et al., 2010, MNRAS, 401, 2531
- Ajello et al. (2008) Ajello, M., Rau, A., Greiner, J., et al. 2008, ApJ, 673, 96
- Akylas & Georgantopoulos (2009) Akylas, A., Georgantopoulos, I., 2009, A&A, 500, 999
- Alexander et al. (2003) Alexander, D. M., Bauer, F. E., Brandt, W. N., et al., 2003, AJ, 126, 539
- Alexander et al. (2008) Alexander, D. M., Chary, R. R., Pope, A., et al. 2008, ApJ, 687, 835
- Arnaud (1996) Arnaud, K. A., 1996, Astronomical Data Analysis Software and Systems V, eds. Jacoby, G. & Barnes, J., ASP Conf. Series, 101, 17
- Bongiorno et al. (2010) Bongiorno, A., Mignoli, M., Zamorani, G., et al., 2010, A&A, 510, 56
- Braito et al. (2004) Braito, V., Della Ceca, R., Piconcelli, E. et al. 2004, A&A, 420, 79
- Brandt & Hasinger (2005) Brandt W. N., Hasinger, G., 2005, ARA&A, 43, 827
- Brightman & Nandra (2011) Brightman, M., Nandra, K., 2011, MNRAS, 413, 1206
- Brightman & Nandra (2011b) Brightman, M., Nandra, K., 2011, MNRAS, 414, 384
- Brunner et al. (2008) Brunner, H., Cappelluti, N., Hasinger, G., Barcons, X., Fabian, A.C., Mainieri, V., Szokoly, G., 2008, A&A, 479, 283
- Burlon et al. (2011) Burlon, D., Ajello, M., Greiner, J., Comastri, A., Merloni, A., Gehrels, N., 2011, ApJ, 728, 58
- Cardamone et al. (2010) Catdamone, C.N., van Dokkum, P.G., Urry, C.M. et al. 2010, ApJS, 189, 270
- Cash (1979) Cash, W., 1979, ApJ, 228, 939
- Chary & Elbaz (2001) Chary, R., Elbaz, D., 2001, ApJ, 556, 562
- Churazov et al. (2007) Churazov, E., Sunyaev, R., Revnivtsev, M., et al. 2007, A&A, 467, 529
- Comastri (2004) Comastri, A. 2004, ASSL, 308, 245
- Comastri et al. (2010) Comastri, A., Iwasawa, K., Gilli, R., Vignali, C., Ranalli, P., Matt, G., Fiore, F., 2010, ApJ, 717, 787
- Comastri et al. (2011) Comastri, A., Ranalli, P., Iwasawa, K., et al., 2011, A&A, 526, L9
- Daddi et al. (2007) Daddi, E., Alexander, D. M., Dickinson, M., et al., 2007, ApJ, 670, 173
- Damen et al. (2011) Damen, M., Labbé, I., van Dokkum, P. G., et al., 2011, ApJ, 727, 1
- Dickey & Lockman (1990) Dickey, J. M., Lockman, F. J., 1990, ARA&A, 28, 215
- Donley et al. (2010) Donley, J. L., Rieke, G. H., Alexander, D. M., Egami, E., Pérez-González, P. G., 2010, ApJ, 719, 1393
- Eckart et al. (2010) Eckart, M. E., McGreer, I. D., Stern, D., Harrison, F. A., Helfand, D. J., 2010, ApJ, 708, 584
- Feruglio et al. (2011) Feruglio, C., Daddi, E., Fiore, F., Alexander, D. M., Piconcelli, E., Malacaria, C., 2011, ApJ, 729, L4
- Fiore et al. (2008) Fiore, F., Grazian, A., Santini, P., et al., 2008, ApJ, 672, 94
- Fiore et al. (2009) Fiore, F., Puccetti, S., Brusa, M., et al., 2009, ApJ, 693, 447
- Frontera et al. (2007) Frontera, F., Orlandini, M., Landi, R., 2007, ApJ, 666, 86
- Fukazawa et al. (2011) Fukazawa, Y., Hiragi, K., Mizuno, M., et al., 2011, ApJ, 727, 19
- Georgakakis et al. (2003) Georgakakis, A., Hopkins, A.M., Sullivan, M., Afonso, J., Georgantopoulos, I., Mobasher, B., Cram, L.E., 2003, MNRAS, 345, 939
- Georgakakis et al. (2007) Georgakakis, A., Rowan-Robinson, M., Babbedge, T.S.R., Georgantopoulos, I., 2007, MNRAS, 377, 203
- Georgakakis et al. (2010) Georgakakis, A., Rowan-Robinson, M., Nandra, K., Digby-North, J., Pérez-González, P. G., Barro, G., 2010, MNRAS, 406, 420
- Georgantopoulos et al. (2007) Georgantopoulos, I., Georgakakis, A., Akylas, A., 2007, A&A, 466, 823
- Georgantopoulos et al. (2008) Georgantopoulos, I., Georgakakis, A., Rowan-Robinson, M., Rovilos, E., 2008, A&A, 484, 671
- Georgantopoulos et al. (2009) Georgantopoulos, I., Akylas, A., Georgakakis, A., Rowan-Robinson, M., 2009, A&A, 507, 747
- Georgantopoulos & Akylas (2010) Georgantopoulos, I., Akylas, A., 2010, A&A, 509, 38
- Georgantopoulos et al. (2011) Georgantopoulos, I., Rovilos, E., Xilouris, E. M., Comastri, A., Akylas, A., 2011, A&A, 526, 86
- Giacconi et al. (2002) Giacconi, R., Zirm, A., Wang, J., et al., 2002, ApJS, 139, 369
- Gilli et al. (2007) Gilli, R., Comastri, A., Hasinger, G., 2007, A&A, 463, 79
- Gilli et al. (2010) Gilli, R., Vignali, C., Mignoli, M., Iwasawa, K., Comastri, A., Zamorani, G., 2010, A&A, 519, 92
- Gilli et al. (2011) Gilli, R., Su, J., Norman, C., et al., 2011, ApJ, 730, L28
- Goulding et al. (2011) Goulding, A. D., Alexander, D. M., Mullaney, J. R., Gelbord, J. M., Hickox, R. C., Ward, M., Watson, M. G., 2011, MNRAS, 411, 1231
- Hao et al. (2005) Hao, L., Strauss, M. A., Fan, X., et al., 2005, AJ, 129, 1795
- Iwasawa et al. (2001) Iwasawa, K., Matt, G., Fabian, A.C., Bianchi, S., Brandt, W.N., Guainazzi, M., Murayama, T., Taniguchi, Y., 2001, MNRAS, 326, 119
- LaFranca et al. (2005) La Franca, F., Fiore, F., Comastri, A., et al., 2005, A&A, 635, 864
- Luo et al. (2008) Luo, B., Bauer, F.E., Brandt, W.N., et al. 2008, ApJS, 179, 19
- Luo et al. (2010) Luo, B., Brandt, W. N., Xue, Y. Q., et al., 2010, ApJS, 187, 560
- Lutz et al. (2004) Lutz, D., Maiolino, R., Spoon, H. W. W., Moorwood, A. F. M., 2004, A&A, 418, 465
- Magnelli et al. (2009) Magnelli, B., Elbaz, D., Chary, R. R., Dickinson, M., Le Borgne, D., Frayer, D. T., Willmer, C. N. A., 2009, A&A, 496, 57
- Maiolino et al. (2007) Maiolino, R., Shemmer, O., Imanishi, M., Netzer, H., Oliva, E., Lutz, D., Sturm, E., 2007, A&A, 468, 979
- Marconi et al. (2004) Marconi, A., Risaliti, G., Gilli, R., Hunt, L.K., Maiolino, R., Salvati, M., 2004, MNRAS, 351, 169
- Matt et al. (2004) Matt, G., Bianchi, S., Guainazzi, M., Molendi, S., 2004, A&A, 414, 155
- Merloni & Heinz (2008) Merloni, A., Heinz, S., 2008, MNRAS, 388, 1011
- Moran et al. (1999) Moran, E. C., Lehnert, M. D., Helfand, D. J., 1999, ApJ, 526, 649
- Moretti et al. (2009) Moretti, A., Pagani, C., Cusumano, G., et al. 2009, A&A, 493, 501
- Norman et al. (2002) Norman, C., Hasinger, G., Giacconi, R., et al., 2002, ApJ, 571, 218
- Paltani et al. (2008) Paltani, S., Walter, R., McHardy, I. M., Dwelly, T., Steiner, C., Courvoisier, T. J.-L., 2008, A&A, 485, 707
- Polletta et al. (2007) Polletta, M., Tajer, M., Maraschi, L., et al., 2007, ApJ, 663, 81
- Rafferty et al. (2011) Rafferty, D.A. et al. 2011, submitted
- Richards et al. (2006) Richards, G. T., Lacy, M., Storrie-Lombardi, L. J., et al., 2006, ApJS, 166, 470
- Rosenthal et al. (2000) Rosenthal, D., Bertoldi, F., Drapatz, S., 2000, A& A, 356, 705
- Rush et al. (1993) Rush, B., Malkan, M. A., Spinoglio, L., 1993, ApJS, 89, 1
- Sazonov et al. (2008) Sazonov, S., Krivonos, R., Revnivtsev, M., Churazov, E., Sunyaev, R., 2008, A&A, 482, 517
- Silva et al. (2004) Silva, L., Maiolino, R., Granato, G. L., 2004, MNRAS, 355, 973
- Skrutskie et al. (2006) Skrutskie, M. F., Cutri, R. M., Stiening, R., et al., 2006, AJ, 131, 1163
- Soifer et al. (2008) Soifer, B. T., Helou, G., Werner, M., 2008, ARA&A, 46, 201
- Soltan (1982) Soltan, A., 1982, MNRAS, 200, 115
- Taylor et al. (2009) Taylor, E.N., Franx, M., van Dokkum, P.G. et al. 2009, ApJS, 183, 295
- Terashima et al. (2002) Terashima, Y., Iyomoto, N., Ho, L. C., Ptak, A. F., 2002, ApJS, 139, 1
- Tozzi et al. (2006) Tozzi, P., Gilli, R., Mainieri, V., et al., 2006, A&A, 451, 457
- Treister et al. (2009) Treister, E., Urry, C. M., Virani, S., 2009, ApJ, 696, 110
- Treister et al. (2009b) Treister, E., Cardamone, C. N., Schawinski, K., et al., 2009b, ApJ, 706, 535
- Tueller et al. (2008) Tueller, J., Mushotzky, R.F., Barthelmy, S., Cannizzo, J.K., Gehrels, N., Markwardt, C.B., Skinner, G.K., Winter, L.M., 2008, ApJ, 681, 113
- Tzanavaris et al. (2006) Tzanavaris, P., Georgantopoulos, I., Georgakakis, A., 2006, A&A, 454, 447
- Ueda et al. (2003) Ueda, Y., Akiyama, M., Ohta, K., Miyaji, T., 2003, ApJ, 598, 886
- Ueda et al. (2007) Ueda, Y., Eguchi, S., Terashima, Y., 2007, ApJ, 664, L79
- Vignali et al. (2004) Vignali, C., Alexander, D.M., Comastri, A., 2004, MNRAS, 354, 720
- Winter et al. (2009) Winter, L. M., Mushotzky, R. F., Reynolds, C. S., Tueller, J., 2009, ApJ, 690, 1322
- Wolf et al. (2003) Wolf, C., Wisotzki, L., Borch, A., Dye, S., Kleinheinrich, M., Meisenheimer, K., 2003, A&A, 408, 499
- Wu et al. (2009) Wu, Y., Charmandaris, V., Huang, J. Spinoglio, L., Tommasin, S., 2009, ApJ, 701, 658
- Xue et al. (2011) Xue, Y.Q., Luo, B., Brandt, W.N., et al., 2011, astro-ph/1105.5643
- Yaqoob (1997) Yaqoob, T., 1997, ApJ, 479, 184
- Yaqoob & Murphy (2011) Yaqoob, T., Murphy, K., 2011, MNRAS, 412, 835