Attojoule all-optical switching with a single quantum dot
Abstract
We experimentally investigate the dynamic nonlinear response of a single quantum dot (QD) strongly coupled to a photonic crystal cavity-waveguide structure. The temporal response is measured by pump-probe excitation where a control pulse propagating through the waveguide is used to create an optical Stark shift on the QD, resulting in a large modification of the cavity reflectivity. This optically induced cavity reflectivity modification switches the propagation direction of a detuned signal pulse. Using this device we demonstrate all-optical switching with only 14 attojoules of control pulse energy. The response time of the switch is measured to be up to 8.4 GHz , which is primarily limited by the cavity-QD interaction strength.
All-optical switches are considered to be an important alternative for increasing information bandwidth and reducing power consumption in telecommunications systems and computer processors Miller (2010). Optical switching has been demonstrated using various device structures such as semiconductor quantum wells Gopal et al. (2002); Takahashi et al. (1996), semiconductor optical amplifiers Nakamura et al. (2001); Dorren et al. (2004); Nielsen et al. (2006), and nonlinear parametric processes Andrekson et al. (2008). These devices typically exploit weak nonlinearities arising from a large ensemble of atomic systems, resulting in high power dissipation and large device size Hinton et al. (2008). Photonic crystals (PCs) have been shown as an effective method for significantly reducing both device size and power consumption. PC all-optical switches have been demonstrated using free carrier absorption Husko et al. (2009); Nozaki et al. (2010) and laser gain modulation Matsuo et al. (2010), enabling switching energies as low as 0.6-15 femtojoules.
The interaction between PCs and semiconductor quantum dots (QDs) provides a promising method for achieving significantly enhanced nonlinear optical response. These interactions can be sufficiently large to enter the strong coupling regime of cavity quantum electrodynamics, where atom light interactions modify both the QD emission spectrum Yoshie et al. (2004) and cavity spectrum Hughes and Kamada (2004); Waks and Vuckovic (2006a); Englund et al. (2007); Shen and Fan (2009); Bose et al. (2011a). Such modifications can result in nonlinear optical effects near the single photon level, which has been predicted theoretically Waks and Vuckovic (2006b); Auffeves-Garnier et al. (2007) and reported experimentally Srinivasan and Painter (2007); Fushman et al. (2008); Bose et al. (2011b) in a number of works. The dynamics of the nonlinear response of a strongly coupled cavity-QD system remain largely unexplored to date. A better scientific understanding of this dynamic nonlinear behavior could provide important insight for application of these systems for both classical and quantum information processing.
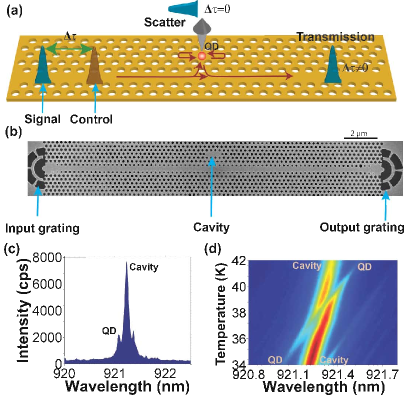
In this work we experimentally study the dynamic nonlinear response of a QD strongly coupled to photonic crystal cavity-waveguide circuit using optical pump-probe measurements. Figure 1a illustrates the device, which is composed of a photonic crystal defect cavity evanescently coupled to a row-defect waveguide, with a single QD strongly coupled to the cavity mode. The pump-probe experiment proceeds by injecting a signal and control beam, which are spectrally detuned, into the waveguide. The control beam determines whether the signal will be preferentially transmitted through the waveguide or scattered by the cavity. A scanning electron micrograph (SEM) image of a fabricated device is shown in Figure 1b. Details of the device design and fabrication have been previously reported Bose et al. (2011a). The signal and control pulses are injected into the waveguide using a grating coupler Faraon et al. (2008), and drive the cavity evanescently. The signal pulse is collected either directly from the cavity (direct cavity scatter) or from the output coupler (transmitted waveguide signal) by spatial filtering.
Figure 1c shows the cavity photoluminescence (PL) spectrum, attained by exciting the cavity with a 780 nm pump laser. The PL exhibits an emission peak for the cavity mode, along with additional emission peaks for several QDs that are coupled to the cavity. The QD used for all measurements reported in this letter is labeled in the figure. By fitting the cavity mode to a Lorentzian, we determine the cavity energy decay rate to be GHz (Q 11900). Figure 1d shows the photoluminescence as a function of device temperature. As the temperature is increased, the QD identified in Figure 1c red-shifts and becomes resonant with the cavity. A clear anti-crossing is observed, indicating that the QD and cavity are in the strong coupling regime and form two dressed polariton modes. From the minimum splitting of the polaritons, which occurs at a temperature of 39 K, we calculate the cavity-QD coupling strength to be GHz.
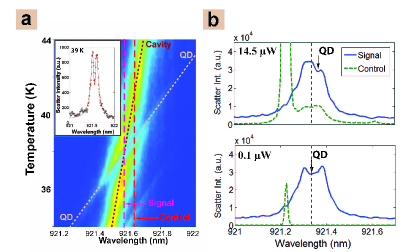
In Figure 2a we plot the measured cavity scattering spectrum as a function of device temperature when a broadband LED, used as a white light source, excites the input grating. Similar to the PL measurements, an anti-crossing between QD and cavity mode is observed in the resonant scattering spectrum of the cavity. At the QD resonant frequency the cavity scattering is suppressed due to strong coupling Hughes and Kamada (2004); Waks and Vuckovic (2006a); Englund et al. (2007); Shen and Fan (2009). The inset shows the measured cavity scattering spectrum taken at 39 K when the QD is resonant with the cavity, which exhibits a doublet due to strong cavity-QD interactions. The solid line in the inset is a theoretical fit assuming a Jaynes-Cummings interaction model Bose et al. (2011a); Waks and Sridharan (2010).
We first investigate the nonlinearity of the device under continuous wave excitation by injecting a second control field from a narrowband tunable external cavity diode into the input grating along with the broadband LED. The control field is detuned from the cavity resonance by 0.12 nm. Figure 2b shows the resulting scattering spectrum, taken when the QD is resonant with the cavity, for two different control field powers. The dashed green line shows the scattering spectrum when only the control is present. At a control power of 14.5 W (measured before the input grating) we observe indirect scatter from the cavity polaritons due to non-resonant energy transfer Winger et al. (2009); Ates et al. (2009); Englund et al. (2010); Majumdar et al. (2010). The blue curve shows the scattering spectrum of the broadband LED when injected with the control, where we have subtracted the indirect scatter from the control field. At 0.1 W of control power the control field is weak and does not affect the cavity scatter, which exhibits a dip at the QD resonant frequency. As the control field power is increased to 14.5 W, we see that the position of the dip induced by the QD is red shifted due to the optical Stark effect and the contrast is slightly reduced due to saturation Fushman et al. (2008). The Stark shift enables the control field to optically modify the amount of signal scattered or transmitted, providing the possibility for all-optical switching. We note that the contrast of the dip in Figure 2b is reduced as compared to the inset to Figure 2a, even at low control powers. This reduction occurs because we are using a relatively large signal power to minimize the contribution of incoherent photons from the control, which partially saturates the QD.
We next perform dynamic pump-probe measurements where the control and signal pulses are generated by two synchronized Ti:Sapphire lasers. The pump laser has a pulse duration of 80 ps. The probe laser initially emits 5 ps pulses that are filtered down to a bandwidth of 0.02 nm (7 GHz), corresponding to a 60 ps pulse duration, using a fiber Bragg grating. The bandwidth of the probe laser is chosen to be approximately half the spectral width of the dip induced by the QD in the scattering spectrum, which is equal to in the strong coupling regime. The pump pulse train is synchronized to the probe by a piezo feedback in the pump laser cavity, and the delay between the pump and probe is controlled electrically by a phase-locked loop in the synchronization circuit. Measurements are taken at a fixed signal and control frequency, which are selected such that when the QD is resonant with the cavity, the signal is resonant with the QD and the control is resonant with the lower polariton as indicated by the dashed lines in Figure 2a. The signal field intensity is set to be sufficiently weak to be in the linear response regime of the cavity-QD system. Temperature tuning is used to tune the QD through the signal field center frequency. The signal and control fields can be collected either directly from the cavity or from the output coupler, and are separated by a grating spectrometer.
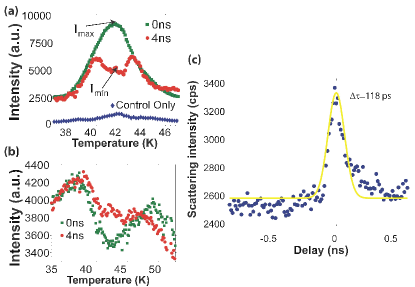
Figure 3a shows the scattering intensity collected directly from the cavity as a function of temperature when the delay between signal and control is set to both 0 ns and 4 ns. At 4 ns delay, the pulses excite the cavity at different times and therefore do not interact. In this case the cavity scattering spectrum is suppressed when the QD is resonant with the signal energy (41.8 K) due to cavity-QD interactions. We note that the temperature where resonance is achieved is slightly different than that of Figure 2a because of a gradual red-shift of the cavity resonance frequency which is observed over the course of the measurement process. When the control and signal arrive simultaneously at the cavity (zero ns delay), we observe a significant increase of the cavity scatter at same temperature. The switching contrast, defined as where and are the scattering intensities at the QD resonant frequencies at zero and large delays respectively, is calculated to be 0.44. Figure 3b shows the behavior of the signal transmitted to the output coupler, which exhibits the conjugate effect where transmission is enhanced when the QD is resonant with the signal frequency.
In Figure 3a we also plot the case where only a control pulse is injected (blue diamonds). In this case there is still some optical energy at the QD frequency. The noise to signal ratio is 0.18 (at 0 ns delay), which is lower than the value of 0.35 for the CW case shown in the top panel of Figure 2b, even though in pulsed operation the signal is well below QD saturation and the detuning between the QD and control frequency is significantly smaller. Furthermore, in the pulsed case the noise is mostly dominated by the spectral overlap between the signal and control as opposed to non-resonant energy transfer. Thus, although noise injection from the control field can be a problem in CW measurements, it is a much smaller effect for pulsed switching operation. We attribute this difference to the fact that incoherent control field scattering is proportional to the average control power while Stark shift and saturation are proportional to peak control power. In pulsed operation, we can achieve a high peak power with a relatively low average power, which significantly reduces incoherent scattering. To measure the switching speed of the system, we fix the sample temperature at the strong coupling point and plot the cavity scatter as a function of delay between pump and probe, as shown in Figure 3c. The scatter exhibits a sharp peak near 0 ns delay, which is fit to a Gaussian function. From the fit we determine that the switching occurs over a 118 ps response time.
To determine the control pulse energy, we need to know the efficiency with which light is injected into the waveguide mode by the grating coupler. We use an optical Stark shift measurement to precisely measure this coupling efficiency Bose et al. (2011b). The measurement proceeds by setting the sample temperature to 45 K where the QD is red shifted from the cavity mode by 55 GHz. A tunable external cavity laser diode is focused onto the input grating and tuned to be resonant with the cavity mode. We monitor the QD emission through non-resonant energy transfer and record the spectrum as a function of pump power. For each spectrum the emission from the QD is fit to a Lorentzian function to determine the center frequency. The experimental result of Stark shift of the QD as a function of pump power are plotted as red circles in Figure 4.
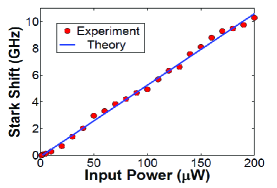
The Stark shift data can be directly used to determine the energy propagating in the waveguide by fitting the results to numerical simulations performed using the full master equation formalism. The master equation is given by where is the density matrix of the cavity-QD system, is the Hamiltonian, and is the Liouvillian superoperator that accounts for losses and decay of the system. We define as the bosonic annihilation operator for the cavity field, and as the dipole lowering operator for the QD. The Hamiltonian is given, in the reference frame of the input field, by where is the detuning between the cavity and QD, is the in-plane coupling rate between the cavity and the QD, and is the electromagnetic field amplitude traveling in the waveguide. The Liouvillian is given by where for any collapse operator we have . We treat the coupling efficiency as fitting parameter given by , where is the experimentally measured incident power and is the optical power propagating in the waveguide.
Simulations are performed using the measured values of and . The QD decay rate, obtained from a numerical fit of the inset to Fig. 2a, is given by GHz. To determine the in-plane coupling rate , we perform in-plane transmission measurements of the waveguide at a temperature of K so that the QD is well detuned from the cavity mode. The measurement procedure for obtaining this decay rate is described in detail in Ref. Bose et al. (2011a), and the detailed measurement results for the device used in this work are provided in the supplementary material. From these measurements we obtain the in-plane decay rate of GHz. The power spectrum of the cavity mode, defined as the Fourier transform of the two-time covariance function , is calculated as a function of using standard quantum regression theory. From the power spectrum we determine the center wavelength and linewidth of the QD using a Lorentzian fit, and numerically optimize to achieve best agreement between simulation and experimental results based on the measured incident power . All calculations are performed using an open source quantum optics toolbox Sze (1999). The waveguide coupling efficiency is found to be . The solid line in Fig. 4 shows the theoretical fit using this coupling efficiency, which exhibits superb agreement with the experimentally measured values.
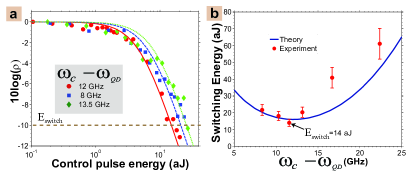
Having determined the coupling efficiency of the grating coupler into the waveguide, we can precisely determine the switching energy of the device. We define the switching energy of the device as the amount of energy in the control pulse propagating in the waveguide needed to induce 90% of the maximum change in reflectivity. Figure 4a plots the relative change in signal scattering intensity, defined as where I is the scattering intensity and and are previously defined, as a function of control pulse energy for three different detunings between the control pulse frequency and QD frequency . As the control pulse intensity is increased, the device makes a smooth transition from to an asymptotic value of at high control energies. For each curve, we fit the data to a theoretical mode given by , where is the control pulse energy, MHz is the pulsed laser repetition rate, and is treated as a fitting parameter. The horizontal line represents 10 dB (90%) change in , which defines the switching energy. At 12 GHz detuning (red circles), which is close to resonance with the lower polariton, we achieve a switching energy of aJ. The blue squares and green diamonds plot the cases where the pump is blue shifted and red shifted from the lower polariton. In both cases a higher pumping intensity is required, which manifests itself in a shift of the switching curve to higher energies. Figure 4b plots the switching energy as a function of detuning of the control frequency from the QD frequency. A solid line plots the theoretical curve based on a semiclassical Stark shift model for the nonlinearity (see Supplementary Information). A minimum switching energy is predicted near the lower polariton frequency at GHz detuning, which is consistent with experimental measurements. When the control laser is resonant with the lower polariton, the fraction of light coupled to the cavity is given by . The energy dissipation of the device can be upper bounded by fraction of control energy that couples to the cavity and is therefore given by attojoules.
In conclusion, we have investigated the dynamic switching properties of a QD strongly coupled to a photonic crystal cavity. Extremely low switching energies of 14 attojoules were attained, which are promising numbers for potential applications in all-optical data routing and optical logic. Further improvements in the coupling between the cavity and waveguide could potentially enable optical switching at the single photon level, which is of great importance in quantum optics and quantum information.
D. Sridharan and R. Bose contributed equally to this work. This work was supported by a DARPA Defense Science Office grant (Grant W31P4Q0910013), the Physics Frontier Center at the Joint Quantum Institute, the Office of Naval Research Applied Electromagnetics Center, the Army Research Office MURI on hybrid quantum interactions (grant number W911NF09104), and a National Science Foundation CAREER award (grant number ECCS - 0846494)
References
- Miller (2010) D. A. B. Miller, Nat. Photonics 4, 3 (2010).
- Gopal et al. (2002) A. V. Gopal, H. Yoshida, A. Neogi, N. Georgiev, and T. Mozume, IEEE J. Sel. Topics Quantum Electron. 38, 1515 (2002).
- Takahashi et al. (1996) R. Takahashi, Y. Kawamura, and H. Iwamura, App. Phys. Lett. 68, 153 (1996).
- Nakamura et al. (2001) S. Nakamura, Y. Ueno, and K. Tajima, App. Phys. Lett. 78, 3929 (2001).
- Dorren et al. (2004) H. J. S. Dorren, X. Yang, A. K. Mishra, Z. Li, H. Ju, H. de Waardt, G. D. Khoe, T. Simoyama, H. Ishikawa, H. Kawashima, et al., IEEE J. Sel. Topics Quantum Electron. 10, 1079 (2004).
- Nielsen et al. (2006) M. L. Nielsen, J. Mork, R. Suzuki, J. Sakaguchi, and Y. Ueno, Opt. Express 14, 331 (2006).
- Andrekson et al. (2008) P. A. Andrekson, H. Sunnerud, S. Oda, T. Nishitani, and J. Yang, Opt. Express 16, 10956 (2008).
- Hinton et al. (2008) K. Hinton, G. Raskutti, P. M. Farrell, and R. S. Tucker, IEEE J. Sel. Topics Quantum Electron. 14, 938 (2008).
- Husko et al. (2009) C. Husko, A. D. Rossi, S. Combrie, Q. V. Tran, F. Raineri, and C. W. Wong, 94, 021111 (2009).
- Nozaki et al. (2010) K. Nozaki, T. Tanabe, A. Shinya, S. Matsuo, T. Sato, H. Taniyama, and M. Notomi, Nat. Photonics 4, 477 (2010).
- Matsuo et al. (2010) S. Matsuo, A. Shinya, T. Kakitsuka, K. Nozaki, T. Segawa, T. Sato, Y. Kawaguchi, and M. Notomi, Nat. Photonics 4, 648 (2010).
- Yoshie et al. (2004) T. Yoshie, A. Scherer, J. Hendrickson, G. Khitrova, H. M. Gibbs, G. Rupper, C. Ell, O. B. Shchekin, and D. G. Deppe, Nature 432, 200 (2004).
- Hughes and Kamada (2004) S. Hughes and H. Kamada, Phys. Rev. B 70, 195313 (2004).
- Waks and Vuckovic (2006a) E. Waks and J. Vuckovic, Phys. Rev. Lett. 96, 153601 (2006a).
- Englund et al. (2007) D. Englund, A. Faraon, I. Fushman, N. Stoltz, P. Petroff, and J. Vuckovic, Nature 450, 857 (2007).
- Shen and Fan (2009) J.-T. Shen and S. Fan, Phys. Rev. A 79, 023837 (2009).
- Bose et al. (2011a) R. Bose, D. Sridharan, G. S. Solomon, and E. Waks, Opt. Express 19, 5398 (2011a).
- Waks and Vuckovic (2006b) E. Waks and J. Vuckovic, Phys. Rev. A 73, 041803 (2006b).
- Auffeves-Garnier et al. (2007) A. Auffeves-Garnier, C. Simon, J. M. Gerard, and J. P. Poizat, Phys. Rev. A 75, 053823 (2007).
- Srinivasan and Painter (2007) K. Srinivasan and O. Painter, Nature 450, 862 (2007).
- Fushman et al. (2008) I. Fushman, D. Englund, A. Faraon, N. Stoltz, P. Petroff, and J. Vuckovic, Science 320, 769 (2008).
- Bose et al. (2011b) R. Bose, D. Sridharan, G. S. Solomon, and E. Waks, App. Phys. Lett. 98, 121109 (2011b).
- Faraon et al. (2008) A. Faraon, I. Fushman, D. Englund, N. Stoltz, P. Petroff, and J. Vuckovic, Opt. Express 16, 12154 (2008).
- Waks and Sridharan (2010) E. Waks and D. Sridharan, Phys. Rev. A 82, 043845 (2010).
- Winger et al. (2009) M. Winger, T. Volz, G. Tarel, S. Portolan, A. Badolato, K. J. Hennessy, E. L. Hu, A. Beveratos, J. Finley, V. Savona, et al., Phys. Rev. Lett. 103, 207403 (2009).
- Ates et al. (2009) S. Ates, S. M. Ulrich, A. Ulhaq, S. Reitzenstein, A. Loffler, S. Hofling, A. Forchel, and P. Michler, Nat. Photonics 3, 724 (2009).
- Englund et al. (2010) D. Englund, A. Majumdar, A. Faraon, M. Toishi, N. Stoltz, P. Petroff, and J. Vuckovic, Phys. Rev. Lett. 104, 73904 (2010).
- Majumdar et al. (2010) A. Majumdar, A. Faraon, E. D. Kim, D. Englund, H. Kim, P. Petroff, and J. Vuccaronkovicacute, Phys. Rev. B 82, 045306 (2010).
- Sze (1999) M. T. Sze, J. of Opt. B: Quantum Semiclassical Opt. 1, 424 (1999).