GRB 070125 and the environments of spectral-line poor afterglow absorbers††thanks: Based on target-of-opportunity observations collected in service mode under program ID 078.D-0416, P.I. Vreeswijk, with the FOcal Reducer/low dispersion Spectrograph 2 (FORS2 Appenzeller et al., 1998) installed at the Cassegrain focus of the Very Large Telescope (VLT), Unit 1, Antu, operated by the European Southern Observatory (ESO) on Cerro Paranal in Chile. For further information or questions on the content of the paper, please e-mail annalisa@raunvis.hi.is.
Abstract
GRB 070125 is among the most energetic bursts detected and the most extensively observed so far. Nevertheless, unresolved issues are still open in the literature on the physics of the afterglow and on the GRB environment. In particular, GRB 070125 was claimed to have exploded in a galactic halo environment, based on the uniqueness of the optical spectrum and the non-detection of an underlying host galaxy. In this work we collect all publicly available data and address these issues by modelling the NIR-to-X-ray spectral energy distribution (SED) and studying the high signal-to-noise VLT/FORS afterglow spectrum in comparison with a larger sample of GRB absorbers. The SED reveals a synchrotron cooling break in the UV, low equivalent hydrogen column density and little reddening caused by a LMC- or SMC-type extinction curve. From the weak Mg ii absorption at in the spectrum, we derived (Mg ii and upper limits on the ionic column density of several metals. These suggest that the GRB absorber is most likely a Lyman limit system with a metallicity. The comparison with other GRB absorbers places GRB 070125 at the low end of the absorption line equivalent width distribution, confirming that weak spectral features and spectral-line poor absorbers are not so uncommon in afterglow spectra. Moreover, we show that the effect of photo-ionization on the gas surrounding the GRB, combined with a low (H i) along a short segment of the line of sight within the host galaxy, can explain the lack of spectral features in GRB 070125. Finally, the non-detection of an underlying galaxy is consistent with a faint GRB host galaxy, well within the GRB host brightness distribution. Thus, the possibility that GRB 070125 is simply located in the outskirts of a gas-rich, massive star-forming region inside its small and faint host galaxy seems more likely than a gas-poor, halo environment origin.
keywords:
gamma-ray burst: individual: GRB 0701251 Introduction
The progenitors of long gamma ray bursts (GRBs) are believed to be rapidly rotating massive stars (for a review, see Woosley, 1993; MacFadyen & Woosley, 1999). The observations of some SNe associated with GRBs have corroborated this hypothesis (Woosley & Bloom, 2006; Hjorth & Bloom, 2011, and references therein), implying that long GRBs are located in star-forming regions. Within the fireball model (see Piran, 2004; Mészáros, 2006, for a review) the GRB afterglow is produced by the interaction of an expanding blast wave with the surrounding medium. The external shocks are responsible for the synchrotron radiation, from X-rays to optical and down to radio frequencies as the blast wave decelerates. The spectral energy distribution (SED) and its evolution is described by the fireball model (Sari, Piran & Narayan, 1998; Granot & Sari, 2002). Modelling the SED can simultaneously provide information on the intrinsic spectral shape of the GRB, i.e. the fireball physical parameters, and on the GRB local and host galaxy environment. In the latter case, this includes the circumburst density or the line of sight dust extinction, depending on whether the broadband blast wave, down to radio frequencies, is modelled (e.g., Panaitescu & Kumar, 2002; Björnsson, Gudmundsson & Jóhannesson, 2004; de Ugarte Postigo et al., 2005; van der Horst et al., 2005; Jóhannesson, Björnsson & Gudmundsson, 2006; Rol et al., 2007) or the optical-to-X-ray SED (Starling et al., 2007, 2008; Schady et al., 2010; Zafar et al., 2011). The interstellar medium of the GRB host galaxy can also be investigated through absorption line spectroscopy of the afterglow, providing the chemical composition of different ions in the absorbing gas and possibly its metallicity (e.g., Vreeswijk et al., 2004; Fynbo et al., 2006; Savaglio, 2006; Prochaska et al., 2007; Ledoux et al., 2009).
GRB 070125 is among the most energetic bursts detected so far, both in the prompt high energy release (with an isotropic emitted energy erg: Bellm et al., 2008) and its afterglow (with a collimation-corrected blast wave kinetic energy of more than erg: Chandra et al., 2008). The optical afterglow is amongst the brightest at around one day after the burst, when redshift-corrected ( shifted at : Updike et al., 2008; Kann et al., 2010). The brightness of the event allowed a global monitoring campaign of the afterglow resulting in one of the largest datasets collected so far, covering radio, mm, NIR, optical, UV and X-rays (Cenko et al., 2008; Chandra et al., 2008; Dai et al., 2008; Updike et al., 2008; Kann et al., 2010). Despite the observational effort, there is still much debate over both the jet properties and the type of environment in which GRB 070125 was situated.
Based on the absence of strong spectral features and of a bright underlying host, GRB 070125 was reported to be the first long GRB to have exploded in a galactic halo environment. This would pose a challenge to modelling of progenitor objects. In particular, the GRB site was suggested to be in a compact stellar cluster that resulting from the interaction of two blue faint galaxies at a projected distance of and kpc111Derived from the and angular distance between the afterglow and the two putative host galaxies. (Cenko et al., 2008). However, a very limited sample of GRB afterglows was used as reference to argue the peculiarity of the spectrum (few spectral features, weak Mg ii absorption and low inferred (H i)). By contrast, from a partial broadband SED analysis, Chandra et al. (2008) found a very high circumburst density ( cm-3, from the kinetic energy and cm-3, from the broadband modelling of the SED). However, in their data it was not possible to distinguish between a constant or a wind-like density profile nor to firmly constrain the putative (chromatic) jet break and the inverse Compton influence on it. On the other hand, Dai et al. (2008) claimed a “textbook” achromatic jet break at 5.8 days after the burst. Another open issue is the presence or absence of a synchrotron cooling break in the SED between the optical and X-rays and the agreement or not of the data with the fireball closure, as discussed in (Updike et al., 2008).
In this work, we collect the multitude of observations spread through the literature and analyse them together in order to obtain a coherent picture of the GRB environment. In particular, we investigate the location of a synchrotron cooling break and the environment dust and metal content by studying the NIR-to-X-ray SED at different epochs. Furthermore, we analyse the very high signal-to-noise (S/N) VLT/FORS spectrum of the afterglow and discuss the possible implications for the absorber environment. We then compare the spectral features to the large sample of GRB afterglows with redshift collected in Fynbo et al. (2009) and two sub-samples of GRBs potentially similar to GRB 070125. The observations and data analysis are presented in Sec. 2 and Sec. 3 respectively, the SED modelling in Sec. 4 and the discussion in Sec. 5. Our conclusions are summarized in Sec. 6.
Throughout the paper we use the convention for the flux density of the afterglow, where is the temporal slope and is the spectral slope. We refer to the Solar abundances measured by Asplund et al. (2009) and adopt cm-2, as the linear unit of column densities, . Hereafter, we assume a standard CDM cosmology with = 70.4 km s-1 Mpc-1, = 0.27 and = 0.73 (Jarosik et al., 2011).
2 Observations and data reduction
GRB 070125 was localized by the Interplanetary Network (Mars Odyssey, Suzaku, INTEGRAL and RHESSI) at 07:20:45 UT (Hurley et al., 2007), and subsequently observed by Swift. The high energy properties of the GRB prompt emission are discussed in Bellm et al. (2008). The optical afterglow was first localized by Cenko & Fox (2007) at the position R.A. and Dec. (J2000) and the host galaxy redshift, , was determined from a Mg ii doublet absorption in a Gemini-North/GMOS afterglow spectrum (Fox et al., 2007). Thanks to the brightness of the afterglow, a multitude of observations in the optical and NIR could be secured with 20 telescopes (e.g., Chandra et al., 2008; Updike et al., 2008; Kann et al., 2010).
2.1 Swift XRT
The Swift X-ray telescope (XRT, Burrows et al., 2005) began observing the GRB 070125 field 12.97 hrs after the trigger and continued to monitor the decaying afterglow in photon counting (PC) mode for 15 orbits or 173 ks of exposure time. The last observations ended on 2007 February 12 at 23:50 UT, 18.69 days after the burst trigger. We obtained the XRT event files from the UK Swift Science Data Centre archive222http://www.swift.ac.uk/swift_portal and processed them using the standard Swift XRT pipeline software version 0.12.3 and calibration database CALDB-11.
We extracted X-ray spectra and response files for each orbit individually as well as a late-time combined spectrum comprising orbit 3 onwards. Spectra were grouped such that a minimum of 20 counts fell in each bin and spectral analysis was performed with the XSPEC spectral fitting package (Arnaud, 1996), version 12.6.0.
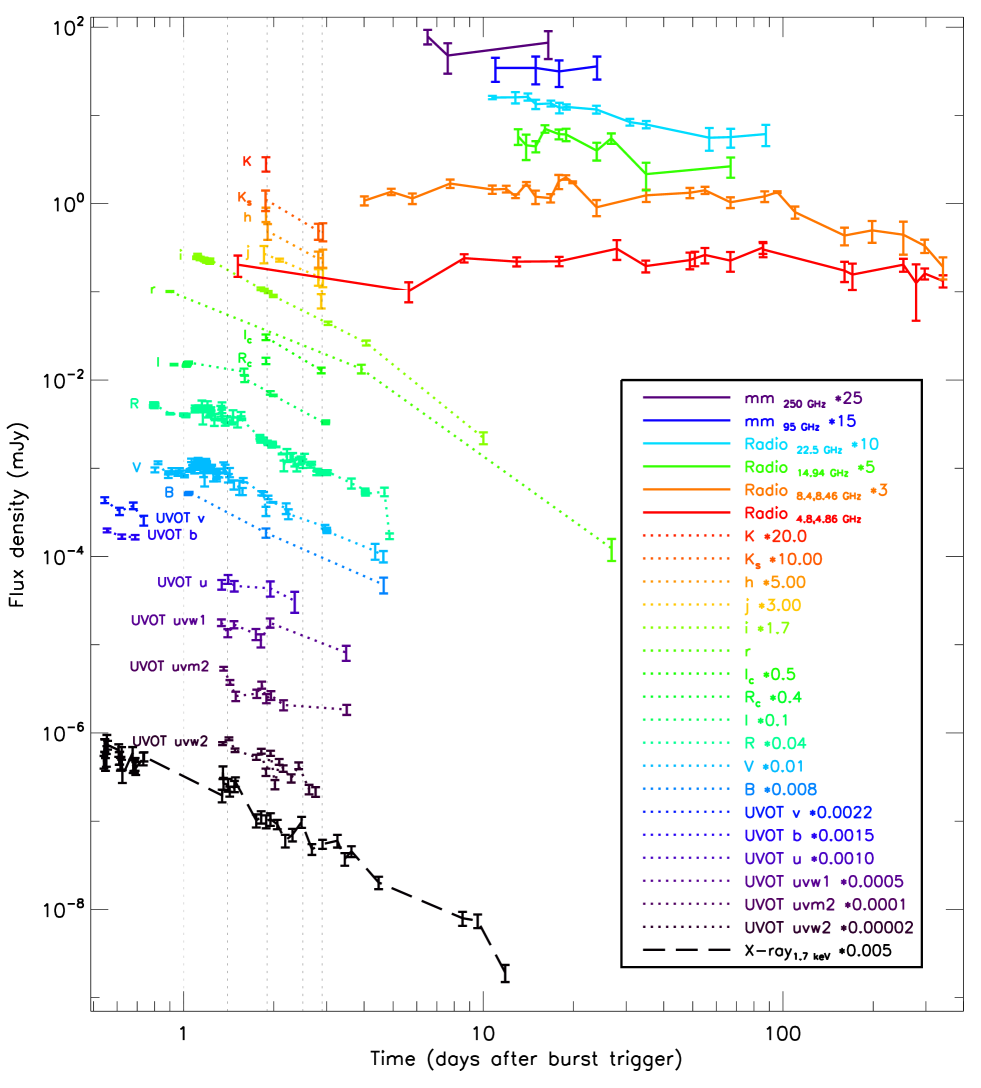
We extracted a 0.3–10 keV light curve and transformed the count rate to flux using 3 conversion factors derived from spectra of orbit 1, orbit 2 and orbit 3 onwards of 1 ct s erg cm-2 s-1, respectively. These three intervals were selected in order to apply the proper conversion factor to each regime, from the brighter to the late fainter epochs. We also collected the dynamically binned XRT flux light curve from the Swift repository (Evans et al., 2007), which was converted from count rate to flux with the average conversion factor, 1 ct s-1 ergs cm-2 s-1. We then converted the binned and unbinned light curves into flux density at 1.73 keV, the logarithmic average of the XRT band (0.3–10 keV), assuming a spectral slope , as found in Sect. 3.1. The binned XRT light curve is shown in Fig. 1.
2.2 Swift UVOT
The afterglow of GRB 070125 was detected with the Swift ultraviolet/optical telescope (UVOT, Roming et al., 2005) in all six lenticular filters spanning to (covering a range between 546–193 nm). These observations were coincident with those of the Swift XRT during the period 12.97 hrs to 18.69 days after the trigger. The optical/UV transient was detected out to 3.5 days after the trigger. We inspected the UVOT sky images and selected those of sufficient quality to perform photometry to an accuracy of 0.4 magnitudes or better. We performed photometry on the images using the uvotsource task included in HEASOFT v6.7 and calibrations provided by Poole et al. (2008). We used a 5 radius source extraction region, and a nearby 20 radius source-free background region. The UVOT photometry is reported in the appendix
2.3 VLT/FORS2
Starting at 04:25 UT on 2007 January 26 (21.1 hours post-burst), a series of spectra were obtained with VLT/FORS2 in long-slit spectroscopy mode with a 10 wide slit. The sequence of grisms used was 300V, 600z+OG590, 1400V and 1200R+GG435. This allowed us to both cover a larger wavelength window with the lower resolution grism (300V) and obtain mid-resolution spectroscopy for different regions of the spectrum. Cosmic ray removal was performed on each individual spectrum using the Laplacian Cosmic Ray Identification algorithm of van Dokkum (2001). The seeing remained relatively stable during the observations, between 06 and 09, yielding the spectral resolutions and excellent S/N, reported in Table 1.
| Start time | Exp. time | Grism | Coverage | Resolution | Airmass | Seeing | S/N /pixel | |
|---|---|---|---|---|---|---|---|---|
| UT (hh:mm:ss) | (hrs) | (min) | (Å) | (Å) | (mean) | |||
| 04:25:24 | 21.20 | 15 | 300V | 3190–9640 | 10.7 | 1.8 | 0.80 | 54 |
| 04:53:31 | 21.80 | 30 | 600z | 7460–10740 | 5.3 | 1.8 | 0.72 | 39 |
| 05:25:14 | 22.32 | 30 | 1400V | 4630–5930 | 2.0 | 1.9 | 0.87 | 39 |
| 05:56:40 | 22.85 | 30 | 1200R | 5870–7370 | 2.2 | 2.1 | 0.62 | 43 |
2.4 Literature data collection
We gathered all the data on GRB 070125 available in the literature from Chandra et al. (2008), Updike et al. (2008) and Kann et al. (2010), covering radio to optical frequencies. We exclude the observations from GRB Coordinates Network (GCNs) circulars reported in Chandra et al. (2008), with the exception of three NIR datapoints333The three GCN measurements do not strongly influence the NIR light curves, since they are very close to the NIR photometry reported by Updike et al. (2008) at 2.9 after the burst. (), given the limited NIR coverage. In addition, we include the Swift UVOT and XRT observations that we analysed. In all, 365 NIR to UV photometric data points were collected, for a total of 19 filters, and 77 radio and mm data points. We converted the magnitudes into flux density using the zero-points available for each specific filter. All the magnitudes were corrected for Galactic extinction ( mag), as listed by Schlegel, Finkbeiner & Davis (1998), and for transmission through the Ly forest at redshift 1.5477 in each optical and UV band (e.g., Madau, 1995) adopting the spectral slope, =0.58, as derived from the optical SED (Updike et al., 2008). The corresponding transmissions are , , and . The light curves for each filter are shown in Fig. 1. The dataset that we used is rather inhomogeneous, as it is collected from different sources in the literature. Despite the uncertainty on the single data points, the interpolation of the flux densities at a given epoch are weighted by these errors, giving more importance to the more precise measurements. Thus, the uncertainties due to the inhomogeneous sample are limited, given the large dataset, and cannot significantly influence our results.
3 Spectral analysis
3.1 X-ray spectrum
We first independently modelled the spectrum of each orbit with a simple power law, absorbed by gas at redshift , as derived from the spectral analysis (see Sec. 3.2), finding no evidence for spectral variability in the XRT data alone within this model. The Galactic absorption was fixed at 4.3 1020 cm-2 (Kalberla et al., 2005). We then extracted the time-averaged spectrum over the whole XRT observation. Modelling the overall spectrum we derived a power-law spectral slope , a soft X-ray absorption at the host galaxy redshift, (H) cm-2 and for 40 degrees of freedom (dof). The quoted errors correspond to 90% confidence. The modelled absorbed flux (0.3–10 keV) is ergs cm-2 s-1. The uncertainty on the host (H) is sufficiently large that it would be consistent with only Galactic foreground absorption. Given that the Galactic (H) is typically cm-2 (with uncertainties of about % (Dickey & Lockman, 1990; Kalberla et al., 2005), it is often not possible to tightly constrain a low GRB host galaxy (H).
3.2 Optical spectrum
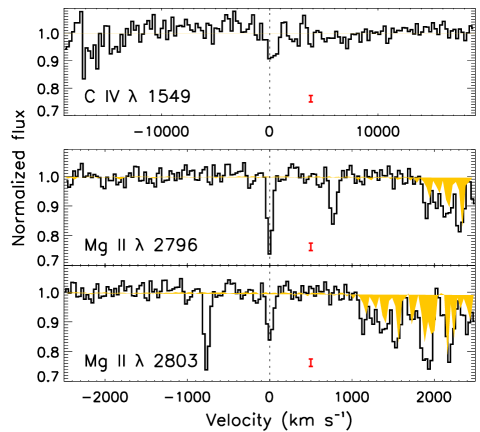
The absorption lines detected in the FORS spectra are listed in Table 2, along with the equivalent widths (s). The absorption lines associated with the system are shown in Fig. 2. The apertures used to measure the s are derived from the resolution in each grism, i.e. twice the full width at half maximum of the arc lines (), justified by the narrowness of both the Mg ii and C iv lines. These lines are unresolved, the width of the Mg ii 2803 Å line being km s-1.
The low spectral resolution does not allow us to directly derive the column density from the detected in the optically thin limit, even for the weak s we measure, since the lines may be saturated. In particular, this could affect the Mg ii, despite the ratio of the Mg ii 2796 and Mg ii 2803 Å suggests little or no saturation. A proper curve of growth (CoG, e.g., Mihalas, 1978) analysis would require many transitions to constrain the value (Doppler parameter, ). However, we can benefit from the excellent S/N and the narrowness of the transitions to constrain the column density with the CoG, despite the limited number of detections. We studied the CoG evolution with the value of the Mg ii 2796, 2803 transitions. The rest-frame of the absorption lines fall between the linear and the saturated part of the CoG, i.e., the Mg ii column density has a slight dependency on the value. We can limit the plausible range to km s-1, as the line broadening must be narrower than the observed km s-1 (). The lower limit is selected from the lowest velocity width of low-ionization line profiles observed in UVES QSO absorbers444The lower observed value is km s-1, where is the velocity width that covers 95% of the complex line profile. If the line profile is a single Gaussian then , corresponding to a minimum observed km s-1. This represent only an estimate of the width of the observed line profile, despite the single components of the complex profile not being resolved with low resolution spectroscopy. The UVES spectrum of GRB 050730 showed single component line profiles with km s-1. Of course, the possibility that the line profile is a single component with a very low can never be totally excluded. This would result in higher saturation of such component, leading to a higher value of (Mg ii). A higher (Mg ii) would only strengthen the conclusions of this paper. The Mg ii column density derived in the optically thin limit is (Mg ii) . (Ledoux et al., 2006a). The 2803 absorption line gives the tightest constraint, (Mg ii ( errors), derived considering the median column density within the and interval. The Mg ii 2803 CoG is shown in Fig. 3. So far we used and the limits on to derive the Mg ii column density. On the other hand, the Mg ii column density derived from the 2803 allows us to use the 2796 CoG to further constrain the value to be km s-1. With these limits on we cannot derive the C iv column density, because the 1549 CoG shows that the absorption line is saturated. We list the upper limits on the non-detected lines in Table 3, measuring the noise level at each line position, again with apertures. The excellent S/N allows us to put strict constraints on the column densities of some ions, such as Fe ii.

| Ion | (Å) | (Å) | (Å) | ||
| 300V | |||||
| C iv | 1549 | 3949.55 | 1.5497 | 8.5 | |
| 1200R | |||||
| Mg ii | 2796.35 | 7124.30 | 1.5477 | 7.2 | |
| Mg ii | 2803.53 | 7142.74 | 1.5478 | 7.0 | |
| 1400V | |||||
| Na i | 5891.58 | 5891.58 | 0.000 | 0.680.08 | 8.5 |
| Na i | 5897.56 | 5897.56 | 0.000 | 0.410.08 | 5.1 |
| Ion | (Å) | (Å) | log N | Grism |
|---|---|---|---|---|
| C ii | 1334.53 | 300V | ||
| Si iv | 1393.75 | 300V | ||
| Si ii | 1526.71 | 300V | ||
| Al ii | 1670.79 | 300V | ||
| Ni ii | 1741.55 | 300V | ||
| S i | 1807.31 | 300V | ||
| Al iii | 1854.72 | 1400V | ||
| Ti ii | 1910.93 | 1400V | ||
| Zn ii | 2026.14 | 1400V | ||
| Cr ii | 2056.25 | 1400V | ||
| Fe ii | 2382.76 | 1200R | ||
| Fe ii* | 2396.35 | 0.07 | 12.64 | 1200R |
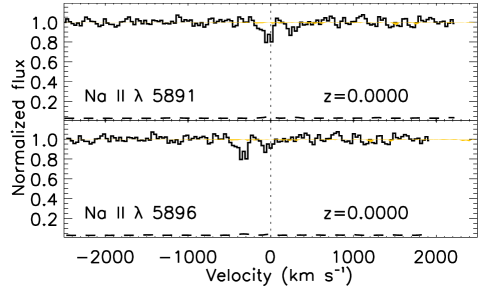
We identified Galactic () absorption of the Na i 5891,5897 doublet in both 1200R and 1400V FORS spectra and we report the in Table 2. The Galactic absorption is shown in Fig. 10. The Galactic reddening in the direction of the target measured by Schlegel, Finkbeiner & Davis (1998) is mag. For comparison, we derive the reddening from the Galactic Na i - correlation given by Munari & Zwitter (1997), finding a higher reddening value, mag, but consistent within the reddening uncertainty in their correlation (0.15 mag).
4 Afterglow modelling: the NIR-to-X-ray SED
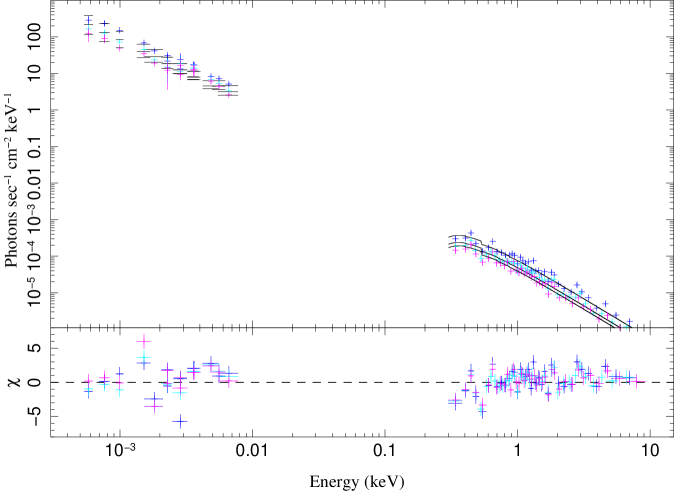
In order to investigate any temporal evolution of the spectral energy distribution (SED) from the NIR to X-ray frequencies, we evaluated the SED at five epochs after the burst trigger. The SED times 1.0, 1.4, 1.9, 2.5, 2.9 days were selected in order to maximize the NIR to UV data coverage for each epoch and minimize extrapolations, as shown in Fig. 1. For each SED epoch, we combine the available NIR to UV photometric data points and the ones derived by interpolating or extrapolating the light curves where necessary, for each filter. The flux interpolations at particular times were performed locally, i.e., using up to three adjacent data points on each side. The X-ray spectra at the five epochs were produced by scaling the overall X-ray spectrum to the actual count-rate at each time of interest. This choice allowed to preserve the best S/N, justified by the lack of spectral evolution measured for the X-ray data alone (see Sec. 3.1).
The SED was created and fitted in count space using the ISIS spectral fitting package (Houck & Denicola, 2000) and following the method given by Starling et al. (2007), having the advantage that no model for the X-ray data needed to be assumed a priori. Furthermore, as all the data are flux-calibrated, no additional offset were needed. We fit the SED using models consisting of an absorbed power law or absorbed broken power law with slopes free or fixed to a slope difference of , as expected for a cooling break (Sari, Piran & Narayan, 1998). The latter model is referred to as “tied broken power law”, since the spectral slope at lower energies than the break energy , , is tied to the spectral slope at higher energies, (). The intrinsic optical extinction was modelled with either Milky Way (MW), Large Magellanic Cloud (LMC) or Small Magellanic Cloud (SMC) extinction curves, as parametrized by Pei (1992). The X-ray absorption is modelled with the XSPEC model zphabs, assuming Solar metallicity. We also tested the model for a lower metallicity. The results for each independent epoch are presented in the appendix, Table 7. We note that the flaring activity, also reported by Updike et al. (2008), significantly affects the SED modelling at early epochs.
We also explored the SED evolution by tying some parameters between the epochs, where they are not expected to change in time. The tied parameters are the host and (H), since we do not expect the host extinction and absorption to vary at two days after the burst, and the spectral slope at higher energies, , since we detected no significant X-ray spectral evolution (Sec. 3.1). The spectral slope at lower energies, , and were left free to vary between the epochs. We excluded epoch I and epoch II from the SED fit tied between the epochs to avoid the flaring activity at early times, see Fig. 1. These joint fits are listed in Table 4 and Fig. 4 shows the best fitting joint model to the last 3 epochs. We discuss the best fitting model and a comparison with the results of broadband SED modelling in Sec. 5.
| Ext. | Model | [dof] | (H) | Epoch | ||||
|---|---|---|---|---|---|---|---|---|
| type | (mag) | ( cm-2) | (eV) | |||||
| PL | 4.06 [148] | ——— | ——— | III | ||||
| ——— | ——— | IV | ||||||
| ——— | ——— | V | ||||||
| BPL | 2.85 [146] | III | ||||||
| SMC | IV | |||||||
| V | ||||||||
| TIED BPL | 2.96 [147] | III | ||||||
| IV | ||||||||
| V | ||||||||
| PL | 4.06 [148] | ——— | ——— | III | ||||
| ——— | ——— | IV | ||||||
| ——— | ——— | V | ||||||
| BPL | 2.84 [146] | III | ||||||
| LMC | IV | |||||||
| V | ||||||||
| TIED BPL | 2.97 [147] | III | ||||||
| IV | ||||||||
| V | ||||||||
| PL | 4.06 [148] | ——— | ——— | III | ||||
| ——— | ——— | IV | ||||||
| ——— | ——— | V | ||||||
| BPL | 2.99 [146] | III | ||||||
| MW | IV | |||||||
| V | ||||||||
| TIED BPL | 4.14 [147] | III | ||||||
| IV | ||||||||
| V |
5 Discussion
5.1 The spectral energy distribution
The jointly fit epoch III–V NIR-to-X-ray SED of GRB 070125 is best described by a broken power law with (tied between the epochs), and for epoch III, IV and V respectively ( for 146 degrees of freedom, dof, see Table 4). The break energy, is located in the UV and there is a marginal hint for its evolution555Consistent with a time evolution of the synchrotron cooling frequency as expected for a blast wave expanding in a constant ISM medium in the slow cooling regime (, e.g., Sari, Piran & Narayan, 1998). However, the evolution is not significant, since fitting a constant to the three values provides (for 2 dof). in time towards longer wavelengths: Å from epoch III, IV and V. The quoted errors refer to 90% confidence. The spectral slope differences suggest that the spectral break is a synchrotron cooling break, and a fit with a tied broken power law () provides an adequate fit indeed ( for 147 dof) and the same . The free broken power law is slightly preferred with respect to the tied broken power law, but the latter cannot formally be excluded (F-test null probability of 0.62). Regardless of the extinction model used, a broken power law always gives a significantly better fit than a single power law from the NIR to X-ray regime. The F-test probability of the broken power-law over the power-law fit improvement being obtained by chance is between and with all extinction laws in the epochs III-V joint fits, confirming the significance of the improvement.
The dust extinction mag (for in the LMC, Pei, 1992) is best modelled with a LMC or SMC extinction curve, suggesting a low metallicity GRB absorber666[Fe/H] () in SMC (LMC) star clusters (Cioni, 2009), while the Milky Way metallicity distribution peaks around Solar values both in the bulge (e.g., Zoccali et al., 2003) and in the thin disk (Tiede & Terndrup, 1999), covering the majority of the stellar population.. We note that the free broken power law with MW-type extinction curve cannot be formally excluded by the fit ( for 146 dof). However, the very low dust content implied by this solution () also suggests a low metallicity for the absorbing gas (e.g., Vladilo, 1998).
(H) cannot be constrained, i.e., it is consistent with the Galactic value and with the large error of the X-ray-only (H) cm-2. This (H) falls at the low end of the (H) distribution of GRB afterglows (e.g., Evans et al., 2009; Fynbo et al., 2009; Campana et al., 2010), and also falls at the low end of the dust extinction distribution (e.g., Kann et al., 2010; Schady et al., 2011; Zafar et al., 2011). The dust to gas ratio (H) cm-2 mag-1 covers most of the GRB (H) distribution at its low end (see Zafar et al., 2011) and is similar to GRB 980329 (Starling et al., 2007). In fact, one in every six Swift XRT X-ray afterglows have unconstrained excess (H) (Evans et al., 2009), given the difficulty of measuring low host galaxy (H) against higher Galactic (H) and its uncertainties.
At earlier epochs I and II the afterglow SED is affected by flaring activity. This is most evident in the and bands where epochs I and II coincide with the rise and decay of a flare or bump in the light curves (Fig. 1). For completeness we report individual fits to these early epochs in the appendix. Our NIR-to-X-ray SED results are in overall agreement with the single epoch SED at 4.3 days previously analysed by Updike et al. (2008). In particular, we confirm the presence of a spectral break. This break was only tentatively found by Updike et al. (2008), because of its sensitivity to the NIR continuum level, based on a large extrapolation of solely two data-points in the band. In our dataset, 6 additional NIR data-points were added, i.e. from the SMARTS telescope (Kann et al., 2010) and from the PAIRITEL telescope (from GCN, Chandra et al., 2008). Moreover, no extrapolations were needed for the NIR light-curve from epoch III to epoch V of our SED fit. Finally, the significant improvement from a single power law SED fit to a broken power law strongly favours the presence of the spectral break.
5.2 The broadband picture
To determine the full set of physical parameters of a GRB afterglow, it is vital to have good temporal and spectral coverage from X-ray to radio frequencies. GRB 070125 is a good candidate for this kind of study, in particular because of its coverage at centimetre wavelengths. With well sampled light curves at multiple radio observing frequencies one can determine the evolution of the peak flux, the associated peak frequency , and the synchrotron self-absorption frequency . Together with the cooling frequency , the electron energy distribution index , and the jet-break time, all the micro- and macrophysical parameters of the GRB jet and its surroundings can be pinned down. For GRB 070125 this has been done by Chandra et al. (2008) for part of the total available data set. Updike et al. (2008) have focused their modelling efforts mainly on the optical and X-ray regimes, as we have done in Sec. 5.1. There are some inconsistencies between the different modelling results, and complications in interpreting the full data set, which we will discuss here.
The main issue is the position of the cooling break in the broadband spectrum. Our SED fits show that there is a spectral break between the optical and X-ray bands. The spectral slope differences between the two bands indicate that this break can be interpreted as the cooling break. As pointed out by Updike et al. (2008), it is difficult to form a coherent picture of these spectral slopes and the temporal slopes observed at optical and X-ray frequencies within the standard afterglow framework, because not all the so-called closure relations (e.g., Zhang & Mészáros, 2004) can be satisfied. Updike et al. (2008) suggested a solution for this issue by adopting that the NIR-to-X-ray SED is in fact a single power law, and they concluded that all those observing bands are in between and and that the circumburst medium is homogeneous. This solution is not satisfactory given that we confirm the presence of a cooling break in the NIR-to-X-ray SED, similar to what was found and tentatively discarded by Updike et al. (2008).
A complicating factor is the flaring behaviour of GRB 070125, which makes reliable determinations of temporal slopes difficult. Our SEDs have been constructed at times when the flaring has ceased, but leaving out the flaring parts of the optical and X-ray light curves gives a relatively short lever arm for determining the temporal slopes, in turn giving rise to large statistical and systematic uncertainties. This could account for the fact that the standard closure relations for in between the optical and X-ray bands do not seem to work. For example, it is mentioned in Updike et al. (2008) that the optical temporal slopes are consistent with the spectral slopes if the circumburst medium is structured like a stellar wind, but the X-ray temporal slope is inconsistent. The latter could be due to uncertainties caused by the flaring of the source. The bottom line is that in the case of GRB 070125 the NIR-to-X-ray SED fits seem to give the most reliable measurement of the value of .
The broadband SED fitting performed by Chandra et al. (2008), including the centimetre wavelength radio data, leads to different conclusions. They find that the optical and X-ray regimes lie on the same power-law segment of the synchrotron spectrum, but above both and . In fact, one of the outcomes of their modelling is that this afterglow is in the fast cooling regime, i.e. , for about a week, which has not been observed in any GRB afterglow before. The values for they find result in optical and X-ray spectral indices of . These indices are consistent with the X-ray spectral index we find in our SED fitting, but inconsistent with the shallower optical indices we find, and also the indices obtained by Updike et al. (2008) for NIR-optical SED fits. The uncharacteristically low value for is necessary to describe the optical and X-ray light curves together with the bright and long-lasting radio afterglow. If would be at higher frequencies, there is no possible combination of , and the peak flux to give a satisfactory fit of the radio data. Although the modeling performed by Chandra et al. (2008) is thorough, the basic assumptions are fairly simplified. To get to a coherent solution for all the broadband data, a more complicated picture may have to be invoked, like a double jet as has been suggested for the broadband afterglow of e.g. GRB 030329 (Berger et al., 2003). Another possibility is that we need a more detailed description of the afterglow physics, in particular the effects of synchrotron self-absorption on the jet-break time at radio wavelengths and the associated changes this makes to radio light curves (van Eerten et al., 2011). These different, more complicated scenarios for satisfactorily describing the full data set of GRB 070125 are beyond the scope of this work, but will be explored and presented in a future paper.
While the broadband modelling needs further study, we can still rely on the NIR-to-X-ray SED, as it is based on fewer assumptions. In particular, we found a low (H) and a low SMC/LMC-type dust content, suggesting a low metallicity environment.
5.3 The absorber environment
While the broadband SED depends on the afterglow physics and the circumburst environment, the absorption in the optical spectrum probes the gas along the line of sight. By studying the nature of the absorber we can derive information on the GRB site, as we will discuss here.
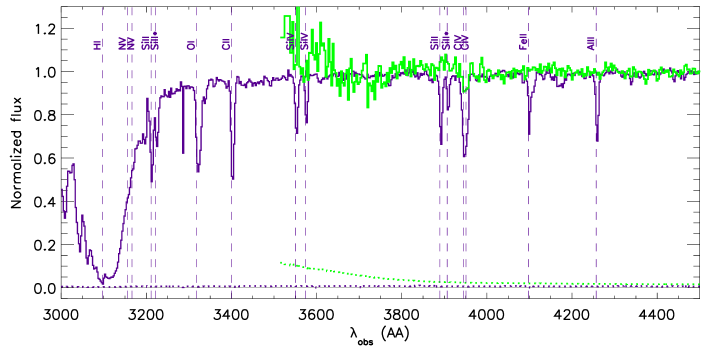
A crucial issue that needs to be addressed is whether or not the Mg ii absorbing system observed in the afterglow spectrum is associated with the host galaxy of GRB 070125. While a host galaxy could, in principle, be in the background at a larger redshift, we note that Ly absorption at 777Corresponding to the bluest observable wavelength Å in the spectrum cut where S/N would be observable in our high S/N FORS spectra, but no signature of such system was detected. Figure 5 shows how the observed GRB 070125 FORS spectrum compares to the GRB composite spectrum from Christensen et al. (2011) at the same redshift . A host galaxy could be possible but no lines are detected at such redshift. Thus, we consider to be the host galaxy redshift. A tentative Ly absorption at this redshift was reported by Updike et al. (2008), for which (H i) was argued. We note that high-ionization N v 1238, 1242 Å lines are not in our wavelength reach. No spectroscopic observation has been attempted to investigate the two candidate blue hosts that Cenko et al. (2008) indicated at a large offset from the GRB position so far. Below we will discuss the possible scenarios.
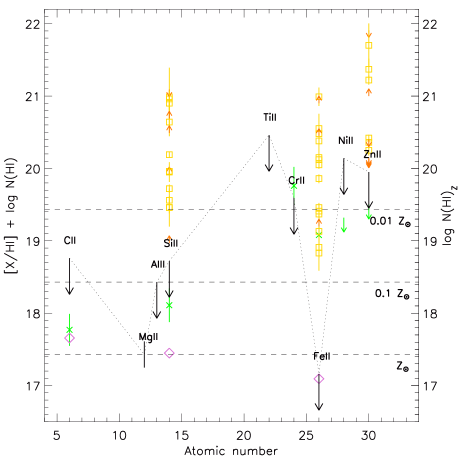
The metallicity along the GRB 070125 line of sight cannot simply be constrained from the measured column densities or upper limits, since no Ly is available in our FORS spectra, given the redshift of this afterglow. One way to bypass the lack of (H i) measurement is plotting [X/H i] log (H i) log (X) log (X) log (H i)⊙, as in Fig. 6. Despite the degeneracy between H i column density and metallicity, we can use the Mg ii detection and the upper limits to explore the parameter space and at least limit the possible (H i) and [X/H i]. In particular, assuming Solar metallicity and no Mg depletion into dust, we derive log (H i) . If the metallicity is 1/100 Solar then log (H i) . A much lower metallicity is very hard to justify, while a super-Solar metallicity with lower (H i) is possible. Hence, we can reduce the possibilities for the GRB 070125 absorber to be either i) a sub-Lyman-Limit System (sub-LLS, log (H i) , Rauch, 1998) with , or ii) an LLS ( log (H i) , Péroux et al., 2003) with , or iii) a sub-DLA ( log (H i) ) with . Below we discuss these three different scenarios.
i) A super-Solar sub-LLS. This scenario is supported by the low Mg ii of GRB 070125, since the majority of weak Mg ii ( Å) absorbers in quasar line of sights are associated with sub-LLS with super-Solar metallicity (Churchill et al., 1999). This association is based on the number density consistency between the two populations and a CLOUDY photo-ionization model that predicts log N(H i) for weak Mg ii. Given the observed Mg ii column density in GRB 070125, the C ii, Si ii and Fe ii expectation for weak Mg ii systems derived by Narayanan et al. (2008) (diamonds in Fig. 6), are consistent with our upper limits. These systems could trace either interstellar gas expelled from star forming regions into the halo, or small clouds in dwarf galaxies or intergalactic star-forming structures (Churchill et al., 1999). The least likely possibility is the GRB explosion site in the halo. Cenko et al. (2008) already pointed out the difficulty of explaining how to “kick” the massive GRB progenitor star all the way out to the galaxy halo ( kpc). A halo in-situ formation of the GRB would require halo gas at kpc and kpc from two interacting galaxies to trigger massive star formation, the GRB progenitor producing high density stellar winds to “fuel” the extremely bright afterglow ( cm-3, Chandra et al., 2008). One other possibility is that the GRB exploded in a dwarf galaxy. Ellison et al. (2004) studied the Mg ii systems coherence length, indicating that the weak Mg ii absorbers have sizes of 1.5–4.4 kpc and they could represent a distinct population of smaller galaxies. However, the low content of SMC/LMC-type dust derived from the GRB 070125 afterglow SED suggests a low metallicity of the host galaxy, disfavouring the super-Solar sub-LLS scenario.
ii) A LLS. Although GRB absorbers show, on average, high H i column densities (e.g., Jakobsson et al., 2006), an LLS is not an exotic environment for a GRB, since a low N(H i) may be a line of sight effect. In principle, the burst radiation can travel along the line of sight, within the host galaxy or from the galaxy outskirts, without being absorbed by dense gas clouds. This scenario is supported by the observation of a few other GRB LLSs, namely GRB 050908 (log (H i) : Fugazza et al., 2005; Fynbo et al., 2009), GRB 060124 (log (H i) : Prochaska et al., 2006; Fynbo et al., 2009), GRB 060607A (log (H i) : Ledoux et al., 2006b; Prochaska et al., 2008), GRB 080310 (log (H i) : De Cia et al., in preparation) and GRB 090426 (log (H i) : Thöne et al., 2011), where Ly variability was induced by H i ionization. The low H i content of all these systems cannot be explained by ionization alone, as the burst radiation can totally ionize H i only out to 200–300 pc888For much brighter afterglows, these distances can significantly grow, see our discussion below. from the burst in LLSs (using the bright GRB 050730 afterglow light curve, Ledoux et al., 2009). A low H i could arise if the GRB is not too deeply embedded in its host galaxy. Such a possibility, which is certainly expected in some cases, will be further investigated later on in this Section.
The equivalent hydrogen column density measured from the soft X-ray absorption can also provide important information on the gas along the line of sight, with the advantage of not depending on the H i ionization. Indeed, (H i) and (H) do not correlate (Watson et al., 2007; Campana et al., 2010). The difference between a low neutral and a high total hydrogen column densities can be explained if most of the X-ray absorbing gas lies closer to the burst, where the gas is highly ionized (Schady et al., 2011). In this scenario, the GRB 070125 could still have been surrounded by the high density gas required to power such a bright afterglow.
iii) A sub-DLA. This metallicity range is low, but not unusual for GRB absorbers. For instance, most of the GRB absorbers in the VLT/UVES sample have , despite the small number statistics (Ledoux et al., 2009), although their H i column densities are generally higher.
From the above analysis, scenarios ii) and partly iii) are favoured, i.e., the GRB 070125 environment is consistent with other GRBs. Below we test this further, by comparing the GRB 070125 properties with the GRB population.
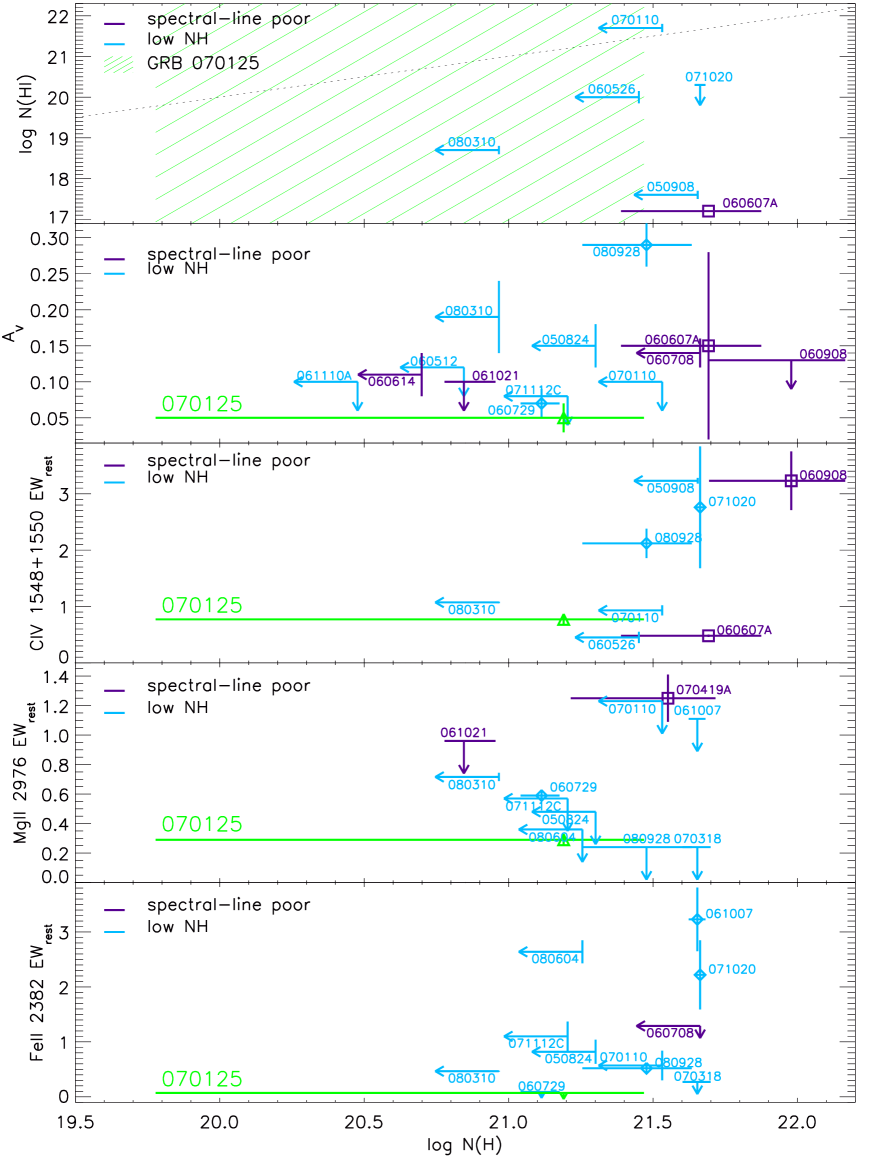
In Fig. 6 we compare the measured metal column densities and upper limits for GRB 070125 with those observed in other GRB afterglows (squares and arrows), as collected by Schady et al. (2011). The metal column densities in GRB 070125 are generally lower than measured in other GRBs. This suggests that the GRB 070125 absorber has either a lower metallicity or a lower H i column density with respect to most GRBs. However, this comparison sample is limited, since the column densities often cannot be constrained, due to the low resolution of the spectra, and more complete distributions should be used. The of C iv 1549 in GRB 070125 is Å, much lower than in the GRB composite spectrum ( Å Christensen et al., 2011) and in the low H i afterglow sub-sample ( Å, Thöne et al., 2011). Nevertheless, the observed C iv 1549 and the Si ii 1526 upper limit are consistent with the correlation found in Fynbo et al. (2009). This suggests that the GRB 070125 absorber fits in the GRB population, rather than being an outlier. In Fig. 7 we compare the C iv 1548, 1550, Mg ii 2796 s and the deep Fe ii 2382 detection limit for GRB 070125 with the distributions discussed by de Ugarte Postigo et al. (in preparation) for the whole low resolution spectroscopy afterglow sample of Fynbo et al. (2009). The GRB 070125 absorber falls in the low end of the distribution. Again, this indicates that GRB 070125 is not a GRB population outlier and that other bursts share similar properties.

| GRB | ()b | Underlying host | Notes | References | |
|---|---|---|---|---|---|
| mag | absolute (apparent) magnitude | ||||
| 060607A | 3.07 | (14.0) | (H i) | [1], [2], [3] | |
| 060614 | 0.13 | (19.8) | Host | [1], [4], [5] | |
| 060708 | 1.92 | (22.9) | ? c | Photometric redshift (low S/N) | |
| 060908 | 1.88 | () | [1], [6] | ||
| 061021 | 0.35 | (20.5) | Detected | Redshift from host and afterglow | [7] |
| 070419A | 0.97 | ? | |||
| 070125 | 1.55 | [8] | |||
| 071003 | 1.60 | Halo environment claimed | [9] | ||
| 101219B | 0.55 | (19.8) | () | Associated SN | [10] |
Furthermore, we selected two afterglow sub-samples that may potentially be similar to GRB 070125: a) the spectral-line poor, i.e., afterglows with no more than two species in absorption at the GRB redshift, selected from Fynbo et al. (2009) and b) afterglows with low equivalent hydrogen column density (H) measured from the X-rays, (H) cm-2, within . (H) and were collected from Zafar et al. (2011) when possible, otherwise the (H) from Evans et al. (2009) and the from Kann et al. (2010) were used. The were taken from Fynbo et al. (2009) and the s from de Ugarte Postigo et al. (in prep.), with the exception of GRB 060708 and GRB 080310, whose metal s are measured here. We exclude the low S/N spectra from the spectral-line poor sample by applying a cut in the Mg ii 2796 detection limit of . The low S/N spectra are also excluded from the constraints of the low (H) sub-sample. Six afterglows fall in our spectral-line poor sub-sample, not including GRB 070125, listed in Table 5, while fifteen are in the low (H) sub-sample.
We note that the spectral-line poor sub-sample may suffer from selection effects. First, afterglows with low redshift () may more easily be included in this sub-sample because of the shortage of observable transitions (other than the Mg ii 2796, 2803 doublet) in the spectral region covered by typical optical spectrographs. However, only two GRBs have such low in Table 5. Second, the S/N requirement may bias the sub-sample towards brighter bursts. This is irrelevant when comparing the sub-sample properties with GRB 070125, the latter being very bright itself, but should be kept in mind when considering the spectral-line poor sub-sample as a population. A more extended and complete sample with deeper S/N limits is needed to further analyse and possibly exclude these selection effects.
Fig. 8 shows a comparison of the GRB 070125 afterglow absorber properties with the two sub-samples. GRB 070125 traces the low end of the (H), and distributions, confirming the previous finding for the whole sample.
In general, we notice that most of the spectral-line poor afterglows also show a low (H). The few low (H) afterglows with Ly measurements seem to prefer low H i environment, although no conclusion can be drawn yet due to the extremely poor statistics. The same applies to the lack of high at constrained low (H). The above suggestions, if confirmed, may indicate a overall low column density environment for both the low-ionization gas (that absorbs the metal lines in the optical spectrum at distances larger than a few hundred pc from the burst) and the highly ionized gas (that absorbs the soft X-rays, in the vicinity of the burst). More observations are needed to investigate whether (H) and (H i) could correlate under special conditions, e.g. due to the effect of a short line of sight within the host galaxy, despite there generally being no such correlation. However, we note that the (H) typically cannot be constrained below (H) –21, due to the uncertainty in the Galactic (H).
One GRB absorber potentially similar to GRB 070125 is the recent nearby GRB 101219B, with redshift identified from the Mg ii 2796, 2803 Å and Mg i 2853, the only features in the afterglow spectrum. A spectroscopically confirmed supernova was associated with this GRB, supporting both the low redshift and a massive star progenitor for the GRB. The afterglow spectral shape suggested a very low amount of dust (), while the non-detection of the host galaxy continuum or emission lines indicated that a small galaxy was hosting the GRB, at the faint end of the Savaglio, Glazebrook & Le Borgne (2009) distribution (Sparre et al., 2011).
Another case analogous to GRB 070125 was GRB 071003, a very bright burst ( mag about a minute after trigger), with few and very weak absorption lines in the late time spectrum and no underlying bright host. Given the similarity between the two, GRB 071003 was also claimed to have occurred in a halo environment (Perley et al., 2008). In both cases, while the high brightness of the afterglow cannot easily be associated with a halo star-forming region, it can naturally contribute to ionize the circumburst medium to larger distances. And perhaps the time delay between the burst and the epoch of the spectra ( day in both cases) could allow the ionization front of the bright afterglow to travel further through the host galaxy.
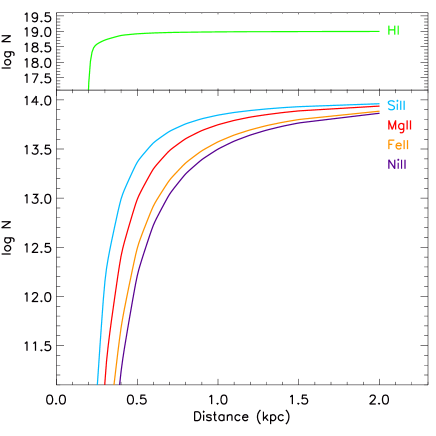
In order to investigate this possibility, we performed a simplified simulation of the GRB 070125 afterglow radiative effect on the surrounding medium with a radiative transfer model, including photo-ionization. A detailed description of the complete model will be discussed in Vreeswijk et al. (in prep). We use the GRB 050730 light curve as a template, scaled to the 3.3 times brighter flux of GRB 070125 (derived from the afterglow brightness at 1 day, if both GRBs would lie at , (GRB 050730) (GRB 070125) mag, Kann et al., 2010). We assume a spectral slope , as before the synchrotron cooling, since the most relevant photons are the in the first hours after the burst. We let the GRB afterglow radiate through a cloud lying at a distance between 0 and 2 kpc and investigate the variation of the ionic column densities. In general, most of GRB absorbers have been found to lie within this distance range from the burst, in those cases for which the GRB-to-cloud distance could be estimated from the variability of fine-structure lines in the spectra. Two different sets of initial column densities were chosen: a) (H i) cm-2 and cm-2 for the metal ions and b) (H i) cm-2 and cm-2 for the metals. We set the observation times to be at 1 day and 6 hr for comparison (observer frame). The results for case a) are displayed in Fig. 9. While the higher (H i) shields the metals from being ionized at large distances, in the case of (H i) cm-2, most of the metals are strongly ionized out to kpc. In particular, at 0.5 kpc the Mg ii column density is 10 times lower than the initial value, Fe ii is 30 times lower than the initial column, Ni ii even lower. The late time of the spectrum (1 day) does not seem to be an important factor, as the comparison with the ionization expected at 6 hr after the burst does not change the result dramatically. In particular Mg ii and Fe ii are ionized by only a factor of 2 between 6 and 24 hours, indicating that most of the ionization is happening within the first hours after the burst. At 0.2 kpc all these metals and H i are totally ionized. Thus, we conclude that any cloud within 0.5 kpc would not be visible, in terms of spectral lines of low ionization species. This evidence, together with a GRB location not too deep inside the host galaxy (i.e., within 0.5 kpc) can explain the lack of spectral features in the spectrum of GRB 070125.
The feasibility of this scenario for other bursts can be tested by comparing how many cases similar to GRB 070125 we expect and how many we actually observe. For a zero order approximation, we calculate the rough probability of a GRB to have i) a short line of sight within the host galaxy, ii) a low absorbing (H i) and iii) a bright afterglow. i) The probability of a GRB to be located not deeper than 0.5 kpc within its host galaxy depends on the galaxy size (in one simple dimension it can be simplified as . Integrating this probability over a normal distribution of GRB host galaxy sizes centred around the mean size 2.4 kpc (Wainwright, Berger & Penprase, 2007, assuming and excluding sizes below 0.5 kpc, to reproduce the observed 0.5–5 kpc size distribution) provides a 22% chance of a GRB line of sight traversing less than 0.5 kpc of its host galaxy. 999This estimate assumes a random distribution of the GRB locations inside the host galaxy. However, the low metallicity requirement for the GRB progenitor formation (e.g., Hirschi, Meynet & Maeder, 2005) would increase the probability of GRBs being located in the outskirts of their hosts, given the typical metallicity gradients. ii) Among the GRB absorbers with detected Ly absorption in the Fynbo et al. (2009) sample, 15% are LLS or lower (H i). iii) The afterglow brightness distribution, scaled to redshift and at 1 day after the burst, is presented in Kann et al. (2010), providing 16% of GRBs with mag afterglows. A different approach, considering the magnitudes of the acquisition images (, or -band magnitude) of the afterglow spectra from Fynbo et al. (2009), yields 12% afterglows with mag. Combining the three probabilities above we estimate that about 0.5% of all GRB afterglows are similar to GRB 070125, i.e. spectral-line poor and bright. This is somewhat consistent with the observations of GRB 070125, GRB 060607A and including GRB 071003, the three of them representing 4% of the afterglows analysed in Kann et al. (2010). We made an approximate estimate of the number of GRBs with a ground-based detection among the Swift sample (and hence the possibility of being identified as spectral-line poor, low (HI) and optically bright), using the Swift GRB Table101010http://swift.gsfc.nasa.gov/docs/swift/archive/grb_table/. This results in 324 GRBs up to 2011 May 1, of which 1% would mean 3 sources, again consistent with current observations. If we relax the brightness requirement, about 3% of all GRB afterglows are expected to have a low (H i) and lie in the outer kiloparsec of their host galaxy along our line of sight. The 9 spectral-line poor afterglows listed in Table 5 (including GRB 071003 and GRB 101219B) represent 12% of the afterglows of Kann et al. (2010), or 3% of the Swift optical/IR afterglows. It is possible that these spectral-line poor afterglows are the result of a GRB location in the outer regions of their host galaxy and a low (H i). Further investigations are needed to confirm these results.
Finally, we point out that the non-detection of the GRB 070125 host galaxy in the KeckI/LRIS images down to 25.4 mag (Cenko et al., 2008) is consistent with a galaxy at (k-corrected AB magnitude at 300 nm), i.e., a faint (among the 25% faintest) but still not uncommon GRB host galaxy at that redshift (Schulze et al. 2011, in preparation). Indeed, GRB hosts are generally faint irregular galaxies (Savaglio, Glazebrook & Le Borgne, 2009). Recent HST imaging of the field provides deeper upper limits on the host brightness of F336W 26.7 mag (AB) (central wavelength nm) and F110W 26.4 mag ( nm), not corrected for foreground extinction (Cenko et al., in prep.). We then correct for Galactic foreground extinction of 0.26 and 0.05 mag in the F336W and F110W bands, respectively. The former upper limit corresponds to an absolute brightness of in the 300-nm rest frame, assuming at that wavelength. The NIR observation in F110W can constrain the rest frame optical/NIR brightness of the host galaxy, mostly attributed to late type stars and the old stellar population. The upper limit corresponds to in the 780 nm, assuming . As is the case in the UV, this host is among the faintest hosts in the luminosity distributions of Savaglio, Glazebrook & Le Borgne (2009) and Laskar, Berger & Chary (2011).
6 Summary and conclusions
We collected all observational data of GRB 070125 available in the literature, in order to investigate the environmental properties of the burst, and in particular to test the putative halo origin of this burst based on the few weak absorption lines in the spectrum and the absence of an underlying bright host (Cenko et al., 2008).
The NIR-to-X-ray SED at 1.9, 2.5 and 2.9 days after the burst revealed a synchrotron cooling break in the UV. Along the line of sight in the host galaxy, little reddening () is caused by a LMC- or SMC-type dust, while a low equivalent hydrogen column density cannot be constrained better than (H) cm-2. The NIR-to-X-ray SED results are inconsistent with broadband SED analyses including radio observations, indicating that the assumptions in modelling efforts for GRB 070125 so far have probably been too simplified. More complex afterglow models should be explored, in particular to unify the light curves across the broadband spectrum with the NIR-to-X-ray SED.
The analysis of the high S/N, but rather featureless FORS spectrum showed weak Mg ii and C iv in absorption, providing (Mg ii. The constraint on the Mg ii column density, together with the upper limits for the other ions and the evidence for low metallicity from the SED, suggested that the GRB absorber is most likely a Lyman limit system, also observed along the line of sight to five other GRBs. The comparison of the GRB 070125 measurements with the rest-frame s of the GRB afterglow sample of Fynbo et al. (2009) revealed that GRB 070125 is not unique, but, simply falls at the low end of the distribution. Furthermore, we selected two sub-samples of afterglows possibly similar to GRB 070125, the spectral-line poor and the low (H). Most spectral-line poor afterglows show a low and low (H), suggesting that a short distance in the host galaxy is traversed by the line of sight. In any case, a quite featureless spectrum is not as uncommon for GRB afterglows as previously claimed.
We demonstrated that the few and weak features in the spectrum of GRB 070125 can be the result of the particularly intense afterglow radiation ionizing a low (H i) through a line of sight traversing not more than about 0.5 kpc of its faint host galaxy. We showed that few and weak spectral features are not so uncommon in GRB afterglows, including the nearby GRB 101219B at , with associated SN, for which a sub-luminous host galaxy has been claimed. Finally, the non-detection of a host galaxy at the GRB 070125 position indicates that an underlying galaxy, if present, must be among the faintest GRB host galaxies.
Given that about half of the GRBs in the spectral-line poor sub-sample have a detected host galaxy, it seems likely that these bursts are also located in the outskirts of a gas-rich, massive star-forming region inside its small and faint host galaxies, rather than in a halo environment.
Acknowledgments
We thank Bradlay Cenko for sharing results prior to publication, Stephanie Courty, Jason Prochaska and Sandra Savaglio for insightful discussions, and the and the anonymous referee for a very constructive report, which significantly improved the paper. ADC acknowledges the support of the University of Iceland Research Fund and the European Commission under a Marie Curie Host Fellowship for Early Stage Researchers Training / Centre of Excellence for Space, Planetary and Astrophysics Research Training and Networking (SPARTAN, No. MEST-CT-2004-007512) hosted by the University of Leicester. RLCS is supported by a Royal Society Fellowship. KW and RLCS acknowledge support from the STFC. The financial support of the British Council and Platform Beta Techniek through the Partnership Programme in Science (PPS WS 005) is gratefully acknowledged. AJvdH was supported by NASA grant NNH07ZDA001-GLAST. PJ acknowledges support by a Marie Curie European Re-integration Grant within the 7th European Community Framework Program and a Grant of Excellence from the Icelandic Research Fund. The Dark Cosmology Centre is funded by the Danish National Research Foundation.
References
- Appenzeller et al. (1998) Appenzeller I. et al., 1998, The Messenger, 94, 1
- Arnaud (1996) Arnaud K. A., 1996, in Astronomical Society of the Pacific Conference Series, Vol. 101, Astronomical Data Analysis Software and Systems V, G. H. Jacoby & J. Barnes, ed., p. 17
- Asplund et al. (2009) Asplund M., Grevesse N., Sauval A. J., Scott P., 2009, ARA&A, 47, 481
- Bellm et al. (2008) Bellm E. C. et al., 2008, ApJ, 688, 491
- Berger et al. (2003) Berger E. et al., 2003, Nature, 426, 154
- Björnsson, Gudmundsson & Jóhannesson (2004) Björnsson G., Gudmundsson E. H., Jóhannesson G., 2004, ApJ, 615, L77
- Burrows et al. (2005) Burrows D. N. et al., 2005, Space Sci. Rev., 120, 165
- Campana et al. (2010) Campana S., Thöne C. C., de Ugarte Postigo A., Tagliaferri G., Moretti A., Covino S., 2010, MNRAS, 402, 2429
- Cenko & Fox (2007) Cenko S. B., Fox D. B., 2007, GRB Coordinates Network, 6028
- Cenko et al. (2008) Cenko S. B. et al., 2008, ApJ, 677, 441
- Chandra et al. (2008) Chandra P. et al., 2008, ApJ, 683, 924
- Chen et al. (2009) Chen H.-W. et al., 2009, ApJ, 691, 152
- Christensen et al. (2011) Christensen L., Fynbo J. P. U., Prochaska J. X., Thöne C. C., de Ugarte Postigo A., Jakobsson P., 2011, ApJ, 727, 73
- Churchill et al. (1999) Churchill C. W., Rigby J. R., Charlton J. C., Vogt S. S., 1999, ApJS, 120, 51
- Cioni (2009) Cioni M., 2009, A&A, 506, 1137
- Covino et al. (2010) Covino S. et al., 2010, A&A, 521, A53
- Dai et al. (2008) Dai X. et al., 2008, ApJ, 682, L77
- de Ugarte Postigo et al. (2005) de Ugarte Postigo A. et al., 2005, A&A, 443, 841
- Della Valle et al. (2006) Della Valle M. et al., 2006, Nature, 444, 1050
- Dickey & Lockman (1990) Dickey J. M., Lockman F. J., 1990, ARA&A, 28, 215
- Ellison et al. (2004) Ellison S. L., Ibata R., Pettini M., Lewis G. F., Aracil B., Petitjean P., Srianand R., 2004, A&A, 414, 79
- Evans et al. (2009) Evans P. A. et al., 2009, MNRAS, 397, 1177
- Evans et al. (2007) —, 2007, A&A, 469, 379
- Fox et al. (2007) Fox D. B., Berger E., Price P. A., Cenko S. B., 2007, GRB Coordinates Network, 6071
- Fugazza et al. (2005) Fugazza D. et al., 2005, GRB Coordinates Network, 3948
- Fynbo et al. (2009) Fynbo J. P. U. et al., 2009, ApJS, 185, 526
- Fynbo et al. (2006) —, 2006, A&A, 451, L47
- Gal-Yam et al. (2006) Gal-Yam A. et al., 2006, Nature, 444, 1053
- Granot & Sari (2002) Granot J., Sari R., 2002, ApJ, 568, 820
- Hirschi, Meynet & Maeder (2005) Hirschi R., Meynet G., Maeder A., 2005, A&A, 443, 581
- Hjorth & Bloom (2011) Hjorth J., Bloom J. S., 2011, to appear in “Gamma-Ray Bursts”, eds. C. Kouveliotou, R. A. M. J. Wijers, S. E. Woosley, Cambridge University Press (ArXiv:1104.2274)
- Houck & Denicola (2000) Houck J. C., Denicola L. A., 2000, in Astronomical Society of the Pacific Conference Series, Vol. 216, Astronomical Data Analysis Software and Systems IX, Manset N., Veillet C., Crabtree D., eds., p. 591
- Hurley et al. (2007) Hurley K. et al., 2007, GRB Coordinates Network, 6024
- Jakobsson et al. (2006) Jakobsson P. et al., 2006, A&A, 460, L13
- Jarosik et al. (2011) Jarosik N. et al., 2011, ApJS, 192, 14
- Jóhannesson, Björnsson & Gudmundsson (2006) Jóhannesson G., Björnsson G., Gudmundsson E. H., 2006, ApJ, 647, 1238
- Kalberla et al. (2005) Kalberla P. M. W., Burton W. B., Hartmann D., Arnal E. M., Bajaja E., Morras R., Pöppel W. G. L., 2005, A&A, 440, 775
- Kann et al. (2010) Kann D. A. et al., 2010, ApJ, 720, 1513
- Laskar, Berger & Chary (2011) Laskar T., Berger E., Chary R.-R., 2011, ArXiv:1102.1019
- Ledoux et al. (2006a) Ledoux C., Petitjean P., Fynbo J. P. U., Møller P., Srianand R., 2006a, A&A, 457, 71
- Ledoux et al. (2006b) —, 2006b, A&A, 457, 71
- Ledoux et al. (2009) Ledoux C., Vreeswijk P. M., Smette A., Fox A. J., Petitjean P., Ellison S. L., Fynbo J. P. U., Savaglio S., 2009, A&A, 506, 661
- MacFadyen & Woosley (1999) MacFadyen A. I., Woosley S. E., 1999, ApJ, 524, 262
- Madau (1995) Madau P., 1995, ApJ, 441, 18
- Mészáros (2006) Mészáros P., 2006, Reports on Progress in Physics, 69, 2259
- Mihalas (1978) Mihalas D., 1978, Stellar atmospheres /2nd edition/, Mihalas, D., ed. San Francisco, W. H. Freeman and Co., 1978. 650 p.
- Munari & Zwitter (1997) Munari U., Zwitter T., 1997, A&A, 318, 269
- Narayanan et al. (2008) Narayanan A., Charlton J. C., Misawa T., Green R. E., Kim T., 2008, ApJ, 689, 782
- Panaitescu & Kumar (2002) Panaitescu A., Kumar P., 2002, ApJ, 571, 779
- Pei (1992) Pei Y. C., 1992, ApJ, 395, 130
- Perley et al. (2008) Perley D. A. et al., 2008, ApJ, 688, 470
- Péroux et al. (2003) Péroux C., Dessauges-Zavadsky M., D’Odorico S., Kim T.-S., McMahon R. G., 2003, MNRAS, 345, 480
- Piran (2004) Piran T., 2004, Reviews of Modern Physics, 76, 1143
- Poole et al. (2008) Poole T. S. et al., 2008, MNRAS, 383, 627
- Prochaska et al. (2007) Prochaska J. X., Chen H., Dessauges-Zavadsky M., Bloom J. S., 2007, ApJ, 666, 267
- Prochaska et al. (2008) Prochaska J. X., Dessauges-Zavadsky M., Ramirez-Ruiz E., Chen H.-W., 2008, ApJ, 685, 344
- Prochaska et al. (2006) Prochaska J. X., Foley R., Tran H., Bloom J. S., Chen H., 2006, GRB Coordinates Network, 4593
- Rauch (1998) Rauch M., 1998, ARA&A, 36, 267
- Rol et al. (2007) Rol E. et al., 2007, ApJ, 669, 1098
- Roming et al. (2005) Roming P. W. A. et al., 2005, Space Sci. Rev., 120, 95
- Sari, Piran & Narayan (1998) Sari R., Piran T., Narayan R., 1998, ApJ, 497, L17
- Savaglio (2006) Savaglio S., 2006, New Journal of Physics, 8, 195
- Savaglio, Glazebrook & Le Borgne (2009) Savaglio S., Glazebrook K., Le Borgne D., 2009, ApJ, 691, 182
- Schady et al. (2010) Schady P. et al., 2010, MNRAS, 401, 2773
- Schady et al. (2011) Schady P., Savaglio S., Krühler T., Greiner J., Rau A., 2011, A&A, 525, A113
- Schlegel, Finkbeiner & Davis (1998) Schlegel D. J., Finkbeiner D. P., Davis M., 1998, ApJ, 500, 525
- Sparre et al. (2011) Sparre M. et al., 2011, ApJ, 735, L24+
- Starling et al. (2008) Starling R. L. C., van der Horst A. J., Rol E., Wijers R. A. M. J., Kouveliotou C., Wiersema K., Curran P. A., Weltevrede P., 2008, ApJ, 672, 433
- Starling et al. (2007) Starling R. L. C., Wijers R. A. M. J., Wiersema K., Rol E., Curran P. A., Kouveliotou C., van der Horst A. J., Heemskerk M. H. M., 2007, ApJ, 661, 787
- Thöne et al. (2011) Thöne C. C. et al., 2011, MNRAS in press,, tmp433
- Tiede & Terndrup (1999) Tiede G. P., Terndrup D. M., 1999, AJ, 118, 895
- Updike et al. (2008) Updike A. C. et al., 2008, ApJ, 685, 361
- van der Horst et al. (2005) van der Horst A. J., Rol E., Wijers R. A. M. J., Strom R., Kaper L., Kouveliotou C., 2005, ApJ, 634, 1166
- van Dokkum (2001) van Dokkum P. G., 2001, PASP, 113, 1420
- van Eerten et al. (2011) van Eerten H. J., Meliani Z., Wijers R. A. M. J., Keppens R., 2011, MNRAS, 410, 2016
- Vladilo (1998) Vladilo G., 1998, ApJ, 493, 583
- Vreeswijk et al. (2004) Vreeswijk P. M. et al., 2004, A&A, 419, 927
- Wainwright, Berger & Penprase (2007) Wainwright C., Berger E., Penprase B. E., 2007, ApJ, 657, 367
- Watson et al. (2007) Watson D., Hjorth J., Fynbo J. P. U., Jakobsson P., Foley S., Sollerman J., Wijers R. A. M. J., 2007, ApJ, 660, L101
- Woosley (1993) Woosley S. E., 1993, ApJ, 405, 273
- Woosley & Bloom (2006) Woosley S. E., Bloom J. S., 2006, ARA&A, 44, 507
- Zafar et al. (2011) Zafar T., Watson D., Fynbo J. P. U., Malesani D., Jakobsson P., de Ugarte Postigo A., 2011, A&A submitted (ArXiv:1102.1469)
- Zhang & Mészáros (2004) Zhang B., Mészáros P., 2004, International Journal of Modern Physics A, 19, 2385
- Zoccali et al. (2003) Zoccali M. et al., 2003, A&A, 399, 931
Appendix A
| Time | Brightness | Error | Filter |
| (days) | (mag) | (mag) | |
| 0.545 | 18.30 | 0.10 | |
| 0.555 | 18.72 | 0.07 | |
| 0.611 | 18.61 | 0.12 | |
| 0.622 | 18.89 | 0.07 | |
| 0.679 | 18.46 | 0.11 | |
| 0.689 | 18.91 | 0.08 | |
| 0.736 | 18.87 | 0.16 | |
| 1.336 | 18.70 | 0.15 | |
| 1.340 | 18.69 | 0.17 | |
| 1.349 | 18.90 | 0.11 | |
| 1.360 | 18.37 | 0.13 | |
| 1.404 | 19.00 | 0.18 | |
| 1.407 | 18.54 | 0.16 | |
| 1.416 | 18.77 | 0.10 | |
| 1.427 | 18.76 | 0.16 | |
| 1.473 | 18.76 | 0.16 | |
| 1.476 | 18.73 | 0.19 | |
| 1.484 | 19.09 | 0.13 | |
| 1.492 | 19.15 | 0.32 | |
| 1.743 | 19.03 | 0.25 | |
| 1.749 | 19.29 | 0.20 | |
| 1.755 | 19.08 | 0.28 | |
| 1.810 | 19.21 | 0.30 | |
| 1.816 | 19.12 | 0.18 | |
| 1.822 | 18.83 | 0.24 | |
| 1.883 | 19.71 | 0.28 | |
| 1.889 | 19.21 | 0.31 | |
| 1.944 | 18.71 | 0.21 | |
| 1.946 | 18.80 | 0.27 | |
| 1.950 | 19.17 | 0.19 | |
| 1.956 | 19.12 | 0.30 | |
| 2.017 | 20.06 | 0.35 | |
| 2.084 | 19.42 | 0.22 | |
| 2.149 | 19.61 | 0.24 | |
| 2.155 | 19.40 | 0.35 | |
| 2.285 | 19.88 | 0.31 | |
| 2.348 | 19.16 | 0.36 | |
| 2.421 | 19.53 | 0.25 | |
| 2.622 | 20.20 | 0.36 | |
| 2.757 | 20.26 | 0.36 | |
| 3.488 | 19.56 | 0.34 | |
| 3.502 | 19.53 | 0.34 |
| Epoch | Ext. | Model | [dof] | (H)X | ||||
|---|---|---|---|---|---|---|---|---|
| type | (mag) | ( cm-2) | (keV) | |||||
| PL | 10.71 [49] | 0.052 | 7.8e-07 | 0.981 | – | – | ||
| SMC | BPL | 10.01 [47] | 0.055 | 7.8e-07 | 0.79 | 1.03 | 0.006 | |
| TIED BPL | 10.64 [48] | 0.069 | 3.5e-06 | 1.05 | 0.0035 | |||
| PL | 10.29 [49] | 0.055 | 7.8e-07 | 0.986 | – | – | ||
| I | LMC | BPL | 9.61 [47] | 0.059 | 7.8e-07 | 0.79 | 1.04 | 0.006 |
| TIED BPL | 10.10 [48] | 0.074 | 3.2e-06 | 1.05 | 0.0031 | |||
| PL | 10.16 [49] | 0.062 | 7.8e-07 | 0.989 | – | – | ||
| MW | BPL | 9.65 [47] | 0.066 | 7.8e-07 | 0.82 | 1.03 | 0.006 | |
| TIED BPL | 10.07 [48] | 0.087 | 7.8e-07 | 1.038 | 0.0024 | |||
| PL | 7.62 [48] | 0.061 | 9.3e-07 | 1.046 | – | – | ||
| SMC | BPL | 6.46 [46] | 0.063 | 9.3e-07 | 1.054 | -0.3 | 3.8 | |
| TIED BPL | 7.79 [47] | 0.061 | 9.3e-07 | 1.546 | 11.0 | |||
| PL | 40.71 [48] | 0.04 | 0.11 | 1.01 | – | – | ||
| II | LMC | BPL | 6.15 [46] | 0.071 | 9.3e-07 | 1.064 | 0.5 | 2.3 |
| TIED BPL | 7.53 [47] | 0.066 | 9.3e-07 | 1.551 | 9.7 | |||
| PL | 7.21 [48] | 0.091 | 9.3e-07 | 1.059 | – | – | ||
| MW | BPL | 5.87 [46] | 0.098 | 9.3e-07 | 1.073 | 0.49 | 2.3 | |
| TIED BPL | 7.36 [47] | 0.091 | 9.3e-07 | 1.559 | 10.4 | |||
| PL | 7.62 [46] | 0.005 | 0.09 | 1.074 | – | – | ||
| SMC | BPL | 7.86 [44] | 0.028 | 0.13 | 0.9 | 1.12 | 0.006 | |
| TIED BPL | 7.84 [45] | 0.027 | 0.26 | 1.25 | 0.015 | |||
| PL | 7.62 [46] | 0.007 | 0.09 | 1.074 | – | – | ||
| III | LMC | BPL | 7.82 [44] | 0.011 | 0.08 | -0.183 | 1.076 | 0.00084 |
| TIED BPL | 3.62 [45] | 0.03 | 4.9e-06 | 1.19 | 0.00462 | |||
| PL | 7.62 [46] | 0.007 | 0.09 | 1.074 | – | – | ||
| MW | BPL | 7.88 [44] | 0.026 | 0.13 | 0.98 | 1.11 | 0.013 | |
| TIED BPL | 7.97 [45] | 0.026 | 0.31 | 1.30 | 0.03 | |||
| PL | 8.95 [48] | 0.003 | 0.11 | 1.083 | – | – | ||
| SMC | BPL | 8.55 [46] | 0.023 | 0.20 | 0.48 | 1.19 | 0.006 | |
| TIED BPL | 2.05 [47] | 0.019 | 2.4e-06 | 1.188 | 0.005 | |||
| PL | 8.95 [48] | 0.003 | 0.11 | 1.083 | – | – | ||
| IV | LMC | BPL | 8.48 [46] | 0.025 | 0.20 | 0.65 | 1.20 | 0.006 |
| TIED BPL | 1.99 [47] | 0.020 | 2.9e-06 | 1.189 | 0.005 | |||
| PL | 8.95 [48] | 0.003 | 0.11 | 1.083 | – | – | ||
| MW | BPL | 8.49 [46] | 0.023 | 0.20 | 0.67 | 1.19 | 0.006 | |
| TIED BPL | 3.69 [47] | 0.009 | 2.2e-06 | 1.590 | 8.1 | |||
| PL | 7.87 [48] | 0.002 | 0.10 | 1.062 | – | – | ||
| SMC | BPL | 6.73 [46] | 0.023 | 0.20 | 0.67 | 1.19 | 0.006 | |
| TIED BPL | 6.69 [47] | 0.007 | 0.16 | 1.145 | 0.0057 | |||
| PL | 7.87 [48] | 0.001 | 0.10 | 1.062 | – | – | ||
| V | LMC | BPL | 6.73 [46] | 0.0157 | 0.20 | 0.48 | 1.19 | 0.006 |
| TIED BPL | 6.69 [47] | 0.006 | 0.16 | 1.145 | 0.0057 | |||
| PL | 7.87 [48] | 0.001 | 0.10 | 1.062 | – | – | ||
| MW | BPL | 6.73 [46] | 0.014 | 0.20 | 0.49 | 1.18 | 0.006 | |
| TIED BPL | 6.69 [47] | 0.005 | 0.16 | 1.145 | 0.0057 |