The Star Cluster Populations of Compact Galaxy Groups.
I. S. Konstantopoulos1,
K. Fedotov2,
S. C. Gallagher2,
A. Maybhate3,
P. R. Durrell4,
J. C. Charlton1
1
The Pennsylvania State University, 525 Davey Lab,
University Park, PA 16802, USA
2 The University of Western Ontario, London, ON, N6A 3K7, Canada
3 Space Telescope Science Institute, Baltimore, MD
4 Youngstown State University, Youngstown, OH 44555
Abstract
Star clusters are ideal tracers of star formation activity in systems outside the volume that can be studied using individual, resolved stars. These unresolved clusters span orders of magnitude in brightness and mass, and their formation is linked to the overall star formation in their host galaxy. In that sense, the age distribution of a cluster population is a good proxy of the overall star formation history of the host.
This talk presents a comparative study of clusters in seven compact galaxy groups. The aim is to use the cluster age distributions to infer the star formation history of these groups and link these to a proposed evolutionary sequence for compact galaxy groups.
1 Introduction
Compact galaxy groups (CGs) occupy an interesting part of the parameter space that pertains to the clumping of matter in the universe. On the one hand, they lie at the low end tail of the distribution of membership size, as they contain few galaxies – typically three or four (Hickson, 1982). On the other hand, their compactness places them on the high end of the number density distribution, similar to that in the centres of galaxy clusters (Dressler, 1980; Whitmore, 1990).
In addition, CGs display low velocity dispersions of km s1 (Tago et al., 2008; Cox, 2000), compared to galaxy cluster dispersions of km s1 (Binggeli et al., 1987; The & White, 1986; Cox, 2000). This dynamical situation lengthens interactions, when such events occur, or forces galaxies to a state of quasi-secular evolution: while they may not interact physically with their neighbours, they are always affected by them dynamically (Martig & Bournaud, 2008; Konstantopoulos et al., 2010). In terms of galaxy evolution, they present potential precursors of isolated ellipticals. Furthermore, they allow for close studies of galaxy evolution and morphological transformation, given their relatively few degrees of freedom (as compared with galaxy clusters and their hundreds of members).
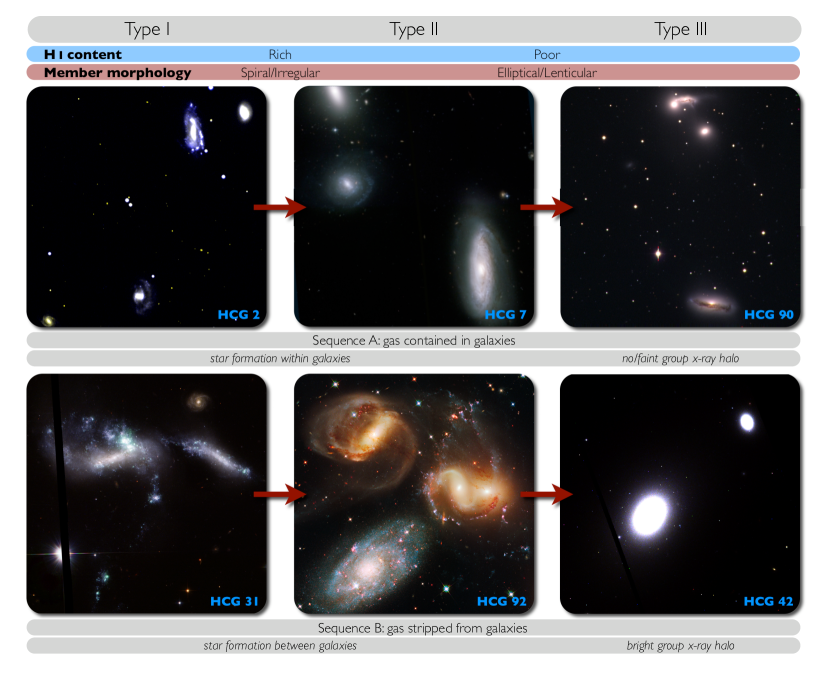
The work presented here relates qualitative age dating of thousands of star clusters in seven Hickson compact groups (HCGs) to the CG evolutionary diagram proposed by Konstantopoulos et al. (2010, Fig. 1). This draws upon results presented in an ongoing series of papers on individual groups (Gallagher et al., 2010; Konstantopoulos et al., 2010; Fedotov et al., 2011), and on the collective properties of HCGs (Johnson et al., 2007; Gallagher et al., 2008; Walker et al., 2010; Tzanavaris et al., 2010). In brief, the diagram classifies galaxy groups according to a gas richness criterion. With the basic assumption that H i represents the reservoir of gas available for further star formation (star formation potential), Johnson et al. (2007) uses the ratio of gas mass to dynamical mass (total mass) to split CGs into three types: I, II, and III, for gas-rich, intermediate and gas-poor. This is then filtered through the spatial distribution of the H i gas (Verdes-Montenegro et al., 2001, cf.), to give rise to a two-pronged diagram, shown in Figure 1. One sequence maps CGs where the gas in contained wholly within the galaxies; the other includes groups that have started to build an intra-group medium through the release of gas during interactions.
2 Methodology
We study star clusters in seven Hickson CGs (HCGs) following the methodology presented in Gallagher et al. (2010). This is refined by using more recent simple stellar population (SSP) models by Marigo et al. (2008). We compare the HST-ACS (F435W–F606W) and (F606W–F814W) colours of the clusters to these SSP models and infer their ages. Lacking photometric coverage in the -band, we cannot break the age-extinction degeneracy inherent in the baseline. We therefore compare CG cluster ages qualitatively.
We are largely aided by the fact that CGs are deficient in H i gas (Haynes & Giovanelli, 1984): since neutral gas is related to dust (e. g. Pohlen et al., 2010), this implies an overall low dust content for HCGs, thus allowing for a ‘clearer’, relatively unextinguished view of their cluster populations. In addition, we take advantage of the long bandpass of the F606W filter, which covers the H line, by synthesising a Starburst99 (Leitherer et al., 1999) SSP model that includes emission lines (i. e. from H, [Oiii], H and [Nii]). In the observations, an excess in -band light is interpreted as nebular emission arising from the ionisation of residual gas from star formation around a young cluster. Sources with such an excess are considered to be no older than 10 Myr, a timescale appropriate for the dispersal of gas from the maturing generation of supernovæ.
3 Results
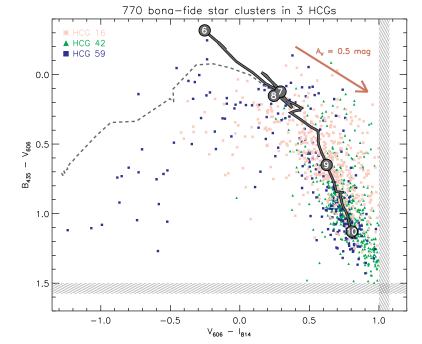
The colour plots of Figure 2 summarise our results. Groups of different evolutionary stage feature strikingly different cluster populations (left). Selecting according to the proposed evolutionary diagram of Konstantopoulos et al. (2010) reveals a pattern (right panel): the median cluster age relates well to the Johnson et al. (2007) type, therefore echoing the evolutionary sequence among those three types, as described in Konstantopoulos et al. (2010).
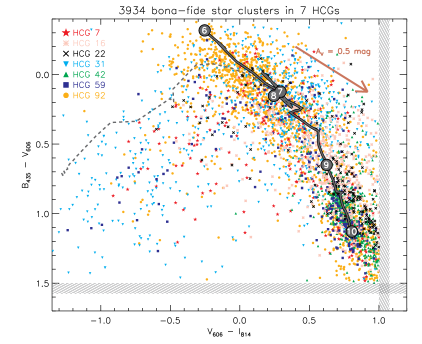
The evolutionary state of a group is closely linked with the cluster age distribution: star forming groups show a large concentration of ‘nebular’ sources (those bracketed by the dashed line) and many bright, blue clusters (ages less than a few hundred Myr); groups containing both star forming and evolved/quiescent galaxies show an even spread of nebular, young and old (red) sources; while evolved groups, those containing mostly or entirely quiescent galaxies, show few clusters outside the tight, red globular cluster clump – centred around (, ) (0.8, 1.1).
Continuing along that line, the right panel selects groups along the proposed evolutionary sequence of Konstantopoulos et al. (2010), where HCGs 16, 59, and 42 represent classes I, II, and III, as defined in Johnson et al. (2007). The correlations between the mentioned sequence and the cluster populations are discussed in detail in Section 3.
More specifically: the ‘early-type’ HCG 16 shows an even star formation history (as evidenced by the cluster formation history) from the present, all the way to 12 or so Gyr. It has a small population of globular clusters, perhaps owing to the apparent lack of major mergers in its past (it contains only disk galaxies).
Next in the sequence, the intermediate type HCG 59 shows increased star formation in the current era, as compared to HCG 16. This is likely due to recent interactions between its member galaxies, which have led to bursts of star formation across the group. This is supported by a plethora of observational evidence, to be presented in Konstantopoulos et al. (submitted).
Finally, the ‘late-type’ HCG 42 contains only bulge-dominated, evolved galaxies. Its cluster population mirrors that state, as it is heavily skewed toward old ages. We find no evidence of massive cluster formation over the past few Gyr in this system and no nebular sources – i. e. no ongoing formation.
4 Summary
We have used the optical colours, and therefore ages, of thousands of HST-selected star clusters to infer the properties of their host galaxies, members of compact groups. We have linked the distribution of cluster colours to the evolutionary state of their hosts and provide evidence in favour of the evolutionary sequence for CGs proposed by Konstantopoulos et al. (2010). While the lack of -band coverage prohibits precision age-dating, the dust deficiency of the CG environment facilitates the qualitative age-dating of clusters with only. The full study, including modelling of the cluster populations with inferences on star cluster evolution, will be presented in a future work.
Acknowledgments
This work was undertaken as part of the HCG collaboration. In addition to the authors, credit is due to the following scientists: P. Tzanavaris, A. E. Zabludoff, D. M. Elmegreen, K. E. Johnson, C. Gronwall, J. English, A. E. Hornschemeier, R. Chandar, J. S. Mulchaey, as well as others who have participated in several works mentioned in this paper.
References
- Binggeli et al. (1987) Binggeli, B., Tammann, G. A., & Sandage, A. 1987, AJ, 94, 251
- Cox (2000) Cox, A. N. 2000, Allen’s astrophysical quantities, ed. Cox, A. N.
- Dressler (1980) Dressler, A. 1980, ApJ, 236, 351
- Fedotov et al. (2011) Fedotov, K., Gallagher, S. C., Konstantopoulos, I. S., et al. 2011, ArXiv e-prints
- Gallagher et al. (2010) Gallagher, S. C., Durrell, P. R., Elmegreen, D. M., et al. 2010, AJ, 139, 545
- Gallagher et al. (2008) Gallagher, S. C., Johnson, K. E., Hornschemeier, A. E., Charlton, J. C., & Hibbard, J. E. 2008, ApJ, 673, 730
- Haynes & Giovanelli (1984) Haynes, M. P. & Giovanelli, R. 1984, AJ, 89, 758
- Hickson (1982) Hickson, P. 1982, ApJ, 255, 382
- Johnson et al. (2007) Johnson, K. E., Hibbard, J. E., Gallagher, S. C., et al. 2007, AJ, 134, 1522
- Konstantopoulos et al. (2010) Konstantopoulos, I. S., Gallagher, S. C., Fedotov, K., et al. 2010, ApJ, 723, 197
- Leitherer et al. (1999) Leitherer, C., Schaerer, D., Goldader, J. D., et al. 1999, ApJS, 123, 3
- Marigo et al. (2008) Marigo, P., Girardi, L., Bressan, A., et al. 2008, A&A, 482, 883
- Martig & Bournaud (2008) Martig, M. & Bournaud, F. 2008, MNRAS, 385, L38
- Pohlen et al. (2010) Pohlen, M., Cortese, L., Smith, M. W. L., et al. 2010, A&A, 518, L72+
- Tago et al. (2008) Tago, E., Einasto, J., Saar, E., et al. 2008, A&A, 479, 927
- The & White (1986) The, L. S. & White, S. D. M. 1986, AJ, 92, 1248
- Tzanavaris et al. (2010) Tzanavaris, P., Hornschemeier, A. E., Gallagher, S. C., et al. 2010, ApJ, 716, 556
- Verdes-Montenegro et al. (2001) Verdes-Montenegro, L., Yun, M. S., Williams, B. A., et al. 2001, A&A, 377, 812
- Walker et al. (2010) Walker, L. M., Johnson, K. E., Gallagher, S. C., et al. 2010, AJ, 140, 1254
- Whitmore (1990) Whitmore, B. C. 1990, in Clusters of Galaxies, ed. W. R. Oegerle, J. Fitchett, & L. Danly, 139–+