The Nature of Double-Peaked [O III] Active Galactic Nuclei**affiliation: Some of the data presented herein were obtained at the W.M. Keck Observatory, which is operated as a scientific partnership among the California Institute of Technology, the University of California and the National Aeronautics and Space Administration. The Observatory was made possible by the generous financial support of the W.M. Keck Foundation.
Abstract
Active galactic nuclei (AGNs) with double-peaked [O iii] lines are suspected to be sub-kpc or kpc-scale binary AGNs. However, pure gas kinematics can produce the same double-peaked line profile in spatially integrated spectra. Here we combine integral-field spectroscopy and high-resolution imaging of 42 double-peaked [O iii] AGNs from the Sloan Digital Sky Survey to investigate the constituents of the population. We find two binary AGNs where the line-splitting is driven by the orbital motion of the merging nuclei. Such objects account for only 2% of the double-peaked AGNs. Almost all (98%) of the double-peaked AGNs were selected because of gas kinematics; and half of those show spatially resolved narrow-line regions that extend 420 kpc from the nuclei. Serendipitously, we find two spectrally unresolved binary AGNs where gas kinematics produced the double-peaked [O iii] lines. The relatively frequent serendipitous discoveries indicate that only 1% of binary AGNs would appear double-peaked in Sloan spectra and % of all Sloan AGNs are binary AGNs. Therefore, the double-peaked sample does not offer much advantage over any other AGN samples in finding binary AGNs. The binary AGN fraction implies an elevated AGN duty cycle (%), suggesting galaxy interactions enhance nuclear accretion. We illustrate that integral-field spectroscopy is crucial for identifying binary AGNs: several objects previously classified as “binary AGNs” with long-slit spectra are most likely single AGNs with extended narrow-line regions. The formation of extended narrow-line regions driven by radiation pressure is also discussed.
Subject headings:
galaxies: active — galaxies: formation — galaxies: interactions — galaxies: nuclei — quasars: emission lines1. Introduction
The ubiquity of binary supermassive black holes (SMBHs) is expected because of two commonly accepted facts (Begelman et al., 1980): that galaxies frequently merge (Toomre & Toomre, 1972) and that SMBHs occupy the centers of the majority of massive galaxies (Kormendy & Richstone, 1995; Richstone et al., 1998). If mergers trigger or enhance nuclear accretion as predicted by simulations (Barnes & Hernquist, 1996), a significant fraction of mergers should appear as binary active galactic nuclei (AGNs).
Over the last three decades, binary AGNs have been found with separations ranging from parsec to tens of kiloparsec (kpc) scales. Thanks to the Sloan Digital Sky Survey (SDSS), we now have a large sample of binary quasars with separations of tens of kpcs; and they account for 0.1% of the QSO population at (Djorgovski et al., 1987; Djorgovski, 1991; Kochanek et al., 1999; Hennawi et al., 2006; Myers et al., 2007, 2008; Green et al., 2010) and 3.6% of SDSS spectroscopically selected AGNs between (Liu et al., 2011). On kpc-scales, we have six convincing examples, LBQS 0103-2753 (Junkkarinen et al., 2001; Shields et al., 2011), NGC 6240 (Komossa et al., 2003), 3C 294 (Stockton et al., 2004), Mrk 463 (Bianchi et al., 2008), Mrk 739 (Koss et al., 2011), and SDSS J150243.1111557 (Fu et al., 2011b). On parsec-scales, there is only one convincing example, the radio galaxy 0402+379, for which only the Very Long Baseline Array (VLBA) can resolve the 7-parsec-separation binary (Rodriguez et al., 2006).
Serendipitously discovered binary AGNs are of course interesting objects to study, but in order to understand the effect of galaxy interactions on nuclear activities, it is crucial to estimate the frequency of binary AGNs as a function of physical separation. Systematic searches for parsec-scale binary AGNs have focused on objects with two distinct sets of AGN emission lines, either as double-peaked broad emission lines (Gaskell, 1983, 1996; Boroson & Lauer, 2009) or as narrow lines offset from the broad lines (Komossa et al., 2008; Eracleous et al., 2011; Tsalmantza et al., 2011). However, double-peaked broad lines are not necessarily binary AGNs—they could be equally well explained as a Keplerian accretion disk (Chen et al., 1989; Eracleous et al., 1997; Eracleous & Halpern, 2003). And the narrow-line offset systems could be gravitational wave recoiled black holes (Komossa et al., 2008). Unfortunately, it is difficult to confirm or refute these binary AGN candidates, because of the extremely high spatial resolution needed to resolve the components and/or the long time span needed to monitor the systematic velocity changes due to orbital motion.
The same technique has been used to find binary AGNs with separations larger than the scale of the broad-line regions but within 10 kpcs. Several systematic searches have compiled AGNs with double-peaked [O iii] 5007 emission lines (dpAGNs hereafter) from the DEEP2 survey (Gerke et al., 2007; Comerford et al., 2009) and the SDSS (Xu & Komossa, 2009; Wang et al., 2009; Liu et al., 2010b; Smith et al., 2010; Liu et al., 2011). If double-peaked [O iii] emission is indicative of a binary AGN, such emission most likely represents objects with transverse separations of 100 parsecs to 10 kpcs (e.g., Wang et al., 2009). However, double-peaked emission lines may also arise from mechanisms other than orbital motion, such as gas kinematics in the narrow-line regions (e.g., Gelderman & Whittle, 1994; Fu & Stockton, 2009b; Fischer et al., 2011; Shen et al., 2011a), or jet-cloud interactions (e.g., Stockton et al., 2007; Rosario et al., 2010).
Unlike parsec-scale binaries, it is relatively easy to confirm or refute the kpc-scale binary AGN candidates with existing facilities. Shen et al. (2011a) have recently carried out an imaging and long-slit spectroscopic study of 31 SDSS dpAGNs (mostly at declinations of ). They identified five binary AGNs, with each resolved galaxy component associated with AGN-photoionized narrow emission lines (i.e., type-2type-2 pairs). However, their study was limited by the natural seeing and the spatial coverage of the long-slit. To move forward, we decided to carry out a high-resolution imaging and integral-field spectroscopic survey of dpAGNs.
Ground-based imaging aided by adaptive optics enables efficient high-spatial-resolution imaging surveys. In Fu et al. (2011a), we published images of 50 SDSS dpAGNs from the Keck laser guide star adaptive optics system (LGSAO; Wizinowich et al., 2006). With a spatial resolution of 0.1″, we found 30% of dpAGNs at show discernible companions. Using the same instrument, Rosario et al. (2011) found a similar result with a smaller sample. These results showed that at least 70% of the dpAGNs are either single AGNs or binary type-2 AGNs with coalesced host galaxies. It is worth noting that even a merging galaxy associated with a dpAGN could be ascribed to single AGNs—the double-peaked AGN emission lines could arise from a single active component which is merging with a non-active galaxy.
We have extended our LGSAO imaging to a sample doubling the size of that surveyed by Fu et al. (2011a). In addition, we have obtained integral-field spectroscopy of 42 dpAGNs, including most of the merging systems identified with LGSAO imaging. In this paper, we analyze the combined data set to identify kpc-scale binary AGNs and to study the statistics of dpAGN types. We describe our observations in Section 2. In Section 3, we classify the AGNs based on both stellar morphology from high-resolution imaging and ionized gas morphology and kinematics from integral-field spectroscopy. In Section 4 we compare the classifications based on previous long-slit spectroscopy and our integral-field spectroscopy. We show that several objects classified in the literature as “binary” are, most likely, single AGNs with extended narrow-line regions. We conclude by discussing the binary AGN fraction, the efficiency of the double-peaked selection technique, and the formation of extended narrow-line regions (Section 5).
Throughout we adopt a CDM cosmology with , and H0/100 km s-1 Mpc-1 = 0.7, consistent with the maximum likelihood estimates from WMAP (Dunkley et al., 2009).
2. Observations
The dpAGNs presented here were selected from the SDSS DR7 spectroscopic data set by several groups (Wang et al., 2009; Liu et al., 2010b; Smith et al., 2010). There are a total of 340 dpAGNs between , or 1% of the entire SDSS AGN sample. Their [O iii] 5007 lines show double-peaked profiles with velocity splitting ranging from 151 to 1314 km s-1. Initially, it was suspected that most of these double-peaked line profiles could originate from the orbital motions of binary AGNs blended within the 3″-diameter apertures of SDSS fibers (e.g., Wang et al., 2009). Nonetheless, to test whether these are binary AGNs, the SDSS data are insufficient because of their limited spatial resolution. To better understand this population of AGNs, we obtained high-resolution (0.1″) adaptive-optics imaging and integral-field spectroscopy for a representative sample of dpAGNs.
2.1. High Resolution Imaging
Six of the dpAGNs have ACS/WFPC2 images in the HST archive (SDSS J0807+3900, SDSS J0941+3944, SDSS J1129+5756, SDSS J1301-0058, SDSS J1526+4140111SDSS J1526+4140 is also known as NGC 5929 and SDSS J2310-0900). For the rest, we attempted high resolution near-infrared (NIR) imaging with the Keck II laser guide-star adaptive-optics system (LGSAO; Wizinowich et al., 2006). LGSAO observations require a bright () star within 60″ of the target for tip-tilt corrections. Therefore, we selected 45 type-1 (broad-line) AGNs and 107 type-2 (narrow-line) AGNs that have nearby tip-tilt stars. We further included 23 type-1 AGNs without nearby tip-tilt stars but brighter than so that the AGN itself could serve as the beacon for tip-tilt corrections. Our final LGSAO target sample contained 173 AGNs over the redshift range .
We obtained -band (1.473–1.803 m; OSIRIS/Hbb filter) images for three sources (SDSS J0400-0652, SDSS J0952+2552, and SDSS J1240+3534) with the OSIRIS imager (Larkin et al., 2006) at 0.02″ pixel-1 on 2010 March 6 and 7 (UT), and -band (or , 1.948–2.299 m) images for 97 sources on 2010 June 3 and 4 (UT) and 2011 January 5 and 6 (UT) with NIRC2 at 0.04″ pixel-1. For each target, we took at least three 1-minute exposures, dithered within boxes of 4″ to 7″ width. For the brightest targets, we used shorter exposure times and a number of co-adds to avoid saturation. The final exposure times and the CFHT/DIMM seeing data are listed in Tables 3 & 4 in the Appendix. Half of our imaging data were presented in Fu et al. (2011a) and we followed the same data reduction procedure here. The astrometry of these images are tied to that of the SDSS using the centroid position of the targets and assuming the pre-determined instrument plate scale.
In summary, we have high-resolution images (FWHM [Full Width Half Maximum] 0.1″) for a total of 106 dpAGNs — 37 type-1 and 63 type-2 AGNs were imaged by the Keck II LGSAO in the NIR, and 6 type-2 AGNs were imaged by the HST in the optical. Inspecting the images, we found that 31 (%)222We estimate the 1 binomial confidence intervals of any fractions from the quantiles of the beta distribution (Cameron, 2011). sources have companions within 3″ (Fig. 8), consistent with the merger fractions found by Fu et al. (2011a) and Rosario et al. (2011).
2.2. Integral-Field Spectroscopy
Integral-field spectroscopy allows us to spatially resolve emission lines—thus comparing emission-line morphologies with continuum morphologies—and to derive the kinematics of the emission lines. Based on this information, we can study the constituents of dpAGNs, as it is known that several mechanisms can produce the same double-peaked line profiles (e.g., Rosario et al., 2010; Fu et al., 2011a; Shen et al., 2011a). The sample that we compiled for integral-field spectroscopy is biased in favor of sources with existing high-resolution imaging data and sources that displayed close companions within 3″. We obtained seeing-limited optical integral-field spectroscopy for 39 sources and LGSAO-aided integral-field spectroscopy for 3 additional sources. The combined spectroscopic sample includes 26 apparent mergers that show close companions within 3″, 11 isolated sources, and 5 sources with only seeing-limited images (Table 1). We assume that the 5 sources without high-resolution images are single galaxies.
2.2.1 Adaptive Optics-Aided Integral-Field Spectroscopy
We obtained NIR integral-field spectra with the OH-Suppressing Infrared Imaging Spectrograph (OSIRIS Larkin et al., 2006) on the Keck II telescope for 3 double-peaked AGNs (SDSS J0808+4813, SDSS J1050+0839, and SDSS J1240+3534). OSIRIS was operated with the LGSAO system to deliver high spatial-resolution datacubes.
The OSIRIS observations took place on 2010 March 7 (UT) under excellent conditions. We used the 0.05″ lenslet scale and either the Kn2 (2.0362.141 m) or the Kn3 (2.1212.229 m) filter to cover the redshifted Pa m line with a 2.25″3.2″ (Kn2) or 2.4″3.2″ (Kn3) field of view and a spectral resolution . Three or four on-source exposures of 600 seconds were taken with a 600-second sky frame in between. An A1V star, HIP 49198, was observed for telluric absorption correction and flux calibration.
We reduced the data using the OSIRIS data reduction pipeline (version 2.3; Krabbe et al., 2004). In summary, the pipeline subtracts darks and biases from the raw images, removes crosstalk signals, identifies glitches, cleans cosmic-rays, extracts and wavelength-calibrates spectra from individual lenslets, assembles the datacubes, corrects for differential atmospheric refraction, subtracts sky using an implementation of the scaled sky subtraction algorithm (Davies, 2007), removes telluric absorption, and co-adds the individual exposures to form the final datacube. The spatial resolution of the final datacubes is 0.12″.
2.2.2 Seeing-Limited Integral-Field Spectroscopy
We obtained seeing-limited integral-field spectra using the Supernova Integral-Field Spectrograph (SNIFS; Aldering et al., 2002; Lantz et al., 2004) on the University of Hawaii 2.2-meter telescope (Mauna Kea) in a fully remote observing mode. SNIFS is a pure-lenslet integral-field spectrograph similar to TIGER (Bacon et al., 1995). It has a fully filled 6.45″6.45″ field of view sampled by a 1515 grid of 0.43″0.43″ spatial elements. The dual-channel spectrograph covers wavelengths from 3200 to 10000 Å simultaneously with a spectral resolution of FWHM = 6.1 and 8.2 Å for the blue (32006000 Å; ) and red (500010000 Å; ) spectrographs, respectively. The instrument position angles (PAs) are fixed on the sky — for the blue and for the red. We measured the spectral resolution from arc lamp exposures taken with each science exposure and they agree well with the measurements from the night sky lines in the final reduced datacubes.
Our SNIFS observations took place on the first half-nights of 2010 August 4, 6, 8, 9 and on the two full nights of 2011 March 26, 29 (UT). In addition, a 15-minute exposure of SDSS J1155+1507 was taken on 2010 November 21 (UT). The 2010 run was photometric with seeing between 0.6″ and 1.2″, and the 2011 run was cloudy with seeing between 0.8″ and 2″. Depending on the [O iii] 5007 line fluxes and the observing conditions, the total integration time ranged from 10 to 60 minutes for each object. Table 1 presents the observing log.
The raw data were first passed through the SNIFS data reduction pipeline (Aldering et al., 2006). After subtraction of biases and a diffuse-light component, the pipeline extracted the spectra from the CCD and reassembled them into ()-datacubes, which were subsequently wavelength calibrated, flat-fielded, and cosmic-ray cleaned. Then, we used our custom IDL scripts to subtract the sky using regions free of object light, to rectify the field to PA = 0, to correct for differential atmospheric refraction as computed by the SLA_REFRO routine in the SLALIB library333http://star-www.rl.ac.uk/star/docs/sun67.htx/sun67.html (version 2.5-4), and to join the blue and red channel datacubes. For flux calibration, we used the SDSS spectra. We used standard star observations exposed on the same nights as the data frames to remove telluric absorption features. Finally, Galactic extinction was removed using the dust map of Schlegel et al. (1998) and the standard reddening curve of Cardelli et al. (1989) with = 3.1. Considering only spectra with [O iii] 5007 peak-to-noise ratio greater than 2.0 as valid, we reached a surface brightness depth of erg s-1 cm-2 arcsec-2 (Table 1 Column 6). The depth varies with exposure time, observed wavelength, and atmosphere conditions. But for all of the sources, our datacubes are sensitive enough to detect both [O iii] components seen in the SDSS spectra with at least five spatial elements, assuming the surface brightness profile of the components follows a Gaussian distribution with FWHM less than 2″. We also confirm that SNIFS detects both [O iii] components by comparing the [O iii] line profiles extracted from the datacubes with those from SDSS smoothed to SNIFS resolution.
We spatially register the datacubes with the high-resolution images by measuring the centroid position of the target from emission-line-free continuum images stacked from the datacubes. When there are multiple components, we use the centroid of the brightest component. For unresolved sources, the centroid accuracy is approximately equal to FWHM/SNR (signal-noise-ratio). The stacked continuum images from the SNIFS datacube have rather high SNR, so the centroids can be pinned down better than 0.05” given the typical resolution of FWHM = 1.0”, despite that the pixel size is 0.4”. The centroids from the Keck and HST images can be measured more accurately than the SNIFS images.
The instrument PA and plate scale previously determined by the SNIFS instrument team are verified by comparing the observed differential atmospheric refraction from standard stars with that predicted by SLA_REFRO using the observed atmosphere conditions.
3. Classification

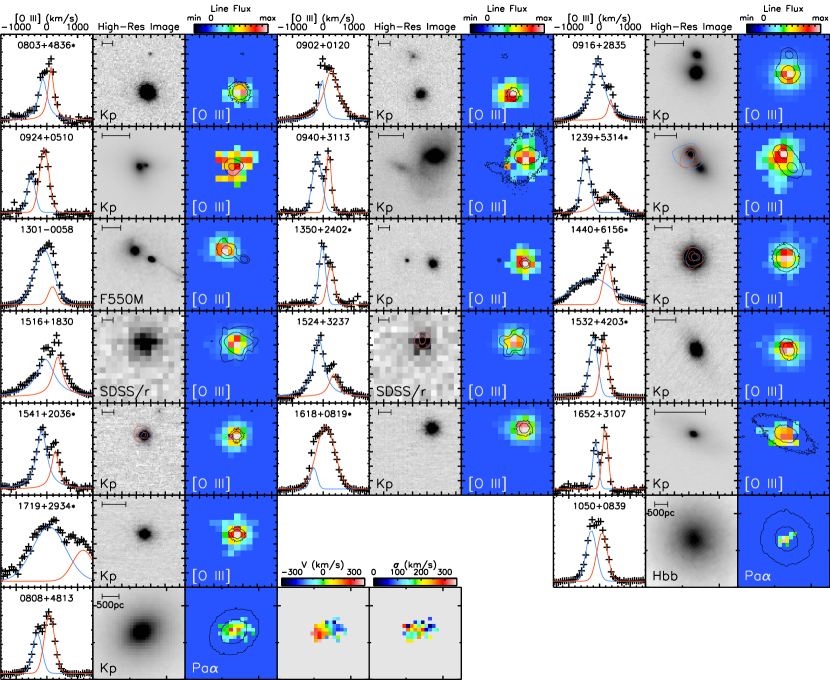
Broadly speaking, the double-peaked [O iii] line profiles could arise from: (1) the orbital motion of a binary AGN, (2) gas kinematics in extended narrow-line regions (ENLRs), and (3) unresolved nuclear gas kinematics (e.g., aligned outflows or disk rotation on small scales). We classified the 42 IFS-observed dpAGNs into these three broad categories by examining the continuum and emission-line morphologies and the kinematics of the ionized gas. We emphasize that we obtained ″ resolution images (§ 2.1) for 37 of the 42 IFS-observed sources.
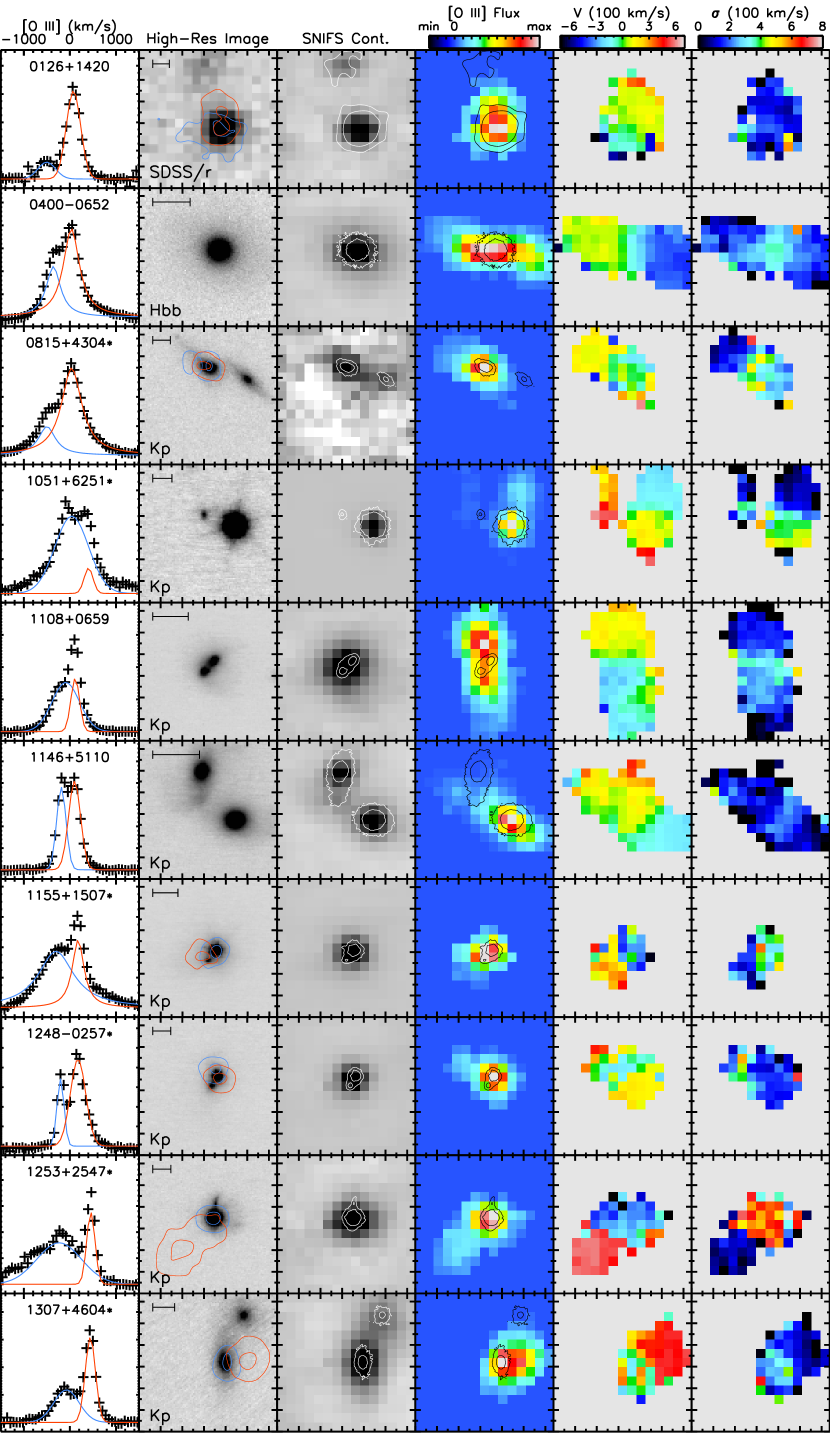
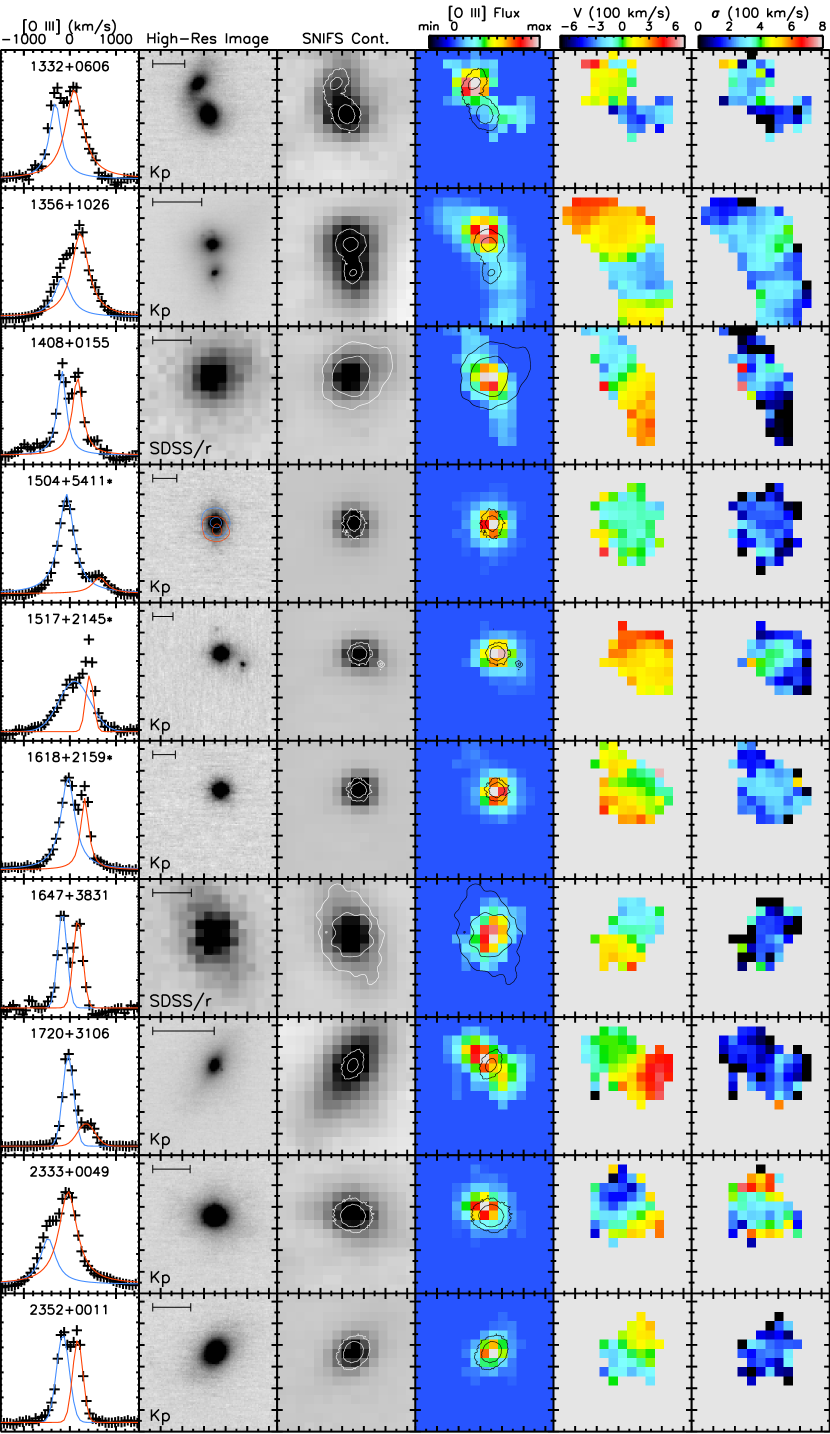
We derived maps of emission-line fluxes and kinematics by fitting Gaussians at each spatial element of the datacube. These maps are shown in Figures 1, 4, & 5 along with the best-available broad-band images. If SNIFS spectrally resolves the double-peaked emission lines, we fit two Gaussians with relative velocities fixed to that determined from the Sloan spectra. In the kinematic maps, we show only the brighter component at each position; but in the line flux maps, we use the total flux. For the OSIRIS data, we fit only single Gaussians because OSIRIS spatially resolved the kinematic components.
Table 2 summarizes the basic properties of the sample, grouped by our best-effort classification. The reality is, however, much more complicated than this single-parameter classification because of the following facts:
(1) Each object may contain more than two emission-line components. For example, in SDSS J1440+6156 the two major kinematic components originate from an unresolved nuclear region, but we clearly detected [O iii] emission extending 2″ to the north of the nucleus. Our first-order classification is based on the main mechanism that produced the double-peaked [O iii] line in the Sloan spectra, but we note the second-order mechanisms in Column 11 of Table 2.
(2) SNIFS data have lower spatial resolution than that of the AO/HST images. The seeing-limited SNIFS data cannot spatially resolve structures on scales smaller than 1.2″. But seven of our SNIFS-observed sources show multiple components within 1.2″. Except for SDSS J0952+2552, which is a clear binary AGN (Fig. 1), they are all difficult to classify. For example, in SDSS J1108+0659 the merging galaxies seen in the high-resolution images are completely enshrouded by the ENLR. Although it is clear that the ENLR produces the double-peaked line profile, it remains ambiguous whether both of the merging galaxies host AGNs or a single AGN is powering the ENLR. Decomposing the velocity components helps the classification, because the flux centroids of each decomposed component can be localized much more accurately than the seeing disk (to FWHM/SNR). But it is impossible to rule out the existence of emission-line regions that spatially coincide with the nuclei. Classifications are thus ambiguous for these six compact mergers. On the other hand, spectral decomposition can only be done for sources where SNIFS resolves the line profiles, which leads us to our third caveat…
(3) … SNIFS data have lower spectral resolution than that of the SDSS spectra, so it can only spectrally resolve the double-peaked emission-lines when the velocity splitting is sufficiently large and/or the components are sufficiently narrow.
Bearing these caveats in mind, in the following subsections we describe the three classes of dpAGNs in detail.
3.1. Binary AGNs
We found four binary AGNs; these are merging galaxy pairs where the stellar nuclei spatially coincide with distinctive [O iii] emission-line components (Figure 1). However, there are only two systems, SDSS J0952+2552 and SDSS 1502+1115, whose double-peaked [O iii] lines are produced by the relative velocities of the merging galaxies. SDSS J0952+2552 was also identified as a binary AGN by OSIRIS (McGurk et al., 2011). The other two are serendipitous binaries, where “serendipity” means that the binaries cannot be resolved in velocity space with a spatially integrated spectrum. SDSS 1240+3534 is double-peaked because of a high-velocity nebula that is spatially offset from the nuclei. The projected separation of the nuclei is only 500 pc. In SDSS 1151+4711, the spectrally resolved emission-line components are spatially unresolved. Hence, we grouped the last two systems under “Extended Narrow-Line Region (ENLR)” and “Unresolved” in Table 2. We note that the emission lines from the NW companion of SDSS 1151+4711 are not scattered light from the primary because they are much narrower.
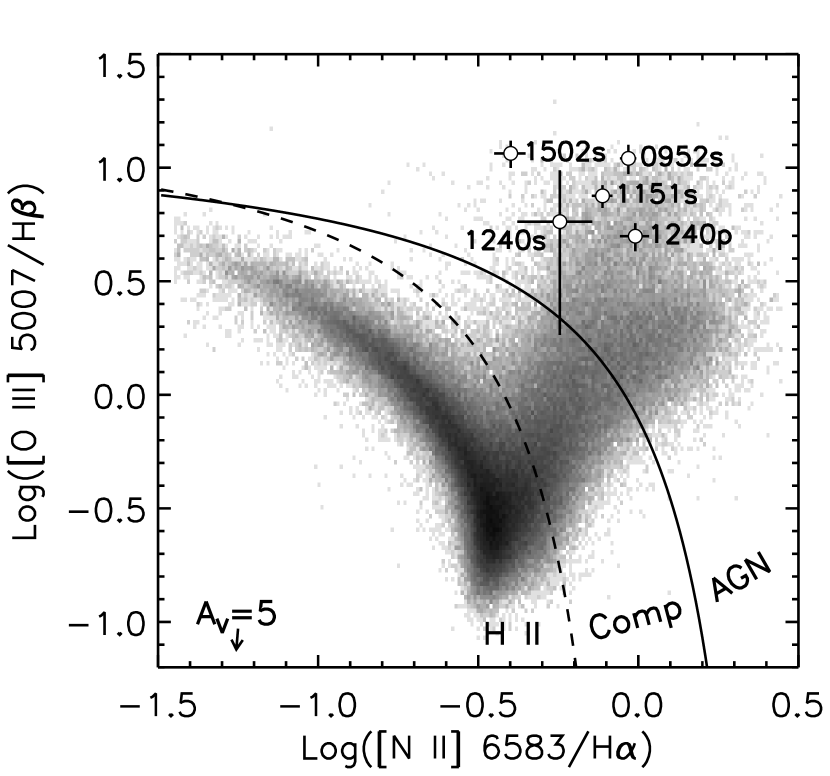
The primaries444We define the primaries as the brighter nucleus in the broad-band images. of three of the four systems are broad-line AGNs (SDSS J0952+2552, SDSS J1151+4711, and SDSS J1502+1115). To test whether their companions are also AGNs, we extracted spectra at the companion locations with 0.85″ apertures from the SNIFS datacubes. In all three cases, only narrow lines are seen, and their [O iii]/H and [N ii]/H ratios place them securely in the Seyfert regime on the classic “BPT” (Baldwin et al., 1981) line-ratio diagnostic diagram (Fig. 2). Therefore, these are type-1type-2 binaries.
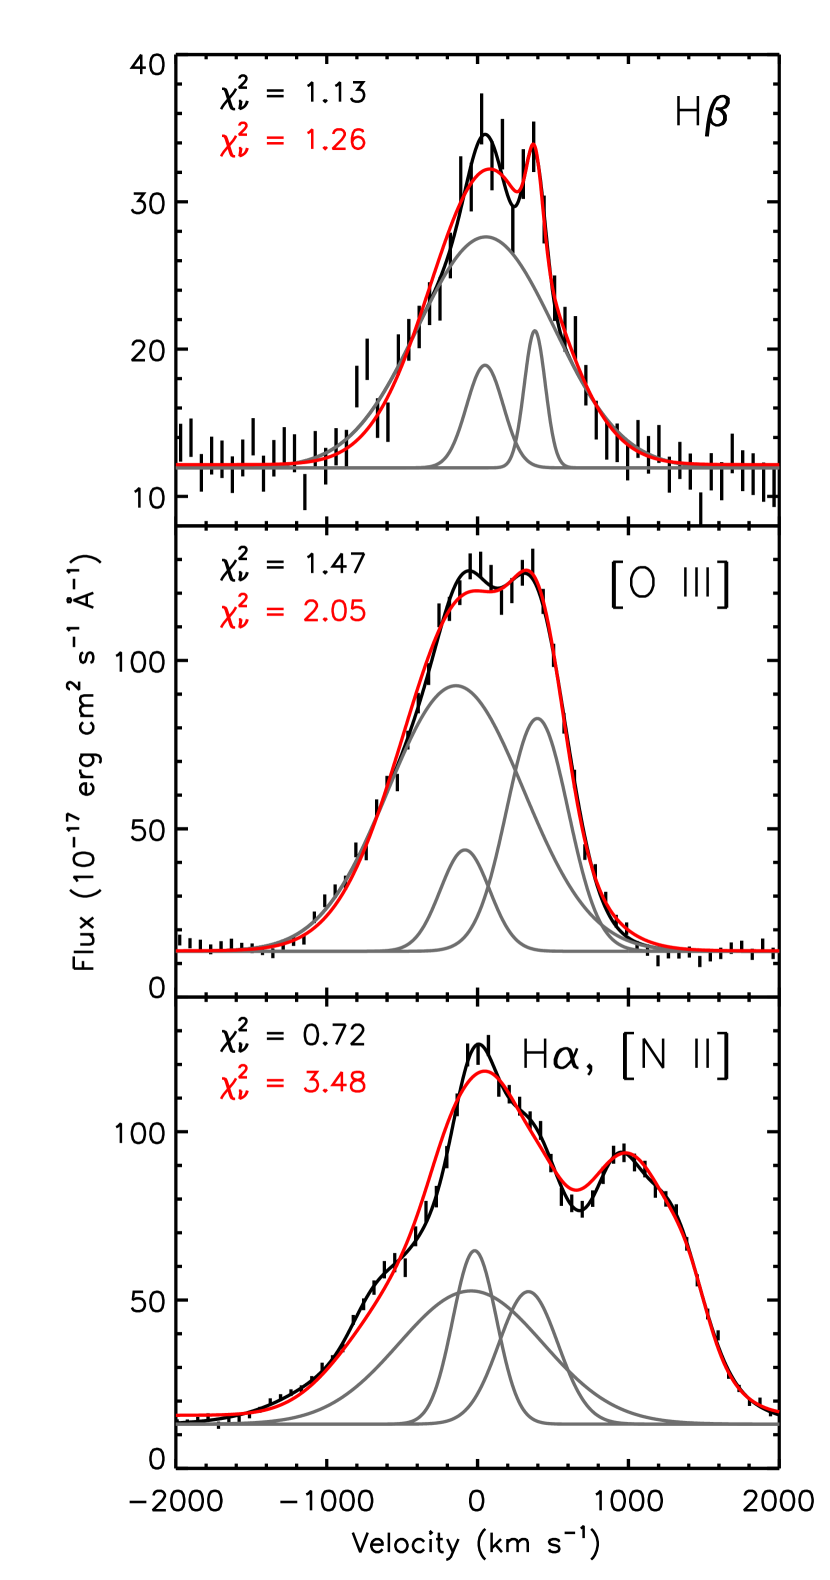
For the narrow-line AGN SDSS J1240+3534, the Pa line is spatially resolved into three major components by OSIRIS (two associated with the nuclei, one offset to the NNE). The velocity map implies that the emission-line components at the two stellar nuclei have very similar line-of-sight velocities. To place them on the BPT diagram, we decompose each of the emission lines by fitting three Gaussians simultaneously with MPFIT (Markwardt, 2009). We set their initial velocities at those determined from the OSIRIS datacube but allow them to vary during the fit. Figure 3 shows the result. The three-Gaussian models provide better fits to the SDSS line profiles than two-Gaussian models, with the values reduced by 10%, 30% and 80% for H, [O iii] 5007 and the [N ii]H complex, respectively. The 1 errors of the parameters were computed from the covariance matrix by MPFIT. The decomposed line ratios of the two nuclear components are consistent with AGN photoionization (Fig. 2), indicating that SDSS J1240+3534 is a type-2type-2 binary.
It should be emphasized that the proof that the gas is photoionized by an AGN does not imply that there is an AGN at the location of the nebula. Because of the proximity between the nuclei in all of these systems, it remains ambiguous whether there is one or two ionizing sources (i.e., AGNs) in each system without high-resolution X-ray or radio images. Recently, the binary nature of SDSS J1502+1115 was confirmed by high-resolution radio continuum images from the Expanded Very Large Array (EVLA) (Fu et al., 2011b).
3.2. Extended Narrow-Line Regions
Our IFS data spatially resolved the emission-line nebulae in half (21/42) of the dpAGNs. We refer to such less luminous nebulosity on kpc scales as ENLRs and reserve the term Extended Emission-Line Region (EELR) for luminous nebulae on tens of kpc scales (Stockton & MacKenty, 1987; Fu & Stockton, 2009a). Nonetheless, four of our ENLR objects (SDSS J0126+1420, 0815+4304, 1051+6251, and 1253+2547) have extended [O iii] luminosity greater than erg s-1 at radii greater than 10 kpc, satisfying the definition of EELRs. We consider an emission-line region extended if the offset between the [O iii] centroid and the closest stellar nucleus is greater than 0.4″. It is interesting that ENLRs are equally represented in merging (13/26) and isolated (8/16) dpAGNs.
SDSS J1240+3534 was observed by OSIRIS, so the datacube has much better spatial resolution. Although SDSS J1240+3534 is a binary AGN (§ 3.1), we include it here—in the ENLR category—because the ENLR produced the redshifted emission line and SNIFS would have resolved the two major spectral components ( 0.6″) through spectral decomposition.
Six of the 21 ENLR sources have a secondary classification of “ambiguous”. These sources show resolved stellar components within 1.2″, and the seeing-limited spatially extended [O iii] emission envelops the stellar components. Therefore, we classified them as “ambiguous” because they could still be binary AGNs (Caveat #2 at the beginning of the section).
3.3. Unresolved Narrow-Line Regions: Aligned or Young Outflows?
Finally we consider the category of unresolved narrow-line regions. For the 19 sources in this last category, the centroids of the two major spectral components of each source spatially overlap (Fig. 5). It is possible that these sources can be spatially resolved by AO-aided integral-field spectroscopy with OSIRIS. But it is clear that a fraction of dpAGNs will remain unresolved even at 0.1″ resolution, as seen in the example of SDSS J1050+0839. OSIRIS did, in fact, spatially resolve the gas kinematics in the nuclear NLR of SDSS J0808+4813. For consistency, we include SDSS J0808+4813 in the unresolved category because the spectral components are separated by less than 0.2″, so it would not have been resolved by SNIFS. Although the velocity gradient appears along the major axis of the host galaxy, SDSS J0808+4813 is unlikely a nuclear disk: because the -band luminosity indicates a total stellar mass of , the virial mass within the central 200 pc ( = (/200 km s-1)2 (/200 pc) M⊙) seems too large to be gravitationally confined. We believe most of these spatially unresolved dpAGNs are aligned or young outflows.
Among the 11 merging galaxies in this category, SDSS J1151+4711 is a binary AGN (§ 3.1), SDSS J0924+0510 is ambiguous ( = 0.4″), SDSS J1239+5314 has an ENLR, and the rest appear to be single AGNs. Of course, we cannot exclude faint [O iii] emission from the companions below our SNIFS sensitivity limit ( erg s-1 cm-2 arcsec-2; § 2.2.2) or AGNs without optical signatures.
4. Integral-Field vs. Long-Slit Spectroscopy
Six of the 42 IFS-observed sources overlap with the long-slit sample of Liu et al. (2010a) and Shen et al. (2011a). The overlapped sample includes 4 binary AGNs, 1 resolved NLR (similar to our “ENLR” class), and 1 ambiguous source (similar to our “unresolved” class) according to their classification. These sources are noted in Table 2 and are all in our ENLR category (Fig. 4). Our classifications differ from theirs for the same sources because of the complete spatial coverage of the IFS data. This result highlights the importance of integral-field spectroscopy in classifying dpAGNs. In the following, we discuss the overlapping sources in details.
We agree on the classification of SDSS J04000652 as an ENLR source. Shen et al. (2011a) showed two long-slit spectra at PA = and ; and only the spectrum at PA = shows the ENLR, in agreement with the gas morphology we see in the SNIFS datacube (Fig. 4).
We classified SDSS J1108+0659 as an ambiguous ENLR source because the two nuclei, separated by 0.7″, are swamped by the much larger (4″) ENLR. Liu et al. (2010a) measure only a 0.9″ separation between the [O iii] components in their long-slit spectrum because the slit is aligned with the nuclei, and therefore, it missed the bulk of the emission from the ENLR.
Our IFS data suggest that the other three of the four supposed binary AGNs in their sample are likely ENLRs powered by single AGNs (SDSS J1146+5110, SDSS J1332+0606, and SDSS J1356+1026), although additional data are required to test both scenarios. For SDSS J1146+5110, the NE nucleus shows strong H emission but non-detectable [O iii] emission, so the gas is likely photoionized, at least partly, by star formation. The 2D spectrum of Liu et al. (2010a) shows clearly three kinematic components in [O ii], H, and [N ii] but only two prominent SW components in [O iii]. The authors classified SDSS J1332+0606 and SDSS J1356+1026 as binary AGNs because the emission-line clouds in the ENLRs are aligned at similar PAs to the stellar components. Note that for both SDSS J1332+0606 and SDSS J1356+1026, the centroids of the [O iii] emission are offset from the southern nuclei by a few kpcs and the emission seen at the locations of these nuclei are likely due to seeing smearing. Of course, we cannot rule out the possibility that the observed offset is due to blending between a weak nuclear NLR and a strong offset emission-line nebula, like in the case of SDSS J2333+0049 (Fig. 4). Future deep IFS data with higher spatial resolution can test this scenario.
Shen et al. (2011a) did not spatially resolve the ENLR of SDSS J2333+0049 because their long-slit PA of is almost perpendicular to the elongated orientation of the ENLR.
5. Discussion
5.1. Statistics of Double-Peaked AGN Types
The majority of dpAGNs are due either to ENLRs or to small-scale gas kinematics. ENLRs account for half (21/42) of our IFS-observed dpAGNs in both merging (13/26) and isolated sources (8/16). We thus expect ENLRs around 50% of dpAGNs. Unresolved gas kinematics account for 45% (19/42) of the IFS-observed dpAGNs, which splits into 42% (11/26) and 50% (8/16) in merging and isolated AGNs, respectively. Taking into account the bias of the IFS sample, we expect 48% of dpAGNs are due to unresolved nuclear gas kinematics.
We found four promising binary AGNs. Only two of these have a double-peaked line profile attributable to the relative velocity difference of the merging nuclei; for the other two the double-peaked profile is a result of gas kinematics. Binary AGNs thus account for 15% (4/26) of the merging dpAGNs (that we have resolved). There are seven ambiguous cases for which we cannot rule out the binary AGN scenario, because of the limited spatial resolution of the SNIFS datacubes (Table 2). If we assume that all of the ambiguous cases are binaries, then we get an upper limit of 42% (11/26) for the binary AGN fraction in merging dpAGNs.
From our high-resolution imaging survey we found that only 29% (31/106) of dpAGNs are mergers; and for the purpose of this discussion, let us assume that AGNs with a single stellar nucleus cannot be kpc-scale binary AGNs. Therefore, we conclude that the binary AGN fraction in dpAGNs is 4.512%555The total percentage of the above three categories exceeds 100% because 29 of the binary AGNs also belong to the other two categories.. If we include the ambiguous cases, our result agrees with that of Shen et al. (2011a) (10%), although we have identified a different set of binary AGNs (see § 4). In the next subsection, we discuss the binary AGN fraction in all SDSS AGNs.
5.2. Binary AGN Fraction and Completeness of Double-Peaked Selection
From a Monte Carlo simulation assuming identical intrinsic relative velocities (500 km s-1) and line widths (250 km s-1) for all systems, Shen et al. (2011a) estimated that roughly 20% of kpc-scale binary AGNs would have been selected as a double-peaked AGN from SDSS fiber spectra. In the following, we attempt to constrain the total binary fraction of all SDSS AGNs () and the completeness of the double-peaked selection to kpc-scale binaries () using the four promising binary AGNs we have identified in a sample of 26 merging dpAGNs.
Because 1% of AGNs are double-peaked (; Wang et al., 2009; Liu et al., 2010b; Smith et al., 2010) and % of dpAGNs are resolved mergers in our 0.1″-resolution images, the fraction of AGNs that are binaries where orbital motion has produced the line-splitting is % (2/2629%1%; errors have been propagated); and it should be the product of the total binary fraction and the double-peaked selection completeness:
| (1) |
Similarly, the fraction of serendipitous binaries among AGNs where other mechanisms produced line splitting is % (2/2424/2629%1%). Assuming that binary AGN do not tend to drive physical mechanisms (such as outflows) that can produce double-peaked emission lines, the serendipitous binary fraction should be the product of the kinematic dpAGN666These are objects that are double-peaked because of gas kinematics instead of orbital motion. fraction in all AGNs, the total binary fraction, and the double-peaked selection incompleteness ():
| (2) |
For simplicity, we have used the total dpAGN fraction () in place of non-binary dpAGN fraction, because 98% of the dpAGNs are due to mechanisms other than binary orbital motion (§ 5.1).
Combining the above two equations, we obtain:
| (3) |
| (4) |
Our nominal binary AGN fraction lies close to the upper limit of that of Shen et al. (2011a) (0.52.5%), but the double-peaked selection completeness is an order-of-magnitude lower. This implies that the characteristic relative velocity of binary AGNs is lower than the 500 km s-1 assumed by Shen et al. (2011a).
There is a non-negligible probability that SMBHs in a merging pair are accreting simultaneously by chance, appearing as a binary AGN. If interactions do not enhance nuclear accretion, we would expect 0.3% of AGNs are kpc-scale binaries. This “chance” binary fraction is simply the product of the average AGN duty cycle (1% for at ; Shankar et al., 2009) and the 29% merger fraction of AGNs (assuming it is the same as that of the dpAGNs). We adopted the 1% duty cycle because the black hole masses of the type-1 dpAGNs are all greater than with a mean value of (Shen et al., 2011b). The observed binary fraction () is already five times higher than this “chance” binary fraction even at the lower bound of the 1 confidence interval. This result provides evidence that galaxy interactions enhance AGN activities (i.e., increasing the AGN duty cycle from 1% to %), although a larger sample of binary AGNs and a more sophisticated calculation incorporating AGN [O iii] luminosity functions and merger rates (e.g., Yu et al., 2011) are needed to draw the final conclusion.
5.3. The Formation of Extended Narrow-Line Regions
Although inefficient for identifying binary AGNs, the double-peaked selection technique is efficient for identifying ENLRs around AGNs (§ 5.1): the SNIFS observations have accumulated 20 ENLRs at . Here we attempt to constrain the formation of such extended nebulae with the current data.
The mass of a fully ionized cloud is proportional to the luminosity of hydrogen recombination lines at a given electron density ():
| (5) | |||||
where is the total volume occupied by the cloud, is the filling factor, is the proton mass, the case-B recombination coefficient of H ( cm3 s-1; Osterbrock & Ferland, 2006), and the energy of an H photon ( erg). Adopting an average [O iii] 5007/H ratio of 6 and cm-3, the total masses in the ENLRs range from to . To avoid the “classical” NLR in the inner part, we integrated only the pixels at distances greater than 1″ from the nuclei.
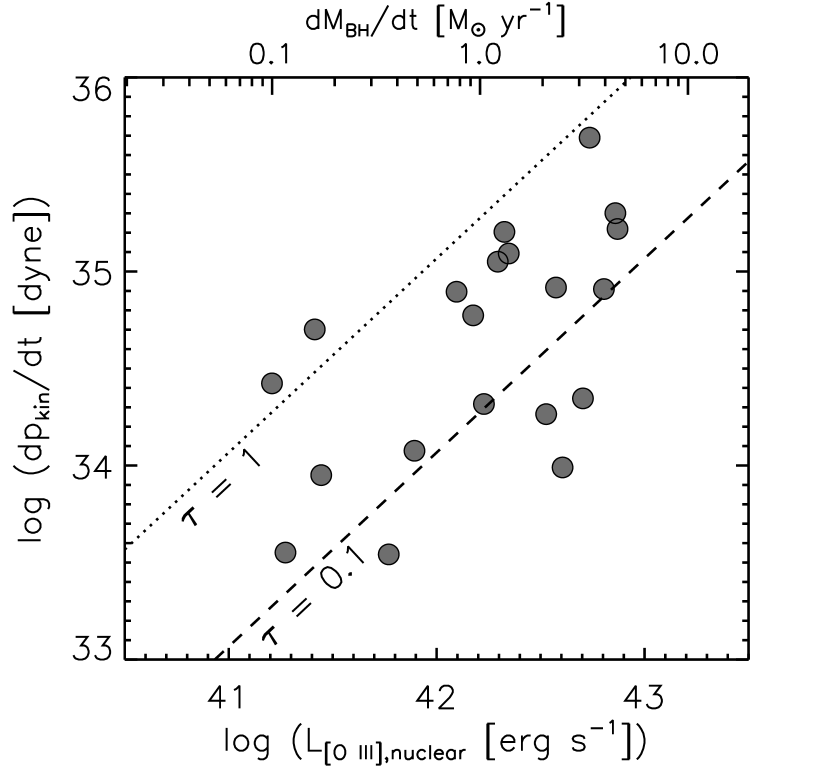
Further, we can estimate the total momentum () of the ionized gas with the velocity maps. Finally, the size of the ENLR (§ 5.4) divided by the maximum line-of-sight velocity gives a dynamical timescale () between 8 and 70 Myrs, consistent with the typical AGN lifetime. Assuming the momentum has been accumulated throughout the dynamical timescale, we can estimate the rate of momentum injection (), a diagnostic that can be compared with models.
It is possible that the radiation pressure from the AGN created the ENLRs, because the gas is believed to be dusty (Dopita et al., 2002; Groves et al., 2004). Our sample is a mixture of type-1 and type-2 AGNs, so we used the nuclear [O iii] 5007 luminosity to infer the AGN bolometric luminosity (; Zakamska et al., 2003; Heckman et al., 2004). The rate of momentum injection from radiation pressure is , where is the effective optical depth and is the speed of light. Figure 6 compares the measured rate of momentum injection with the expected rate of injection from radiation pressure at the current AGN luminosity. It shows that radiation pressure is sufficient to drive the outflow if the ENLR is moderately optically thick to the AGN radiation.
The uncertainties in this analysis are dominated by the lack of knowledge on the mass-weighted electron density. We have adopted a density of 1 cm-3 because of the success of the two-phase photoionization model in fitting the emission lines of quasar EELRs (Stockton et al., 2002; Fu & Stockton, 2007). There, we have also shown that [O ii] or [S ii] doublets overestimate mass-weighted electron densities because high-density low-excitation regions dominate [O ii] and [S ii] emission. Because the momentum is inversely proportional to the density, the data points in Fig. 6 easily can be offset by one dex along the vertical direction, compromising the conclusion. Detailed photoionization modeling on deeper spectra is needed to better constrain the formation of the ENLRs.
5.4. SizeLuminosity Relation of Narrow-Line Regions

AGN photoionized gas extending over kpc-scales has been detected around QSOs (Stockton & MacKenty, 1987) and Seyfert galaxies (Unger et al., 1987; Mulchaey et al., 1996) for over three decades. Inspired by the size-luminosity relation of AGN broad-line regions (e.g., Wandel et al., 1999), several more recent studies have suggested a similar correlation for the NLRs (e.g., Bennert et al., 2002; Schmitt et al., 2003; Greene et al., 2011). Because of the importance of this relation to our understanding of the NLR, we re-examine this relation with the SNIFS data. Integral-field spectroscopy is well-suited for this kind of study because it combines the advantages of previous long-slit spectroscopy (better surface-brightness sensitivity) and HST narrow-band imaging (more complete spatial coverage).
We determined the NLR radius as the longest distance from the nucleus to any lenslet with valid [O iii] 5007 detections, i.e., emission-line peak-to-noise ratios greater than 2.0. Figure 7 plots the NLR radius as a function of [O iii] luminosity integrated over the entire SNIFS field of view. We measured the sizes of both ENLRs and unresolved NLRs. For the latter, the measurements are considered as upper limits.
We compare the best-fit relations from previous studies and our data. Because we reached a similar depth as the long-slit study of Greene et al. (2011), which is an order-of-magnitude deeper than those from HST narrow-band imaging ( erg s-1 cm-2 arcsec-2; Bennert et al., 2002), our measurements are more consistent with the former than the latter. Considering the upper limits from the unresolved NLRs, the dispersion of this relation is at least 0.3 dex.
6. Summary
We have used integral-field spectroscopy and 0.1″-resolution broad-band images to investigate the nature of double-peaked [O iii] AGNs selected from the SDSS spectroscopic sample. Our main conclusions can be summarized as follows:
-
1.
The relative velocity of a merging pair, each associated with an AGN NLR, accounts for only 2% of the double-peaked [O iii] AGNs. Gas kinematics produced 98% of the double-peaked [O iii] AGNs, which split almost evenly between spatially resolved and unresolved NLRs in seeing-limited data. We find the same fraction (50%) of extended narrow-line regions around mergers and isolated dpAGNs.
-
2.
We identified two binary AGNs from sources where gas kinematics produced the double-peaked [O iii] lines. The relatively high fraction of such serendipitous binaries implies a low completeness (1%) of double-peaked selection to binary AGNs and a total binary AGN fraction of % in all SDSS AGNs at . The binary AGN fraction implies an AGN duty cycle (%) much higher than the average AGN duty cycle (1%), suggesting galaxy interactions enhance nuclear accretion.
-
3.
About 29% of the dpAGNs appear to be mergers at 0.1″-resolution. But multiple black holes are simultaneously accreting only in 1542% of these mergers. The upper limit included the seven ambiguous cases. Therefore, only 412% of double-peaked SDSS AGNs could be binary AGNs.
-
4.
The total mass of the ionized gas in the 20 extended narrow-line regions in the SNIFS sample range from to , assuming an electron density of 1 cm-3. We show that the radiation pressure from the AGN could have expelled enough gas to 10 kpc scales over the AGN lifetime and therefore created the extended narrow-line regions.
-
5.
We measure a size-luminosity relation for the NLRs consistent with that of Greene et al. (2011) from ground-based long-slit spectra. There is at least 0.3 dex dispersion around the best-fit power-law.
Although this work was first motivated by the belief that the double-peaked AGN sample offers the best candidates to search for kpc-scale binary AGNs, we and others (Shen et al., 2011a; Rosario et al., 2011) have shown that this selection is primarily identifying AGNs with secondary peaks due to ionized gas kinematics. Furthermore, through this study we have realized that the double-peaked sample offers very little advantage over more general AGN samples in terms of searching for binary AGNs, because the binary fraction in all AGNs (2.4%) is only slightly lower than that in dpAGNs (4%). Finally, we caution that because the binary AGNs that we found are either type-1type-2 or type-2type-2 pairs, we can not completely rule out the single AGN scenario: that the gas in one of the nuclei is photoionized by the AGN in the neighboring galaxy. The ultimate test awaits future high-resolution X-ray images from Chandra and/or radio images from the EVLA.
References
- Aldering et al. (2002) Aldering, G., et al. 2002, in SPIE Conference Series, Vol. 4836, 61–72
- Aldering et al. (2006) Aldering, G., et al. 2006, ApJ, 650, 510
- Bacon et al. (1995) Bacon, R., et al. 1995, A&AS, 113, 347
- Baldwin et al. (1981) Baldwin, J. A., Phillips, M. M., & Terlevich, R. 1981, PASP, 93, 5
- Barnes & Hernquist (1996) Barnes, J. E., & Hernquist, L. 1996, ApJ, 471, 115
- Begelman et al. (1980) Begelman, M. C., Blandford, R. D., & Rees, M. J. 1980, Nature, 287, 307
- Bennert et al. (2002) Bennert, N., Falcke, H., Schulz, H., Wilson, A. S., & Wills, B. J. 2002, ApJ, 574, L105
- Bianchi et al. (2008) Bianchi, S., Chiaberge, M., Piconcelli, E., Guainazzi, M., & Matt, G. 2008, MNRAS, 386, 105
- Boroson & Lauer (2009) Boroson, T. A., & Lauer, T. R. 2009, Nature, 458, 53
- Cameron (2011) Cameron, E. 2011, Publications of the Astronomical Society of Australia, 28, 128
- Cardelli et al. (1989) Cardelli, J. A., Clayton, G. C., & Mathis, J. S. 1989, ApJ, 345, 245
- Chen et al. (1989) Chen, K., Halpern, J. P., & Filippenko, A. V. 1989, ApJ, 339, 742
- Comerford et al. (2009) Comerford, J. M., et al. 2009, ApJ, 698, 956
- Davies (2007) Davies, R. I. 2007, MNRAS, 375, 1099
- Djorgovski (1991) Djorgovski, S. 1991, in The space distribution of quasars, Vol. 21, 349–353
- Djorgovski et al. (1987) Djorgovski, S., Perley, R., Meylan, G., & McCarthy, P. 1987, ApJ, 321, L17
- Dopita et al. (2002) Dopita, M. A., Groves, B. A., Sutherland, R. S., Binette, L., & Cecil, G. 2002, ApJ, 572, 753
- Dunkley et al. (2009) Dunkley, J., et al. 2009, ApJS, 180, 306
- Eracleous et al. (2011) Eracleous, M., Boroson, T. A., Halpern, J. P., & Liu, J. 2011, preprint, arXiv:1106.2952
- Eracleous & Halpern (2003) Eracleous, M., & Halpern, J. P. 2003, ApJ, 599, 886
- Eracleous et al. (1997) Eracleous, M., Halpern, J. P., Gilbert, A. M., Newman, J. A., & Filippenko, A. V. 1997, ApJ, 490, 216
- Fischer et al. (2011) Fischer, T. C., Crenshaw, D. M., Kraemer, S. B., Schmitt, H. R., Mushotsky, R. F., & Dunn, J. P. 2011, ApJ, 727, 71
- Fu et al. (2011a) Fu, H., Myers, A. D., Djorgovski, S. G., & Yan, L. 2011a, ApJ, 733, 103
- Fu & Stockton (2007) Fu, H., & Stockton, A. 2007, ApJ, 666, 794
- Fu & Stockton (2009a) —. 2009a, ApJ, 690, 953
- Fu & Stockton (2009b) —. 2009b, ApJ, 696, 1693
- Fu et al. (2011b) Fu, H., et al. 2011b, ApJ, 740, L44
- Gaskell (1983) Gaskell, C. M. 1983, in Liege International Astrophysical Colloquia, Vol. 24, 473–477
- Gaskell (1996) Gaskell, C. M. 1996, ApJ, 464, L107
- Gelderman & Whittle (1994) Gelderman, R., & Whittle, M. 1994, ApJS, 91, 491
- Gerke et al. (2007) Gerke, B. F., et al. 2007, ApJ, 660, L23
- Green et al. (2010) Green, P. J., Myers, A. D., Barkhouse, W. A., Mulchaey, J. S., Bennert, V. N., Cox, T. J., & Aldcroft, T. L. 2010, ApJ, 710, 1578
- Greene et al. (2011) Greene, J. E., Zakamska, N. L., Ho, L. C., & Barth, A. J. 2011, ApJ, 732, 9
- Groves et al. (2004) Groves, B. A., Dopita, M. A., & Sutherland, R. S. 2004, ApJS, 153, 9
- Heckman et al. (2004) Heckman, T. M., Kauffmann, G., Brinchmann, J., Charlot, S., Tremonti, C., & White, S. D. M. 2004, ApJ, 613, 109
- Hennawi et al. (2006) Hennawi, J. F., et al. 2006, AJ, 131, 1
- Junkkarinen et al. (2001) Junkkarinen, V., Shields, G. A., Beaver, E. A., Burbidge, E. M., Cohen, R. D., Hamann, F., & Lyons, R. W. 2001, The Astrophysical Journal Letters, 549, L155
- Kauffmann et al. (2003) Kauffmann, G., et al. 2003, MNRAS, 346, 1055
- Kellermann et al. (1989) Kellermann, K. I., Sramek, R., Schmidt, M., Shaffer, D. B., & Green, R. 1989, AJ, 98, 1195
- Kewley et al. (2006) Kewley, L. J., Groves, B., Kauffmann, G., & Heckman, T. 2006, MNRAS, 372, 961
- Kochanek et al. (1999) Kochanek, C. S., Falco, E. E., & Muñoz, J. A. 1999, ApJ, 510, 590
- Komossa et al. (2003) Komossa, S., Burwitz, V., Hasinger, G., Predehl, P., Kaastra, J. S., & Ikebe, Y. 2003, ApJ, 582, L15
- Komossa et al. (2008) Komossa, S., Zhou, H., & Lu, H. 2008, ApJ, 678, L81
- Kormendy & Richstone (1995) Kormendy, J., & Richstone, D. 1995, ARA&A, 33, 581
- Koss et al. (2011) Koss, M., et al. 2011, ApJ, 735, L42
- Krabbe et al. (2004) Krabbe, A., Gasaway, T., Song, I., Iserlohe, C., Weiss, J., Larkin, J. E., Barczys, M., & Lafreniere, D. 2004, in SPIE Conference Series, Vol. 5492, 1403–1410
- Lantz et al. (2004) Lantz, B., et al. 2004, in SPIE Conference Series, Vol. 5249, 146–155
- Larkin et al. (2006) Larkin, J., et al. 2006, in SPIE Conference Series, Vol. 6269, 42
- Liu et al. (2010a) Liu, X., Greene, J. E., Shen, Y., & Strauss, M. A. 2010a, ApJ, 715, L30
- Liu et al. (2010b) Liu, X., Shen, Y., Strauss, M. A., & Greene, J. E. 2010b, ApJ, 708, 427
- Liu et al. (2011) Liu, X., Shen, Y., Strauss, M. A., & Hao, L. 2011, preprint, arXiv:1104.0950
- Markwardt (2009) Markwardt, C. B. 2009, in ASP Conference Series, Astronomical Data Analysis Software and Systems XVIII, D. A. Bohlender, D. Durand, and P. Dowler, eds., Vol. 411, 251
- McGurk et al. (2011) McGurk, R. C., Max, C. E., Rosario, D. J., Shields, G. A., Smith, K. L., & Wright, S. A. 2011, ApJ, 738
- Mulchaey et al. (1996) Mulchaey, J. S., Wilson, A. S., & Tsvetanov, Z. 1996, ApJS, 102, 309
- Myers et al. (2007) Myers, A. D., Brunner, R. J., Richards, G. T., Nichol, R. C., Schneider, D. P., & Bahcall, N. A. 2007, ApJ, 658, 99
- Myers et al. (2008) Myers, A. D., Richards, G. T., Brunner, R. J., Schneider, D. P., Strand, N. E., Hall, P. B., Blomquist, J. A., & York, D. G. 2008, ApJ, 678, 635
- Osterbrock & Ferland (2006) Osterbrock, D. E., & Ferland, G. J. 2006, Astrophysics of gaseous nebulae and active galactic nuclei (Sausalito, CA: University Science Books, 2006)
- Richstone et al. (1998) Richstone, D., et al. 1998, Nature, 395, 14
- Rodriguez et al. (2006) Rodriguez, C., Taylor, G. B., Zavala, R. T., Peck, A. B., Pollack, L. K., & Romani, R. W. 2006, ApJ, 646, 49
- Rosario et al. (2011) Rosario, D. J., McGurk, R. C., Max, C. E., Shields, G. A., & Smith, K. L. 2011, preprint, arXiv:1102.1733
- Rosario et al. (2010) Rosario, D. J., Shields, G. A., Taylor, G. B., Salviander, S., & Smith, K. L. 2010, ApJ, 716, 131
- Schlegel et al. (1998) Schlegel, D. J., Finkbeiner, D. P., & Davis, M. 1998, ApJ, 500, 525
- Schmitt et al. (2003) Schmitt, H. R., Donley, J. L., Antonucci, R. R. J., Hutchings, J. B., Kinney, A. L., & Pringle, J. E. 2003, ApJ, 597, 768
- Shankar et al. (2009) Shankar, F., Weinberg, D. H., & Miralda-Escudé, J. 2009, ApJ, 690, 20
- Shen et al. (2011a) Shen, Y., Liu, X., Greene, J. E., & Strauss, M. A. 2011a, ApJ, 735, 48
- Shen et al. (2011b) Shen, Y., et al. 2011b, ApJS, 194, 45
- Shields et al. (2011) Shields, G. A., Rosario, D. J., Junkkarinen, V., Chapman, S. C., Bonning, E. W., & Chiba, T. 2011, arXiv e-prints, 1109, 1524
- Smith et al. (2010) Smith, K. L., Shields, G. A., Bonning, E. W., McMullen, C. C., Rosario, D. J., & Salviander, S. 2010, ApJ, 716, 866
- Stockton et al. (2007) Stockton, A., Canalizo, G., Fu, H., & Keel, W. 2007, ApJ, 659, 195
- Stockton et al. (2004) Stockton, A., Canalizo, G., Nelan, E. P., & Ridgway, S. E. 2004, ApJ, 600, 626
- Stockton & MacKenty (1987) Stockton, A., & MacKenty, J. W. 1987, ApJ, 316, 584
- Stockton et al. (2002) Stockton, A., MacKenty, J. W., Hu, E. M., & Kim, T.-S. 2002, ApJ, 572, 735
- Toomre & Toomre (1972) Toomre, A., & Toomre, J. 1972, ApJ, 178, 623
- Tsalmantza et al. (2011) Tsalmantza, P., Decarli, R., Dotti, M., & Hogg, D. W. 2011, arXiv e-prints, 1106, 1180
- Unger et al. (1987) Unger, S. W., Pedlar, A., Axon, D. J., Whittle, M., Meurs, E. J. A., & Ward, M. J. 1987, MNRAS, 228, 671
- Wandel et al. (1999) Wandel, A., Peterson, B. M., & Malkan, M. A. 1999, ApJ, 526, 579
- Wang et al. (2009) Wang, J.-M., Chen, Y.-M., Hu, C., Mao, W.-M., Zhang, S., & Bian, W.-H. 2009, ApJ, 705, L76
- Wizinowich et al. (2006) Wizinowich, P. L., et al. 2006, PASP, 118, 297
- Xu & Komossa (2009) Xu, D., & Komossa, S. 2009, ApJ, 705, L20
- Yu et al. (2011) Yu, Q., Lu, Y., Mohayaee, R., & Colin, J. 2011, arXiv e-prints, 1105, 1963
- Zakamska et al. (2003) Zakamska, N. L., et al. 2003, AJ, 126, 2125
| SDSS Name | IFS | Exptime | UT | Seeing | Depth | Image Source |
|---|---|---|---|---|---|---|
| (second) | (″) | |||||
| (1) | (2) | (3) | (4) | (5) | (6) | (7) |
| 012613.3142013 | SNIFS/B&R | 900 | 100809 | 0.7 | 0.9 | |
| 040001.6065254 | SNIFS/R | 1800 | 100809 | 0.7 | 3.2 | OSIRIS/Hbb |
| 080315.7483603* | SNIFS/B&R | 900 | 110326 | 0.4 | 1.6 | NIRC2/Kp |
| 080841.2481352 | OSIRIS/Kn2 | 1800 | 100307 | 0.7 | NIRC2/Kp | |
| 081507.4430427* | SNIFS/B&R | 1200 | 110329 | 0.7 | 3.8 | NIRC2/Kp |
| 090246.9012028 | SNIFS/B&R | 1200 | 110329 | 0.7 | 1.8 | NIRC2/Kp |
| 091646.0283527 | SNIFS/B&R | 1200 | 110329 | 0.6 | 4.1 | NIRC2/Kp |
| 092455.2051052 | SNIFS/B&R | 3600 | 110329 | 0.7 | 2.8 | NIRC2/Kp |
| 094032.3311329 | SNIFS/B&R | 1800 | 110329 | 1.1 | 1.8 | NIRC2/Kp |
| 095207.6255257* | SNIFS/B&R | 2400 | 110326 | 0.4 | 0.6 | OSIRIS/Hbb |
| 105052.5083935 | OSIRIS/Kn3 | 2400 | 100307 | 0.7 | NIRC2/Kp | |
| 105104.5625159* | SNIFS/B&R | 1200 | 110326 | 0.5 | 1.0 | NIRC2/Kp |
| 110851.0065901 | SNIFS/B&R | 1200 | 110329 | 0.8 | 2.1 | NIRC2/Kp |
| 114642.5511030 | SNIFS/B&R | 1200 | 110326 | 0.4 | 1.5 | NIRC2/Kp |
| 115106.7471158* | SNIFS/B&R | 1200 | 110326 | 0.6 | 0.6 | NIRC2/Kp |
| 115523.7150757* | SNIFS/B&R | 900 | 101121 | 0.5 | 3.6 | NIRC2/Kp |
| 123915.4531415* | SNIFS/B&R | 1800 | 100804 | 0.5 | 1.2 | NIRC2/Kp |
| 124037.8353437 | OSIRIS/Kn3 | 1800 | 100307 | 0.7 | OSIRIS/Hbb | |
| 124859.7025731* | SNIFS/B&R | 2400 | 110326 | 0.4 | 0.6 | NIRC2/Kp |
| 125327.5254747* | SNIFS/B&R | 3600 | 110329 | 0.7 | 0.6 | NIRC2/Kp |
| 130128.8005804 | SNIFS/B&R | 600 | 100808 | 0.6 | 6.3 | ACS/F550M |
| 130724.1460401* | SNIFS/B&R | 1800 | 100808 | 0.5 | 0.5 | NIRC2/Kp |
| 133226.3060627 | SNIFS/B&R | 2400 | 110326 | 0.5 | 3.4 | NIRC2/Kp |
| 135024.7240251* | SNIFS/B&R | 2400 | 110326 | 0.8 | 1.1 | NIRC2/Kp |
| 135646.1102609 | SNIFS/B&R | 900 | 100804 | 0.7 | 8.2 | NIRC2/Kp |
| 140816.0015528 | SNIFS/B&R | 3600 | 100809 | 0.5 | 1.2 | |
| 144012.8615633* | SNIFS/B&R | 1200 | 110329 | 0.6 | 0.9 | NIRC2/Kp |
| 150243.1111557* | SNIFS/B&R | 1800 | 100804 | 0.8 | 1.3 | NIRC2/Kp |
| 150437.7541150* | SNIFS/B&R | 1200 | 110329 | 0.6 | 1.5 | NIRC2/Kp |
| 151656.6183022 | SNIFS/B&R | 900 | 100809 | 0.6 | 0.9 | |
| 151735.2214533* | SNIFS/B&R | 3600 | 100804 | 0.7 | 0.5 | NIRC2/Kp |
| 152431.4323751 | SNIFS/B&R | 1800 | 100809 | 0.6 | 0.3 | |
| 153231.8420343* | SNIFS/B&R | 1200 | 110329 | 0.7 | 1.0 | NIRC2/Kp |
| 154107.8203609* | SNIFS/B&R | 3600 | 100806 | 0.6 | 1.0 | NIRC2/Kp |
| 161826.9081951* | SNIFS/B&R | 900 | 100809 | 0.5 | 1.6 | NIRC2/Kp |
| 161847.9215925* | SNIFS/B&R | 1500 | 100809 | 0.6 | 0.8 | NIRC2/Kp |
| 164713.4383140 | SNIFS/B&R | 1800 | 100809 | 0.6 | 1.0 | |
| 165206.1310708 | SNIFS/B&R | 1800 | 100806 | 0.6 | 2.3 | NIRC2/Kp |
| 171930.6293413* | SNIFS/B&R | 1200 | 110329 | 0.7 | 1.5 | NIRC2/Kp |
| 172049.2310646 | SNIFS/B&R | 1500 | 100804 | 0.5 | 1.6 | NIRC2/Kp |
| 233313.2004912 | SNIFS/B&R | 900 | 100808 | 0.5 | 2.2 | NIRC2/Kp |
| 235256.6001155 | SNIFS/B&R | 900 | 100809 | 0.6 | 1.4 | NIRC2/Kp |
Note. — Column 1: J2000 designation. type-1s are indicated by stars. Column 2: Name of the Integral-Field Spectrograph (IFS). Column 3: Total exposure time of the spectrum. Column 4: UT date (yymmdd) of the spectrum. Column 5: Outside seeing at 5000Å during the spectroscopic observation (http://kiloaoloa.soest.hawaii.edu/current/seeing/). Column 6: [O iii] surface brightness depth of the reduced SNIFS datacube in 10-16 erg s-1 cm-2 arcsec-2, see § 2.2.2. Column 7: Source of the high-resolution broad-band image.
| SDSS Name | FWHMb | FWHMr | Secondary Class | S11 Class | |||||||
|---|---|---|---|---|---|---|---|---|---|---|---|
| (km s-1) | log() | log() | (km s-1) | (km s-1) | (″) | (kpc) | |||||
| (1) | (2) | (3) | (4) | (5) | (6) | (7) | (8) | (9) | (10) | (11) | (12) |
| Orbital Motion | |||||||||||
| 095207.6255257* | 0.339 | 442 | 8.55 | 8.41 | 682 | 249 | 1.00 | 4.8 | |||
| 150243.1111557* | 0.390 | 657 | 9.84 | 8.96 | 384 | 354 | 36 | 1.39 | 7.4 | ENLR | |
| Extended Narrow-Line Region | |||||||||||
| 012613.3142013 | 0.573 | 580 | 8.72 | 9.35 | 426 | 334 | 4698 | ||||
| 040001.6065254 | 0.171 | 391 | 8.43 | 8.73 | 344 | 397 | 10 | NLR | |||
| 081507.4430427* | 0.510 | 536 | 8.96 | 9.52 | 419 | 509 | 106 | 1.95 | 12.0 | ||
| 105104.5625159* | 0.436 | 364 | 9.25 | 8.19 | 847 | 167 | 1 | 1.52 | 8.6 | ||
| 110851.0065901 | 0.182 | 204 | 8.74 | 8.27 | 686 | 159 | 28 | 0.73 | 2.2 | ambiguous | binary |
| 114642.5511030 | 0.130 | 287 | 8.03 | 8.17 | 183 | 264 | 2.84 | 6.6 | binary | ||
| 115523.7150757* | 0.287 | 480 | 8.91 | 8.50 | 928 | 265 | 2 | 0.58 | 2.5 | ambiguous | |
| 124037.8353437 | 0.161 | 491 | 8.79 | 8.20 | 899 | 338 | 28 | 0.19 | 0.5 | binary | |
| 124859.7025731* | 0.487 | 380 | 8.58 | 9.04 | 92 | 362 | 0.53 | 3.2 | ambiguous | ||
| 125327.5254747* | 0.483 | 688 | 8.74 | 8.25 | 1130 | 148 | 32 | 0.72 | 4.3 | ambiguous | |
| 130724.1460401* | 0.352 | 518 | 8.30 | 8.32 | 629 | 208 | 2.37 | 11.7 | |||
| 133226.3060627 | 0.207 | 409 | 7.79 | 8.04 | 271 | 439 | 1.58 | 5.4 | binary | ||
| 135646.1102609 | 0.123 | 383 | 8.85 | 9.19 | 397 | 411 | 128 | 1.32 | 2.9 | binary | |
| 140816.0015528 | 0.166 | 339 | 7.64 | 7.67 | 167 | 216 | 11 | ||||
| 150437.7541150* | 0.305 | 719 | 9.02 | 8.21 | 362 | 351 | |||||
| 151735.2214533* | 0.399 | 324 | 8.62 | 8.06 | 781 | 124 | 1.10 | 5.9 | ambiguous | ||
| 161847.9215925* | 0.334 | 365 | 8.84 | 8.49 | 328 | 140 | 5 | ||||
| 164713.4383140 | 0.164 | 340 | 7.52 | 7.49 | 181 | 185 | |||||
| 172049.2310646 | 0.095 | 389 | 7.69 | 7.29 | 231 | 416 | 0.38 | 0.7 | ambiguous | ||
| 233313.2004912 | 0.170 | 434 | 8.29 | 8.67 | 370 | 449 | 1234 | ambiguous | |||
| 235256.6001155 | 0.167 | 322 | 7.98 | 7.86 | 287 | 212 | |||||
| Unresolved Narrow-Line Region | |||||||||||
| 080315.7483603* | 0.635 | 262 | 8.98 | 8.92 | 285 | 157 | 7 | 2.63 | 18.0 | ||
| 080841.2481352 | 0.124 | 396 | 7.62 | 7.82 | 320 | 359 | |||||
| 090246.9012028 | 0.513 | 304 | 8.87 | 9.37 | 132 | 526 | 34 | 2.71 | 16.8 | ||
| 091646.0283527 | 0.142 | 418 | 9.05 | 8.18 | 473 | 120 | 13 | 1.23 | 3.1 | ||
| 092455.2051052 | 0.150 | 429 | 7.25 | 7.57 | 261 | 333 | 0.44 | 1.2 | ambiguous | ||
| 094032.3311329 | 0.170 | 374 | 7.71 | 7.49 | 322 | 132 | 2.45 | 7.1 | |||
| 105052.5083935 | 0.169 | 351 | 8.19 | 8.18 | 366 | 369 | |||||
| 115106.7471158* | 0.318 | 644 | 9.20 | 9.33 | 774 | 667 | 3 | 1.29 | 6.0 | binary | |
| 123915.4531415* | 0.202 | 715 | 7.87 | 7.76 | 297 | 825 | 75 | 1.26 | 4.2 | ENLR | |
| 130128.8005804 | 0.246 | 292 | 9.11 | 8.26 | 731 | 283 | 17 | 1.40 | 5.4 | ||
| 135024.7240251* | 0.557 | 277 | 8.69 | 8.57 | 190 | 227 | 1.80 | 11.6 | |||
| 144012.8615633* | 0.275 | 505 | 8.89 | 8.42 | 1494 | 298 | 2 | ENLR | |||
| 151656.6183022 | 0.580 | 400 | 9.77 | 9.53 | 693 | 354 | 26314 | ||||
| 152431.4323751 | 0.629 | 480 | 9.41 | 8.92 | 378 | 307 | |||||
| 153231.8420343* | 0.209 | 353 | 8.51 | 8.44 | 290 | 251 | |||||
| 154107.8203609* | 0.508 | 441 | 8.96 | 8.63 | 374 | 241 | 2.00 | 12.3 | |||
| 161826.9081951* | 0.446 | 384 | 8.62 | 9.54 | 195 | 689 | 137 | ||||
| 165206.1310708 | 0.075 | 307 | 6.59 | 6.73 | 137 | 155 | 2.96 | 4.2 | |||
| 171930.6293413* | 0.180 | 1105 | 8.12 | 7.67 | 1265 | 776 | 2 | ||||
Note. — Objects are grouped according to the origin of the double-peaked [O iii] lines. Column 1: J2000 designation. type-1s are indicated by stars. Column 2: Redshift. Column 3: Velocity splitting between [O iii] components: , where and are the redshifts of the redshifted and blueshifted [O iii] components, respectively. Columns 4 and 5: [O iii] 5007 luminosity in log() for the blueshifted () and redshifted () line, corrected for Galactic extinction. Columns 6 and 7: [O iii] 5007 FWHMs, corrected for the km s-1 instrumental broadening. Column 8: Kellermann et al. (1989) radio loudness, . Columns 9 and 10: Projected angular separation (arcsec) and physical separation (kpc) between the main components in a merging system. Column 11: Secondary classification (§ 3). Column 12: Classification from Shen et al. (2011a).
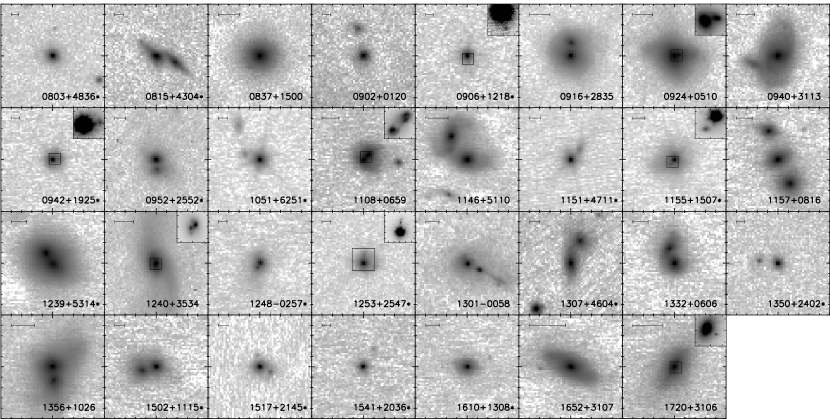
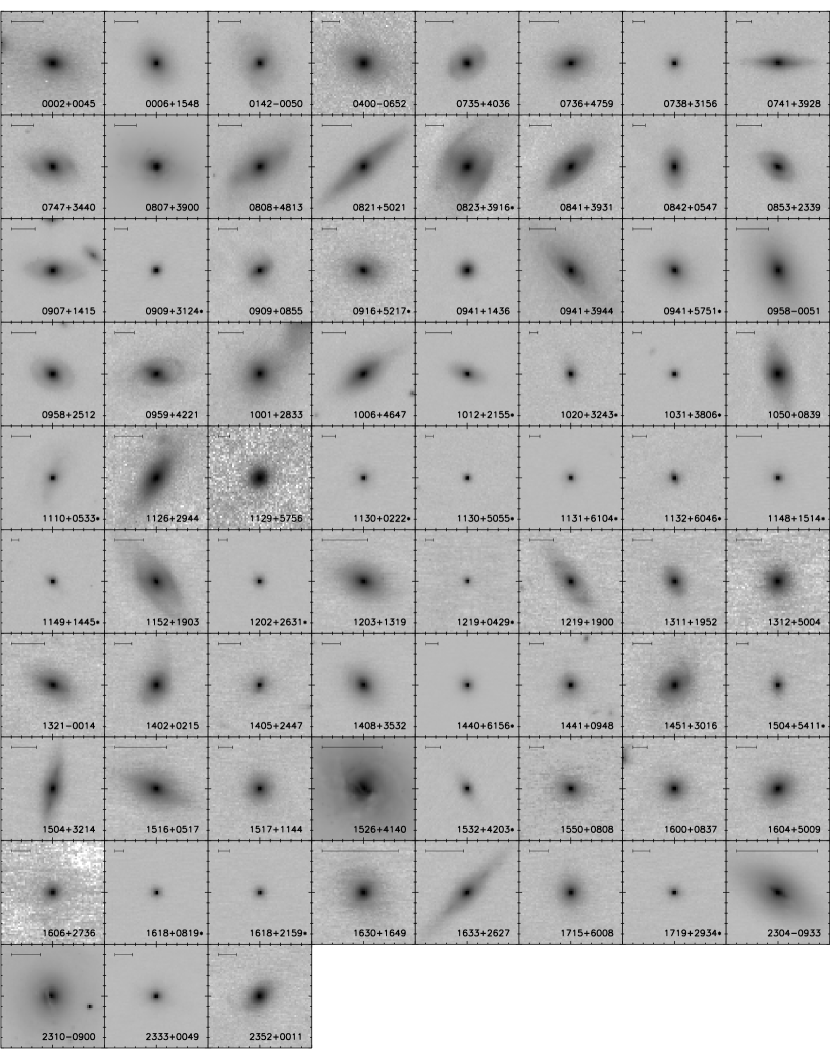
Appendix A High-Resolution Images of Double-Peaked AGNs
We show the high-resolution images of the 106 dpAGNs from our Keck LGSAO program and the HST archive in Figures 8 & 9 for objects with and without companions within 3″, respectively. Tables 3 & 4 list the properties and observing details.
| SDSS Name | Imager | Exptime | UT | Seeing | IFS | Ref | |||||
|---|---|---|---|---|---|---|---|---|---|---|---|
| (km s-1) | (″) | (kpc) | (second) | (″) | |||||||
| (1) | (2) | (3) | (4) | (5) | (6) | (7) | (8) | (9) | (10) | (11) | (12) |
| 080315.7483603* | 0.635 | 262 | 7 | 2.63 | 18.0 | NIRC2/Kp | 420 | 110105 | 0.6 | 1 | 3 |
| 081507.4430427* | 0.510 | 536 | 106 | 1.95 | 12.0 | NIRC2/Kp | 540 | 110105 | 0.6 | 1 | 3 |
| 083713.5150037 | 0.141 | 387 | 7 | 1.37 | 3.4 | NIRC2/Kp | 480 | 110106 | 0.9 | 0 | 1 |
| 090246.9012028 | 0.513 | 304 | 34 | 2.71 | 16.8 | NIRC2/Kp | 600 | 110106 | 0.8 | 1 | 3 |
| 090615.9121846* | 0.644 | 357 | 0.61 | 4.2 | NIRC2/Kp | 448 | 110105 | 0.5 | 0 | 3 | |
| 091646.0283527 | 0.142 | 418 | 13 | 1.23 | 3.1 | NIRC2/Kp | 660 | 110106 | 1.0 | 1 | 1 |
| 092455.2051052 | 0.150 | 429 | 0.44 | 1.2 | NIRC2/Kp | 660 | 110106 | 1.0 | 1 | 3 | |
| 094032.3311329 | 0.170 | 374 | 2.45 | 7.1 | NIRC2/Kp | 840 | 110106 | 1.0 | 1 | 1 | |
| 094236.7192541* | 0.540 | 515 | 1 | 0.44 | 2.8 | NIRC2/Kp | 640 | 110105 | 0.5 | 0 | 3 |
| 095207.6255257* | 0.339 | 442 | 1.00 | 4.8 | OSIRIS/Hbb | 480 | 100306 | 0.7 | 1 | 3 | |
| 105104.5625159* | 0.436 | 364 | 1 | 1.52 | 8.6 | NIRC2/Kp | 600 | 110105 | 0.5 | 1 | 3 |
| 110851.0065901 | 0.182 | 204 | 28 | 0.73 | 2.2 | NIRC2/Kp | 192 | 100604 | 0.3 | 1 | 1 |
| 114642.5511030 | 0.130 | 287 | 2.84 | 6.6 | NIRC2/Kp | 704 | 100604 | 0.4 | 1 | 1 | |
| 115106.7471158* | 0.318 | 644 | 3 | 1.29 | 6.0 | NIRC2/Kp | 600 | 110105 | 0.4 | 1 | 3 |
| 115523.7150757* | 0.287 | 480 | 2 | 0.58 | 2.5 | NIRC2/Kp | 352 | 100603 | 0.7 | 1 | 3 |
| 115715.0081632 | 0.201 | 375 | 2.61 | 8.6 | NIRC2/Kp | 448 | 100603 | 0.7 | 0 | 3 | |
| 123915.4531415* | 0.202 | 715 | 75 | 1.26 | 4.2 | NIRC2/Kp | 1088 | 100604 | 0.3 | 1 | 3 |
| 124037.8353437 | 0.161 | 491 | 28 | 0.19 | 0.5 | OSIRIS/Hbb | 960 | 100307 | 0.7 | 1 | 1 |
| 124859.7025731* | 0.487 | 380 | 0.53 | 3.2 | NIRC2/Kp | 768 | 100604 | 0.4 | 1 | 3 | |
| 125327.5254747* | 0.483 | 688 | 32 | 0.72 | 4.3 | NIRC2/Kp | 420 | 110105 | 0.4 | 1 | 3 |
| 130128.8005804 | 0.246 | 292 | 17 | 1.40 | 5.4 | ACS/F550M | 2148 | 030809 | 1 | 1 | |
| 130724.1460401* | 0.352 | 518 | 2.37 | 11.7 | NIRC2/Kp | 448 | 100604 | 0.3 | 1 | 3 | |
| 133226.3060627 | 0.207 | 409 | 1.58 | 5.4 | NIRC2/Kp | 768 | 100604 | 0.4 | 1 | 1,3 | |
| 135024.7240251* | 0.557 | 277 | 1.80 | 11.6 | NIRC2/Kp | 420 | 110105 | 0.4 | 1 | 3 | |
| 135646.1102609 | 0.123 | 383 | 128 | 1.32 | 2.9 | NIRC2/Kp | 704 | 100603 | 0.8 | 1 | 1 |
| 150243.1111557* | 0.390 | 657 | 36 | 1.39 | 7.4 | NIRC2/Kp | 448 | 100603 | 0.7 | 1 | 3 |
| 151735.2214533* | 0.399 | 324 | 1.10 | 5.9 | NIRC2/Kp | 960 | 100604 | 0.4 | 1 | 3 | |
| 154107.8203609* | 0.508 | 441 | 2.00 | 12.3 | NIRC2/Kp | 448 | 100604 | 0.3 | 1 | 3 | |
| 161027.4130807* | 0.229 | 326 | 2.35 | 8.6 | NIRC2/Kp | 192 | 100604 | 0.3 | 0 | 3 | |
| 165206.1310708 | 0.075 | 307 | 2.96 | 4.2 | NIRC2/Kp | 320 | 100603 | 0.6 | 1 | 1,2 | |
| 172049.2310646 | 0.095 | 389 | 0.38 | 0.7 | NIRC2/Kp | 384 | 100603 | 0.5 | 1 | 1 |
Note. — Observing log and properties of the 31 dpAGNs with close companions. Column 1: J2000 designation. type-1s are indicated by stars. Column 2: redshift. Column 3: velocity splitting between [O iii] 5007 components. Column 4: Kellermann et al. (1989) radio loudness, . Columns 5,6: Projected angular separation (arcsec) and physical separation (kpc) between the main components in a merging system. Column 7: name of the imager and the filter. Column 8: total exposure time of the image. Column 9: UT date (yymmdd) of the image. Column 10: outside seeing at 5000Å during the imaging observation. Column 11: IFS data available? 1 - yes, 0 - no. Column 12: source references—(1) Liu et al. (2010b), (2) Wang et al. (2009), (3) Smith et al. (2010).
| SDSS Name | Imager | Exptime | UT | Seeing | IFS | Ref | |||
|---|---|---|---|---|---|---|---|---|---|
| (km s-1) | (second) | (″) | |||||||
| (1) | (2) | (3) | (4) | (5) | (6) | (7) | (8) | (9) | (10) |
| 000249.1004505 | 0.087 | 534 | 7 | NIRC2/Kp | 192 | 110105 | 0.6 | 0 | 1,2 |
| 000656.9154848 | 0.125 | 382 | NIRC2/Kp | 300 | 110105 | 0.7 | 0 | 2 | |
| 014209.0005050 | 0.133 | 248 | NIRC2/Kp | 240 | 110105 | 0.7 | 0 | 2 | |
| 040001.6065254 | 0.171 | 391 | 10 | OSIRIS/Hbb | 240 | 100306 | 0.7 | 1 | 1 |
| 073509.5403624 | 0.103 | 264 | NIRC2/Kp | 420 | 110105 | 0.7 | 0 | 2 | |
| 073656.5475947 | 0.096 | 257 | 21 | NIRC2/Kp | 240 | 110105 | 0.7 | 0 | 1 |
| 073849.8315612 | 0.297 | 297 | 506 | NIRC2/Kp | 240 | 110105 | 0.7 | 0 | 1 |
| 074129.7392836 | 0.210 | 429 | 28 | NIRC2/Kp | 240 | 110105 | 0.6 | 0 | 3 |
| 074729.8344018 | 0.130 | 319 | NIRC2/Kp | 240 | 110105 | 0.6 | 0 | 2 | |
| 080741.0390015 | 0.023 | 637 | 2 | WFPC2/F606W | 500 | 950226 | 0 | 2 | |
| 080841.2481352 | 0.124 | 396 | NIRC2/Kp | 720 | 110106 | 0.6 | 1 | 1,2,3 | |
| 082107.9502116 | 0.095 | 338 | 6 | NIRC2/Kp | 360 | 110106 | 0.9 | 0 | 1,2 |
| 082357.8391631* | 0.166 | 580 | NIRC2/Kp | 420 | 110105 | 0.5 | 0 | 3 | |
| 084130.2393119 | 0.132 | 332 | NIRC2/Kp | 480 | 110106 | 1.0 | 0 | 1 | |
| 084227.5054716 | 0.275 | 490 | 404 | NIRC2/Kp | 480 | 110106 | 0.8 | 0 | 1 |
| 085358.6233911 | 0.113 | 215 | NIRC2/Kp | 480 | 110106 | 0.9 | 0 | 1 | |
| 090754.0141509 | 0.120 | 285 | NIRC2/Kp | 900 | 110106 | 0.8 | 0 | 1 | |
| 090947.9312444* | 0.264 | 977 | 2 | NIRC2/Kp | 420 | 110105 | 0.5 | 0 | 3 |
| 090958.3085542 | 0.159 | 341 | 17 | NIRC2/Kp | 720 | 110106 | 0.9 | 0 | 3 |
| 091654.1521723* | 0.219 | 349 | NIRC2/Kp | 448 | 110105 | 0.5 | 0 | 3 | |
| 094100.8143614 | 0.383 | 854 | 59 | NIRC2/Kp | 480 | 110106 | 1.2 | 0 | 3 |
| 094124.0394442 | 0.108 | 285 | 2814 | WFPC2/F555W | 600 | 990426 | 0 | 2 | |
| 094144.8575124* | 0.159 | 339 | 322 | NIRC2/Kp | 420 | 110105 | 0.5 | 0 | 3 |
| 095833.2005119 | 0.086 | 407 | 3 | NIRC2/Kp | 480 | 110106 | 1.2 | 0 | 1,2 |
| 095834.0251235 | 0.116 | 336 | 4 | NIRC2/Kp | 480 | 110106 | 0.9 | 0 | 1 |
| 095920.5422142 | 0.153 | 292 | NIRC2/Kp | 480 | 110106 | 0.8 | 0 | 1 | |
| 100145.3283330 | 0.116 | 513 | NIRC2/Kp | 360 | 110106 | 0.8 | 0 | 3 | |
| 100654.2464717 | 0.123 | 303 | 4 | NIRC2/Kp | 480 | 110106 | 0.8 | 0 | 1 |
| 101241.2215556* | 0.111 | 257 | NIRC2/Kp | 420 | 110105 | 0.5 | 0 | 3 | |
| 102004.4324343* | 0.484 | 381 | NIRC2/Kp | 420 | 110105 | 0.5 | 0 | 3 | |
| 103138.7380652* | 0.492 | 734 | NIRC2/Kp | 600 | 110105 | 0.5 | 0 | 3 | |
| 105052.5083935 | 0.169 | 351 | NIRC2/Kp | 480 | 110106 | 0.9 | 1 | 1 | |
| 111013.2053339* | 0.152 | 755 | NIRC2/Kp | 600 | 110105 | 0.4 | 0 | 3 | |
| 112659.5294443 | 0.102 | 319 | NIRC2/Kp | 110106 | 0.9 | 0 | 1,2 | ||
| 112907.1575605 | 0.313 | 314 | 36 | NIRC2/Kp | 540 | 110106 | 0.9 | 0 | 1 |
| 113021.0022212* | 0.241 | 402 | NIRC2/Kp | 640 | 110105 | 0.4 | 0 | 3 | |
| 113045.3505509* | 0.592 | 252 | NIRC2/Kp | 420 | 110105 | 0.4 | 0 | 3 | |
| 113105.1610405* | 0.338 | 427 | NIRC2/Kp | 600 | 110105 | 0.4 | 0 | 3 | |
| 113257.8604654* | 0.233 | 353 | NIRC2/Kp | 420 | 110105 | 0.3 | 0 | 3 | |
| 114852.7151416* | 0.113 | 306 | NIRC2/Kp | 420 | 110105 | 0.4 | 0 | 3 | |
| 114908.5144547* | 0.595 | 208 | NIRC2/Kp | 420 | 110105 | 0.4 | 0 | 3 | |
| 115249.3190300 | 0.097 | 323 | 9 | NIRC2/Kp | 448 | 100603 | 0.6 | 0 | 1,2 |
| 120240.7263139* | 0.476 | 466 | 66 | NIRC2/Kp | 192 | 100604 | 0.4 | 0 | 3 |
| 120320.7131931 | 0.058 | 292 | 156 | NIRC2/Kp | 224 | 100603 | 0.6 | 0 | 2 |
| 121911.2042906* | 0.555 | 459 | NIRC2/Kp | 64 | 100603 | 0.7 | 0 | 3 | |
| 121957.5190003 | 0.117 | 390 | NIRC2/Kp | 448 | 100603 | 0.6 | 0 | 1 | |
| 131106.7195234 | 0.156 | 314 | NIRC2/Kp | 448 | 100603 | 0.7 | 0 | 1 | |
| 131236.0500416 | 0.116 | 353 | 16 | NIRC2/Kp | 128 | 100604 | 0.4 | 0 | 2 |
| 132104.6001446 | 0.082 | 330 | NIRC2/Kp | 448 | 100603 | 0.7 | 0 | 1 | |
| 140231.6021546 | 0.180 | 276 | 2553 | NIRC2/Kp | 448 | 100603 | 0.7 | 0 | 1 |
| 140534.8244735 | 0.130 | 218 | 3 | NIRC2/Kp | 224 | 100604 | 0.4 | 0 | 1 |
| 140845.7353218 | 0.166 | 371 | 16 | NIRC2/Kp | 448 | 100603 | 0.7 | 0 | 1 |
| 144012.8615633* | 0.275 | 505 | 2 | NIRC2/Kp | 320 | 100603 | 0.7 | 1 | 3 |
| 144157.2094859 | 0.220 | 826 | 61 | NIRC2/Kp | 320 | 100604 | 0.4 | 0 | 3 |
| 145156.8301603 | 0.158 | 512 | NIRC2/Kp | 320 | 100603 | 0.8 | 0 | 1 | |
| 150437.7541150* | 0.305 | 719 | NIRC2/Kp | 256 | 100603 | 0.7 | 1 | 3 | |
| 150452.3321415 | 0.113 | 250 | 7 | NIRC2/Kp | 384 | 100603 | 0.8 | 0 | 2 |
| 151659.2051752 | 0.051 | 326 | 8 | NIRC2/Kp | 160 | 100604 | 0.5 | 0 | 1,2 |
| 151757.4114453 | 0.227 | 433 | NIRC2/Kp | 320 | 100603 | 0.7 | 0 | 3 | |
| 152606.2414014 | 0.008 | 281 | 30 | WFPC2/F606W | 500 | 940828 | 0 | 2 | |
| 153231.8420343* | 0.209 | 353 | NIRC2/Kp | 448 | 100604 | 0.4 | 1 | 3 | |
| 155009.6080839 | 0.232 | 400 | 23 | NIRC2/Kp | 128 | 100604 | 0.3 | 0 | 1 |
| 160027.8083743 | 0.227 | 422 | 3765 | NIRC2/Kp | 320 | 100604 | 0.3 | 0 | 1 |
| 160436.2500958 | 0.146 | 366 | NIRC2/Kp | 320 | 100604 | 0.3 | 0 | 1,2 | |
| 160631.4273643 | 0.158 | 319 | 9 | NIRC2/Kp | 128 | 100604 | 0.4 | 0 | 1 |
| 161826.9081951* | 0.446 | 384 | 137 | NIRC2/Kp | 160 | 100603 | 0.6 | 1 | 3 |
| 161847.9215925* | 0.334 | 365 | 5 | NIRC2/Kp | 160 | 100603 | 0.6 | 1 | 3 |
| 163056.8164957 | 0.034 | 301 | 2 | NIRC2/Kp | 192 | 100604 | 0.5 | 0 | 1 |
| 163316.0262716 | 0.071 | 307 | NIRC2/Kp | 320 | 100603 | 0.6 | 0 | 2 | |
| 171544.0600835 | 0.157 | 348 | 62 | NIRC2/Kp | 320 | 100603 | 0.6 | 0 | 1,3 |
| 171930.6293413* | 0.180 | 1105 | 2 | NIRC2/Kp | 224 | 100603 | 0.6 | 1 | 3 |
| 230442.8093345 | 0.032 | 320 | 8 | NIRC2/Kp | 320 | 100603 | 0.7 | 0 | 1,2 |
| 231052.0090012 | 0.094 | 329 | 138 | ACS/F606W | 720 | 050819 | 0 | 1,2 | |
| 233313.2004912 | 0.170 | 434 | 1234 | NIRC2/Kp | 384 | 100603 | 0.7 | 1 | 1 |
| 235256.6001155 | 0.167 | 322 | NIRC2/Kp | 384 | 100604 | 0.5 | 1 | 1 |
Note. — Observing log and properties of the 75 dpAGNs without close companions in HST or Keck/LGSAO images. Column 1: J2000 designation. type-1s are indicated by stars. Column 2: redshift. Column 3: velocity splitting between [O iii] 5007 components. Column 4: Kellermann et al. (1989) radio loudness, . Column 5: name of the imager and the filter. Column 6: total exposure time of the image. Column 7: UT date (yymmdd) of the image. Column 8: outside seeing at 5000Å during the imaging observation. Column 9: IFS data available? 1 - yes, 0 - no. Column 10: source references—(1) Liu et al. (2010b), (2) Wang et al. (2009), (3) Smith et al. (2010).