The Two-Component Radio Luminosity Function of QSOs: Star Formation and AGN
Abstract
Despite decades of study, it remains unclear whether there are distinct radio-loud and radio-quiet populations of quasi-stellar objects (QSOs). Early studies were limited by inhomogeneous QSO samples, inadequate sensitivity to probe the radio-quiet population, and degeneracy between redshift and luminosity for flux-density-limited samples. Our new 6 GHz EVLA observations allow us for the first time to obtain nearly complete (97%) radio detections in a volume-limited color-selected sample of 179 QSOs more luminous than from the Sloan Digital Sky Survey (SDSS) Data Release Seven in the narrow redshift range . The dramatic improvement in radio continuum sensitivity made possible with the new EVLA allows us, in 35 minutes of integration, to detect sources as faint as 20 Jy, or at , well below the radio luminosity, , that separates star-forming galaxies from radio-loud active galactic nuclei (AGNs) driven by accretion onto a super-massive black hole. We calculate the radio luminosity function (RLF) for these QSOs using three constraints: (a) EVLA 6 GHz observations for , (b) NRAO-VLA Sky Survey (NVSS) observations for , and (c) the total number of SDSS QSOs in our volume-limited sample. We show that the RLF can be explained as a superposition of two populations, dominated by AGNs at the bright end and star formation in the QSO host galaxies at the faint end.
1 INTRODUCTION
Since the discovery of optically selected QSOs (Sandage, 1965), the difference between the “radio-loud” (RLQ) and “radio-quiet” (RQQ) QSO populations remains elusive. There has been a continuing controversy as to whether the radio luminosity distribution of QSOs is bimodal (e.g., Kellermann et al., 1989; Ivezić et al., 2002, 2004) or is merely broad and smooth (e.g., Cirasuolo et al., 2003; Lacy et al., 2001). A bimodal distribution suggests that two distinct physical processes are present, with one process being significantly more powerful than the other.
The two primary sources of radio emission from galaxies are (1) accretion onto super-massive black holes in active galactic nuclei (AGNs) and (2) star formation. Radio-AGN emission is due to synchrotron from relativistic plasma jets, and the associated hotspots and lobes resulting from jet interaction with the surrounding medium. Star formation yields free-free emission from HII regions and synchrotron radiation from relativistic electrons believed to be accelerated in supernova remnants. Radio AGNs can be extremely luminous, with radio emission reaching in the case of 3C 273 (Kellermann et al., 1969), whereas star formation leads to radio luminosities of for a galaxy like the Milky Way, or as high as in the case of a star-bursting galaxy such as Arp 220. Radio-AGNs dominate the radio luminosity function (RLF) of galaxies brighter than in the radio, while star-formation in galaxies without an AGN dominates at fainter luminosities (Condon et al., 2002).
The question as to the nature of radio emission in radio-quiet QSOs has not been previously addressed using a homogeneous and complete QSO sample that is sensitive to luminosities significantly fainter than . It is possible that some, if not all, QSOs are hosted in star-forming galaxies, which only become visible at radio wavelengths when the AGN radio emission is below some given threshold. In this Letter, we use results from the Expanded Very Large Array (EVLA) (Perley et al., 2011) to constrain the radio luminosity function (RLF) of QSOs. We show that the RLF is consistent with the hypothesis that QSO radio sources with 6 GHz spectral luminosity are powered primarily by AGNs, while those with are powered primarily by star formation in their host galaxies.
By taking advantage of recent advances in both radio and optical capabilities, we have, for the first time, obtained nearly complete radio detections in a large volume-limited sample of optically selected QSOs. In this Letter, we describe early results of our EVLA observations. In Section 2 we describe the target selection and radio observations. In Section 3 we present our results and interpret them in terms of the superimposed radio contributions from AGNs and star-forming host galaxies. Our conclusions are summarized in Section 4.
2 DATA
2.1 Target selection
Our color-selected targets were drawn from the Schneider et al. (2010) quasar catalog of the seventh data release (DR7) of the Sloan Digital Sky Survey (SDSS) (Abazajian et al., 2009). We selected nearby QSOs in order to reach a spectral luminosity limit of after 35 minutes of integration with the 2 GHz bandwidth available at the EVLA, and in a narrow redshift range to minimize the effects of evolution. Our selection criteria were:
-
1.
targeted by the SDSS for spectroscopy using the “low ” color criteria (see explanation below)
-
2.
( km s-1 Mpc-1, )
-
3.
(apparent magnitude corrected for extinction according to Schlegel et al., 1998), which is well above the SDSS completeness limit
-
4.
-
5.
We used the SDSS to select a homogeneous sample of SDSS QSOs. The SDSS identifies low-redshift QSO candidates for follow-up spectroscopy by their non-stellar colors in the SDSS color cube. These sources are labeled in the SDSS database with the QSO targeting flag “low z”. QSOs are then selected from all objects with spectra, and identified by having at least one broad emission line with FWHM greater than 1000 km s-1 (Richards et al., 2002).
The selection criteria result in 179 targets that comprise a volume-limited, color-selected sample of all QSOs in 2.66 steradians in the redshift range . Owing to the color selection criteria, our sample may miss some QSOs in our search volume that happen to have stellar colors. However, it constitutes a fully optically selected sample with no radio biases. About one-third of QSOs in our target list were already known radio emitters found in the Faint Images of the Radio Sky at Twenty cm (FIRST) (Becker et al., 1995) survey (peak flux density mJy at GHz) and/or found in the NRAO—VLA Sky Survey (NVSS) ( mJy at GHz) (Condon et al., 1998).
2.2 Observations
All of the observations were made with the C configuration of the EVLA using a nominal bandwidth of 2 GHz centered on 6 GHz in each of two circular polarizations, which were combined to make total intensity images. Because any source detected in the FIRST or NVSS surveys is expected to be at least a few hundred microjanskys at 6 GHz, we observed the QSOs identified with FIRST or NVSS radio sources for only three minutes. To minimize sidelobes in the dirty beam we tried to divide these short snapshot observations into two 90 s segments widely separated in hour angle, but owing to scheduling constraints about 10% of these FIRST/NVSS sources were observed for only 90 s at one hour angle. All such sources were detected in the single 90 s observation. All other QSOs were, at first, observed for five minutes. Most of those that were clearly detected in the five minute observation were re-observed for another five minutes at a different hour angle. The remaining sources were observed for an additional 30–35 minutes, their observations were combined, and the resulting images generally reach the expected rms noise levels of 6–8Jy per synthesized beam solid angle ( FWHM).
For the purposes of this Letter, we consider sources to be detected at a confidence level. This confidence level is appropriate, given that the QSO positions are known with accuracy from the SDSS (Pier et al., 2003). Less than 10% of the QSOs in our sample have 3– detections; the probability than any one of these is false is . Thus the probability that our sample contains even one false detection is .
3 AGN and Galaxy Components of QSO Radio Emission
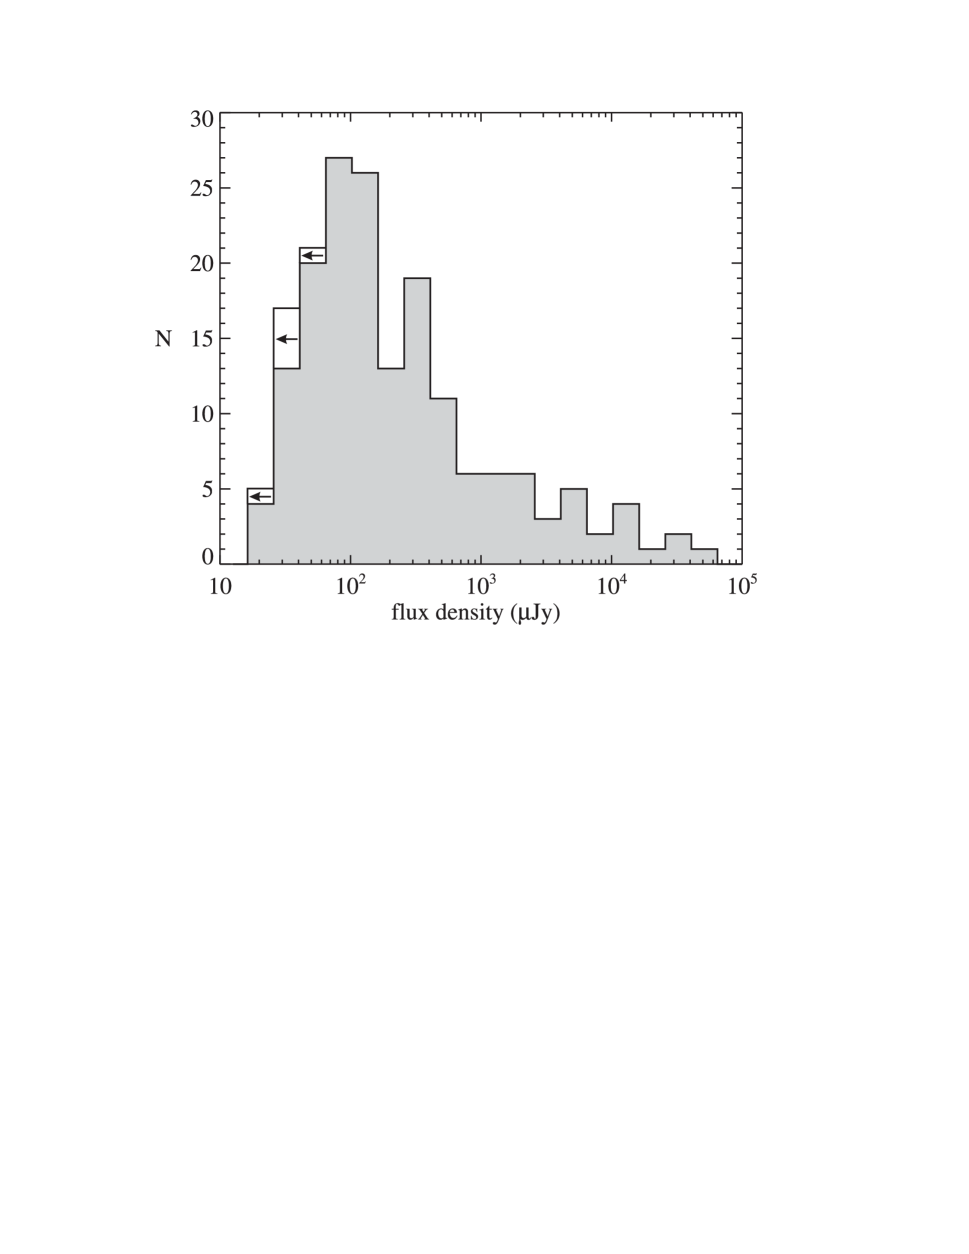
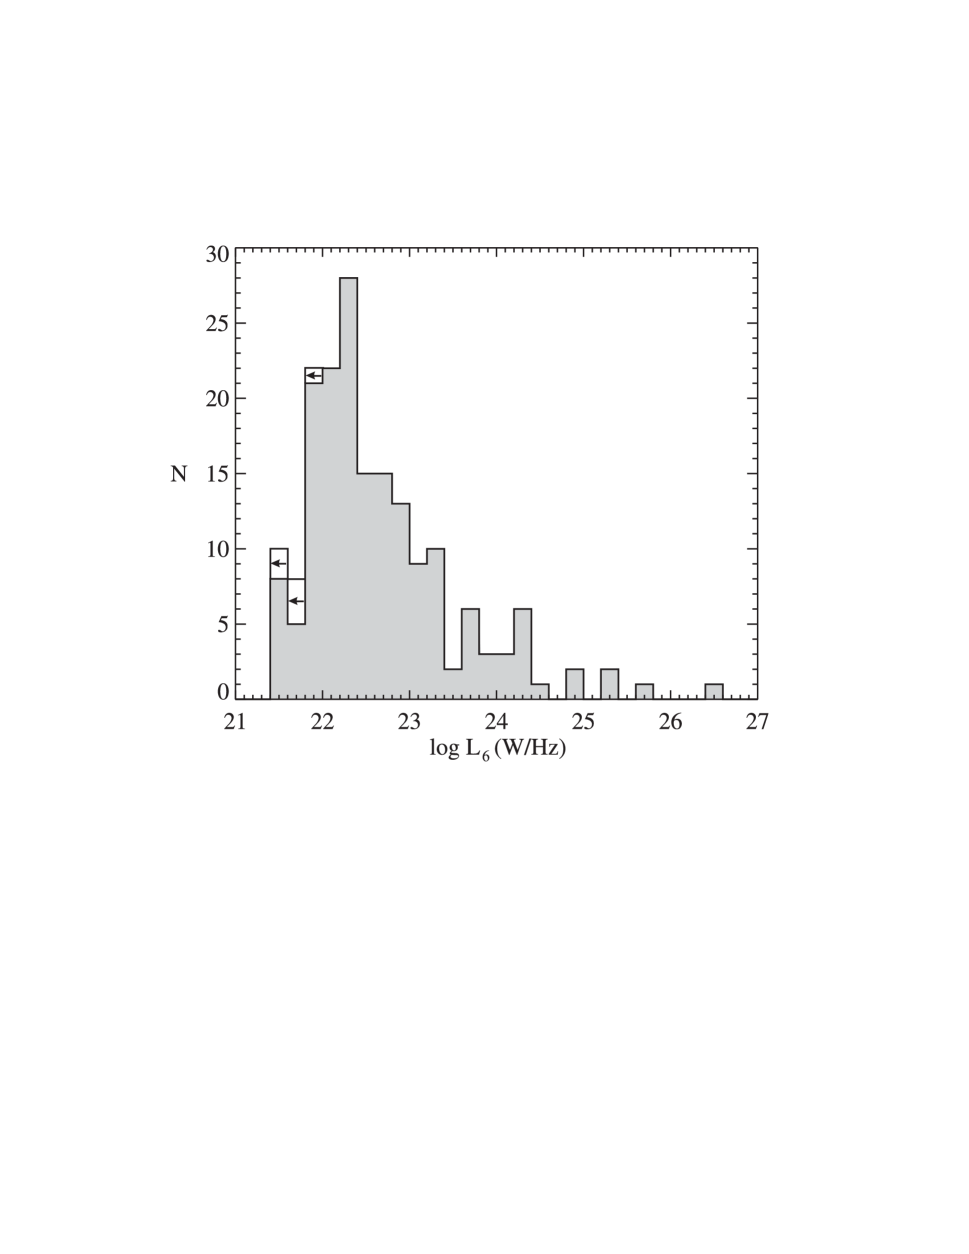
In the top panel of Figure 1, we show the distribution of observed 6 GHz flux densities for the compact (unresolved on scale) radio components coincident with the 179 QSOs in our color-selected sample. In the bottom panel, we show the corresponding spectral luminosity distribution calculated assuming a spectral index (where ; see discussion below) for the -correction (Hogg et al., 2002). The observed distributions are clearly peaked around 100 Jy and a few times W Hz-1 respectively, which are well above our detection limits. Only six QSOs remain undetected. For one of these, 103421.71+605318.1, there was a strong 69 mJy source in the field, which degraded the sensitivity limit by a factor of 2.5. For the other five undetected QSOs, the rms noise ranges from 7 to 11 Jy, somewhat above our nominal limit owing to interference, limited on-source observing time, or inadequate dynamic range. We include the upper limits of these six undetected sources in Figure 1.
For the purposes of this Letter, we assume that all of the QSOs have a spectral index of between 6 GHz and 1.4 GHz. A direct measurement of the true spectral index for a faint FIRST source is difficult, as a significant fraction of emission can be missed from faint sources owing to “clean bias” (Condon et al., 1998). The NVSS resolution ( beam) is not a good match to the resolution of our EVLA observations ( beam); thus it can also be difficult to measure accurate spectral indices for extended NVSS sources in the sample. The 6 GHz EVLA observations suggest that, except for the very strongest QSOs, the sources appear unresolved. Therefore, we can use NVSS images to estimate the 1.4 GHz flux density of the remaining QSOs, even though they do not have counterparts in the NVSS catalog. We measured the flux densities at the optical positions of all QSOs not identified with cataloged NVSS sources stronger than the catalog limit of 2.4 mJy. The flux-density distribution of these QSOs has a median value of 330 +- 30 microJy. The median flux density of our 6 GHz EVLA detections is 126 Jy, yielding an estimate of for the average spectral index of the QSO sample. This value is typical of star-forming galaxies (Condon, 1992). Using the actual spectral indices of individual sources would not significantly change Figure 1 nor the analysis discussed in the remainder of this section, as a change in spectral index of corresponds to a factor of two in luminosity and a difference of only 0.3 on a scale.
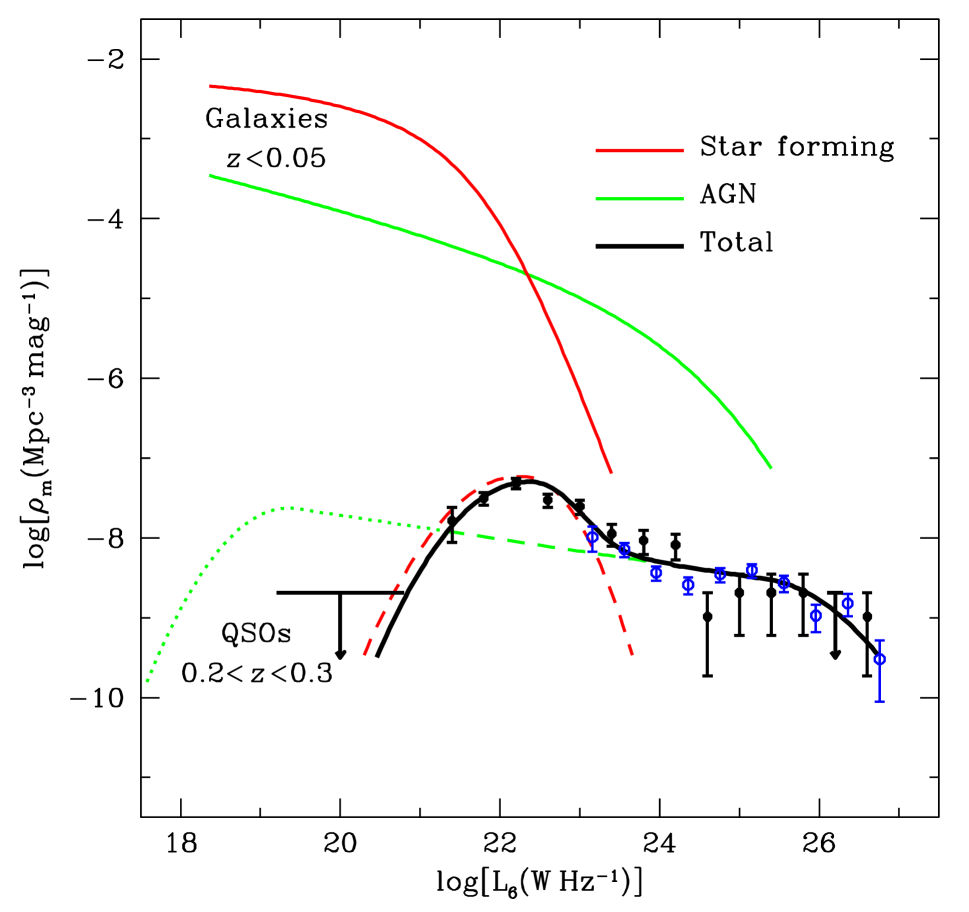
The 6 GHz spectral luminosity function of color-selected QSOs derived from these observations is shown by the black data points with error bars in Figure 2. The luminosity function was calculated using the method on detected sources (Schmidt, 1968). The method statistically determines the RLF using detected quantities; upper limits are not used in the calculation. Instead, undetected sources are accounted for by the normalization of the accessible volume () of the detected sources. Because there are only six undetected QSOs, there cannot be more than six undetected QSOs in the luminosity range , which fact we indicate by the wide upper-limit symbol in Figure 2. Also shown are the 6 GHz luminosity functions of nearby () galaxies whose radio luminosities are dominated either by AGNs (solid green curve) or star formation (solid red curve), calculated from the 1.4 GHz luminosity functions (Condon et al., 2002) using spectral index . The 6 GHz spectral luminosity function of nearby galaxies whose radio sources are dominated by AGNs extends to higher radio luminosities than the luminosity of star-forming galaxies, so AGN-powered sources are more common above ; star-forming galaxies have higher space densities than AGNs at lower luminosities. The nearby “starburst” galaxy M82, which is a typical radio-selected star-forming galaxy, has . This value is close to the W Hz-1 spectral luminosity of the Milky Way at 6 GHz (Berkhuijsen, 1984).
Above , the spectral luminosity of the ultraluminous starburst galaxy Arp 220, it is likely that the QSO radio emission is primarily produced by AGNs. To estimate the luminosity function that would result if all QSO radio emission were powered entirely by AGNs, even at lower luminosities, we extrapolated the high-luminosity QSO luminosity function to faint luminosities as shown by the dashed green curve in Figure 2 for using a calculated slope of . The slope for this extrapolation is not adequately constrained by the small number of QSOs in our sample (16 of 179). Instead, we determined the slope from the observed 1.4 GHz QSO luminosity function, using NVSS (Condon et al., 1998) measurements at the positions of SDSS QSOs in the redshift range . The lack of observed QSOs with very high radio luminosities motivates the fall-off at , although its exact form is not known and cannot be determined from our data. However, this fall-off does not affect the calculation of the power-law slope below . The slope is consistent with the EVLA data points for , as it should be. The dashed green curve is shown extrapolated to to emphasize that it falls below the observed luminosity function in this range; either the AGN luminosity function has a ”bump” not observed in the AGN luminosity function of nearby galaxies or there is an additional energy source contributing to the radio emission of most QSOs with . If the luminosity function of the AGN component alone is extrapolated to still lower luminosities (as suggested by the dotted green line), it must fall off around lest the number of AGN exceed the total number of QSOs in our SDSS sample. The exact form of the luminosity function and its cutoff indicated by the dotted curve is unknown but not critical, because it always predicts that most QSOs powered only by AGN would be weaker than the EVLA detection limit Jy, or if .
In order to be consistent with both the EVLA detections of QSOs stronger than Jy and the total number of SDSS QSOs, the QSO RLF must rise sharply just below and fall fairly sharply at lower luminosities. The total number of SDSS QSOs in this luminosity function is known (179 for ), and limits the integral area of the RLF. Even if all six non-detections are not in the luminosity range , the upper limit in Figure 2 constrains the most conservative estimate of the RLF fall-off. If any of the six non-detections actually have radio luminosity in the range , the RLF at low luminosities must fall even more sharply than what is shown in Figure 2.
We suggest that the rise in the RLF at is the result of radio emission from the star-forming host galaxies. The solid red curve in Figure 2 shows the 6 GHz space density of radio sources powered by all star-forming galaxies in the local universe (Condon et al., 2002). The dashed red curve illustrates one possible form of the 6 GHz spectral-luminosity function for the host galaxies of QSOs, a parabolic fit with fall-off determined independently on either side of the peak. The peak of the curve is at and . The slope of the fall-off on either side of the peak is not tightly constrained by our data. The fall-off slope indicated by of our dashed red curve at is consistent with the fall-off slope of the solid red curve, but with 3% of the space density. This result suggests that the space density of luminous starbursts in QSOs at is approximately 3% the space density of local galaxies powered by starbursts. However, this fraction may be different if the true RLF distribution of star-forming QSO host galaxies is not well-represented by the dashed red curve.
The black curve is the corresponding luminosity function of QSOs whose radio luminosities are the sum of both the AGN and star-forming galaxy luminosities, on the assumption that the AGN and star-forming luminosities are statistically independent. The spectral-luminosity functions indicated by the dashed red curve and by the black curve are constrained by the EVLA detections shown as black data points in Figure 2 and by the total number of SDSS QSOs. The peak of the QSO flux-density distribution implied by the black curve is at , and the peak of the the QSO host-galaxy luminosity function should be at .
As it must, the RLF of the QSO host galaxies (dashed red curve) lies below the RLF of all galaxies powered primarily by star formation (solid red curve). The dashed red curve lies at the luminous end of the star-forming galaxies RLF, suggesting that most QSO host galaxies have higher star-formation rates than galaxies without a QSO. This result is surprising, given that QSOs are traditionally associated with “red and dead” elliptical galaxies, at least for radio-luminous QSOs (typically “quasars”) (Dunlop et al., 2003; Floyd et al., 2004). If the host galaxies of all QSOs were similar to the massive ellipticals with low star-formation rates that typically host radio-luminous QSOs, we would expect the RLF of our QSO sample to follow the extrapolation of the dashed green curve in Figure 2. The rise in the RLF coincides with the typical level of radio emission from star-forming galaxies, suggesting that the host galaxies of the QSOs are not “red and dead” elliptical galaxies. Instead, these host galaxies may have spiral morphology, or the star formation may be the result of galaxy mergers. It has been suggested that active galaxies populating the “green valley”, with colors intermediate between the more typical blue or red galaxy colors, may be high-Eddington-ratio ellipticals with some star formation, or the products of mergers between massive spheroidal galaxies and less massive gas-rich galaxies (e.g., Schawinski et al., 2010; Kaviraj et al., 2009). Characterizing the host galaxy properties of these QSOs will be a crucial follow-up step in investigating this result.
4 CONCLUSIONS
For the first time, our observations adequately sample the radio-quiet population; that is, they detect nearly all optically selected QSOs in a volume-limited sample by reaching . Earlier studies did not have the sensitivity needed to study the full range of radio-quiet QSOs by reaching faint radio flux densities ( mJy) for optical samples with significant numbers of low-redshift () QSOs to probe the low end of the RLF. Analyses based on radio-selected samples are inherently biased toward the radio-loud population, but previous studies reporting smooth luminosity distributions did not extend sufficiently faint to study the radio-quiet population.
The 6 GHz RLF of low-redshift color-selected QSOs is constrained by EVLA detections of sources stronger than Jy and by the very small fraction (6/179) of nondetections in the SDSS sample. The strong sources constrain the AGN contribution above . The fainter sources imply a second radio contributor narrowly peaked around and confirm the two-population model of QSO flux densities found by Kellermann et al. (1989). Using the RLFs of nearby galaxies as examples, we suggest that this second contributor is radio emission produced by strong star formation in the QSO host galaxies, most of which therefore cannot be “red and dead” massive ellipticals.
In this Letter, we have presented the preliminary results of our investigation to characterize the radio population of QSOs using an optically selected, volume limited sample. We suggest that the RLF is a superposition of radio emission from AGNs and from host star formation. It will be important to better understand the relation between QSO emission in different wavelength regimes by characterizing the host galaxies of these QSOs using optical and infrared colors and morphology, as well as the radio morphology. The full details of this study will be presented in a separate paper.
References
- Abazajian et al. (2009) Abazajian, K. N. et al. 2009, ApJS, 182, 543
- Becker et al. (1995) Becker, R. H., White, R. L., & Helfand, D. J. 1995, ApJ, 450, 559
- Berkhuijsen (1984) Berkhuijsen, E. M. 1984, A&A, 140, 431
- Cirasuolo et al. (2003) Cirasuolo, M., Celotti, A., Magliocchetti, M., & Danese, L. 2003, MNRAS, 346, 447
- Condon (1984) Condon, J. J. 1984, ApJ, 287, 461
- Condon (1992) —. 1992, ARA&A, 30, 575
- Condon et al. (2002) Condon, J. J., Cotton, W. D., & Broderick, J. J. 2002, AJ, 124, 675
- Condon et al. (1998) Condon, J. J., Cotton, W. D., Greisen, E. W., Yin, Q. F., Perley, R. A., Taylor, G. B., & Broderick, J. J. 1998, AJ, 115, 1693
- Dunlop et al. (2003) Dunlop, J. S., McLure, R. J., Kukula, M. J., Baum, S. A., O’Dea, C. P., & Hughes, D. H. 2003, MNRAS, 340, 1095
- Floyd et al. (2004) Floyd, D. J. E., Kukula, M. J., Dunlop, J. S., McLure, R. J., Miller, L., Percival, W. J., Baum, S. A., & O’Dea, C. P. 2004, MNRAS, 355, 196
- Hamilton (2010) Hamilton, T. S. 2010, MNRAS, 407, 2393
- Hogg et al. (2002) Hogg, D. W., Baldry, I. K., Blanton, M. R., & Eisenstein, D. J. 2002, ArXiv Astrophysics e-prints
- Ivezić et al. (2002) Ivezić, Ž. et al. 2002, AJ, 124, 2364
- Ivezić et al. (2004) Ivezić, Ž. et al. 2004, in Astronomical Society of the Pacific Conference Series, Vol. 311, AGN Physics with the Sloan Digital Sky Survey, ed. G. T. Richards & P. B. Hall, 347
- Kaviraj et al. (2009) Kaviraj, S., Peirani, S., Khochfar, S., Silk, J., & Kay, S. 2009, MNRAS, 394, 1713
- Kellermann et al. (1969) Kellermann, K. I., Pauliny-Toth, I. I. K., & Williams, P. J. S. 1969, ApJ, 157, 1
- Kellermann et al. (1989) Kellermann, K. I., Sramek, R., Schmidt, M., Shaffer, D. B., & Green, R. 1989, AJ, 98, 1195
- Lacy et al. (2001) Lacy, M., Laurent-Muehleisen, S. A., Ridgway, S. E., Becker, R. H., & White, R. L. 2001, ApJ, 551, L17
- Pier et al. (2003) Pier, J. R., Munn, J. A., Hindsley, R. B., Hennessy, G. S., Kent, S. M., Lupton, R. H., & Ivezić, Ž. 2003, AJ, 125, 1559
- Perley et al. (2011) Perley, R. A., Chandler, C. J., Butler, B. J., & Wrobel, J. M. 2011, ApJ, in press
- Richards et al. (2002) Richards, G. T. et al. 2002, AJ, 123, 2945
- Sandage (1965) Sandage, A. 1965, ApJ, 141, 1560
- Schawinski et al. (2010) Schawinski, K. et al. 2010, ApJ, 711, 284
- Schlegel et al. (1998) Schlegel, D. J., Finkbeiner, D. P., & Davis, M. 1998, ApJ, 500, 525
- Schmidt (1968) Schmidt, M. 1968, ApJ, 151, 393
- Schneider et al. (2010) Schneider, D. P. et al. 2010, AJ, 139, 2360
- Stawarz (2010) Stawarz, L. 2010, in Astronomical Society of the Pacific Conference Series, Vol. 427, Accretion and Ejection in AGN: a Global View, ed. L. Maraschi, G. Ghisellini, R. Della Ceca, & F. Tavecchio, 357
- Stawarz et al. (2008) Stawarz, L., Sikora, M., & Lasota, J. 2008, in Astronomical Society of the Pacific Conference Series, Vol. 386, Extragalactic Jets: Theory and Observation from Radio to Gamma Ray, ed. T. A. Rector & D. S. De Young, 169