Cosmic rays in the surroundings of SNR G35.6-0.4
Abstract
HESS J1858+020 is a TeV gamma-ray source that was reported not to have any clear cataloged counterpart at any wavelength. However, it has been recently proposed that this source is indirectly associated with the radio source, re-identified as a supernova remnant (SNR), G35.6-0.4. The latter is found to be middle-aged ( kyr) and to have nearby molecular clouds (MCs). HESS J1858+020 was proposed to be the result of the interaction of protons accelerated in the SNR shell with target ions residing in the clouds. The Fermi Large Area Telescope (LAT) First Source Catalog does not list any source coincident with the position of HESS J1858+020, but some lie close. Here, we analyse more than 2 years of data obtained with the Fermi-LAT for the region of interest, and consider whether it is indeed possible that the closest LAT source, 1FGL J1857.1+0212c, is related to HESS J1858+020. We conclude it is not, and we impose upper limits on the GeV emission originating from HESS J1858+020. Using a simplified 3D model for the cosmic-ray propagation out from the shell of the SNR, we consider whether the interaction between SNR G35.6-0.4 and the MCs nearby could give rise to the TeV emission of HESS J1858+020 without producing a GeV counterpart. If so, the pair of SNR/TeV source with no GeV detection would be reminiscent of other similarly-aged SNRs, such as some of the TeV hotspots near W28, for which cosmic-ray diffusion may be used to explain their multi-frequency phenomenology. However, for HESS J1858+020, we found that although the phase space in principle allows for such GeV–TeV non-correlation to appear, usual and/or observationally constrained values of the parameters (e.g., diffusion coefficients and cloud-SNR likely distances) would disfavor it.
keywords:
ISM: supernova remnants1 Introduction
HESS J1858+020 is a weak gamma-ray source (1.6% Crab Flux) that was reported not to have any clear cataloged counterpart at any wavelength (Aharonian et al. 2008). HESS J1858+020 is a nearly point-like source, with a slight extension of arcmin along its major axis. Its differential spectral index is 2.2 0.1. The nearby radio source G35.6-0.4 was recently re-identified as a SNR (Green 2009). HESS J1858+020 lies towards the southern border of this remnant. Paron & Giacani (2010) have found, using the 13CO (J=1-0) line from the Galactic Ring Survey and mid-IR data from the Galactic Legacy Infrared Mid-Plane Survey Extraordinaire (GLIMPSE), that there is one or several MCs towards the southern border of SNR G35.6-0.4, likely at the same distance of the remnant (10.5 kpc). Paron & Giacani (2010) also provide estimates of the cloud’s total molecular mass and density. They report that the cloud is composed of two molecular clumps, one over the SNR shell and the other located at the center of HESS J1858+020 with a molecular mass and a density of M⊙ and cm-3, respectively. They proposed, using a simplified analytical approach described in Torres et al. (2003), that hadronic gamma-ray emission within the clouds, produced by protons diffusing away from the SNR G35.6-0.4, is a possible origin of HESS J1858+020. In a more recent paper, Paron et al. (2011) give more details about the molecular material, obtained via observations with the Atacama Submillimeter Telescope Experiment. They discovered a young stellar object (YSO), probably a high mass protostar, embedded in the molecular clump, but no evidence of any molecular outflows which might in principle reveal the presence of a thermal jet capable of generating the observed gamma-rays. Paron et al. (2011) concluded again that the most probable origin for the TeV gamma-ray emission are hadronic interactions between the molecular gas and the cosmic rays accelerated by the shock front of SNR G35.6-0.4. Here, we focus on a more in-depth analysis of this possibility.
An important ingredient to assess the latter proposal is to have an understanding of the GeV emission (if any), of the region. However, the GeV emission at the sky position of HESS J1858+020 has not been studied up to now. A look at the Fermi-LAT First Source Catalog (Abdo et al. 2010a) shows that there is no source at the position of the SNR or the H.E.S.S. source. The Fermi source 1FGL J1857.1+0212c is the closest one: it is only at 0.3o from HESS J1858+020, it is unidentified, has an error radius of 0.08o, and its spectral index is 2.31 0.04. In the 1FGL analysis there is no indication that 1FGL J1857.1+0212c is confused. The pulsar PSR B1855+02 lies close (see the map below), but no gamma-ray emission has been detected originating from it in the Fermi-LAT data (Abdo et al. 2010b). PSR B1855+02 was suggested as being possibly related with the SNR G35.6-0.4 but the association is unclear (see Green 2009 for details). The proximity of HESS J1858+020 and 1FGL J1857.1+0212c, particularly since the point spread function (PSF) of the Fermi-LAT instrument is larger than the separation of the two sky coordinates of interest, requires a careful analysis in order to evaluate the possible relations among these sources.
The case of middle-aged SNRs interacting with MCs, with the subsequent production of gamma-ray sources at GeV and/or TeV energies has also been analysed, for instance, for W51 (Abdo et al. 2009), W28 (Abdo et al. 2010e, Li & Chen 2010, Ohira et al. 2011), and IC 443 (e.g., Abdo et al. 2010f, Torres et al. 2010, see also Rodriguez Marrero et al. 2008). However, in these cases there was a GeV detection, except for two of the four TeV hotspots of the SNR W28, namely HESS J1800-230A and HESS J1800-230C for which only upper limits were imposed. These instances of GeV – TeV non-simultaneous detections around SNRs are probably the most interesting ones from a cosmic-ray viewpoint (see the discussion in Funk et al. 2008). They allow us to explore an hadronic origin of the highest-energy gamma-ray emission, through cosmic rays accelerated by the SNR shock front, which, diffusing away from it, interact with MCs at a certain distance. Given that only the most energetic protons reach the separate clouds at a given time, these cases allow us to investigate the diffusion environment in which the cosmic-ray propagation proceeds.
Section 2 is the observational core of the paper and we present there the analysis of more than 2 years of Fermi-LAT data of this region. We put special care to analyse whether a mis-localization of 1FGL J1857.1+0212c could render it coincident in projection with HESS J1828+020 and prove that this is likely not the case. We then impose upper limits to the GeV radiation at the position of HESS J1858+020. These limits are used in Section 3 to establish possible scenarios where the constraints (detection at TeV, non-detection at GeV) could be satisfied. A discussion of these results and a comparison with the similar case of SNR W28 with nearby MCs (MCs) is given at the end.
2 GeV analysis
We searched for gamma rays emitted by the HESS J1858+020 analyzing the publicly available months of Fermi-LAT data in the energy range 100 MeV - 100 GeV, from 4 Aug 2008 to 19 November 2010. The search is performed by means of the binned likelihood spectral analysis, using the official tool (gtlike) released by the Fermi-LAT collaboration (Fermi Science Tools v9r17p0). All the data, software, and diffuse models used for this analysis are available from the Fermi Science Support Center.111http://fermi.gsfc.nasa.gov/ssc/ Events from the “Pass 6 Diffuse” class were selected, i.e. the event class with the greatest purity of gamma rays, having the most stringent background rejection (see details in Atwood et al. 2009). The “Pass 6 v3 Diffuse” instrument response functions (IRFs) were applied in the analysis (Rando 2009). We selected events with energy 100 MeV in a square aligned with celestial coordinates, inscribed inside a circular region of interest (ROI) of 15∘ radius, centered on the H.E.S.S. source. The good time intervals are defined such that the ROI does not go below the gamma-ray-bright Earth limb (defined at 105∘ from the Zenith angle), and that the source is always inside the LAT field of view, namely in a cone angle of 66∘. Source detection significance is determined using the Test-Statistic (TS) value, , which compares the likelihood ratio of models including an additional source, , with the null-hypothesis of background only, (Mattox et al. 1996).
To apply the likelihood analysis, a spectral-spatial model containing diffuse and point-like sources was created. Using the 1FGL Catalog we have 93 sources closer than 20o and 5 closer than 3o from the HESS J1858+020 position. For the Galactic diffuse emission we used the spectral-spatial model “gll_iem_v02.fit”, which is the one used by the Fermi-LAT collaboration in order to build the Fermi-LAT First Source Catalog (Abdo et al. 2010a; 1FGL as referred to hereafter). The isotropic diffuse emission was modelled by the spectrum described in the “isotropic_iem_v02.txt” file. The normalization factors of these two models were left free in the fitting procedures. The spectral-spatial model also included all the point-like sources from the 1FGL list closer than 20∘ to the H.E.S.S. source. Each of those point sources was modeled with a simple power-law, with the exceptions of those sources that are known to be pulsars, for which a power-law with an exponential cut-off was used. The spectral parameters of those sources were set at the 1FGL values or those from the Fermi-LAT First Pulsar Catalog (Abdo et al. 2010b). The flux parameter of all the point-like sources closer than 3∘ to HESS 1858+020 were left free in the likelihood fit, except for the closest one, to which we pay special attention below.
Figure 1 shows the counts map of Fermi-LAT data for GeV with subtracted Galactic and isotropic diffuse emissions, in a window of 2 centered on HESS J1858+020.
2.1 Testing the hypothesis of an association with the closest Fermi source
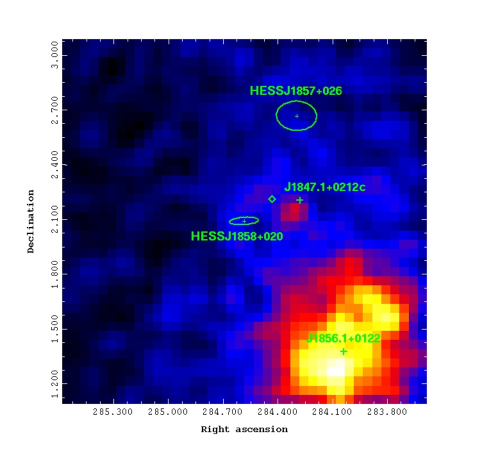
HESS J1858+020 is in the Galactic plane at coordinates l=35.578∘, b=-0.581∘ (RA=284.584∘, DEC=2.09∘, J2000) and does not spatially coincide with any source listed in the 1FGL. However, this region is crowded with gamma-ray sources. Indeed, in the spectral-spatial model created for the likelihood analysis we collected 93 Fermi-LAT sources, with 1FGL J1857.1+0212c being the closest source to HESS J1858+020. Even though the H.E.S.S. source is outside the error box of 1FGL J1857.1+0212c, an association can not be excluded a priori, because it is known that the Galactic diffuse model used to build the 1FGL catalog has the highest uncertainties on the Galactic plane, amounting to as estimated in the case of the supernova remnants W51C and W49 (Abdo et al. 2009, 2010c; see also § 4.7 of the 1FGL catalog). Furthermore, we are analyzing this region using more than 2 years of Fermi-LAT data, against the 11 months used for the 1FGL, which may induce changes in the position and fluxes of the sources in the spatial-spectral model.
To investigate the hypothesis of a possible association of 1FGL J1857.1+0212c with HESS J1858+020, we performed two likelihood analyses. In one we set in the spectral-spatial model the coordinates of 1FGL J1857.1+0212c at the 1FGL position. In the other, we set it at the position of the H.E.S.S. source. The analyses are performed setting free the flux parameters of all the point-like sources closer than 3∘ to HESS J1858+020, and modeling 1FGL J1857.1+0212c with a power-law with index and flux free. The only difference between both analyses was the assumed position of 1FGL J1857.1+0212c. This method allows testing whether the position listed in the 1FGL Catalog is sustained. In the first case we obtained a test statistic value TS=863, while in the second case, with 1FGL J1857.1+0212c displaced, we obtained TS=509. The comparison of the two TS values obtained changing the coordinates of 1FGL J1857.1+0212c suggests that the association is significantly unlikely, given that .
In order to take into account the systematics due to the uncertainties of the Galactic diffuse model, the analyses were repeated by artificially changing the normalization of the Galactic diffuse model by (see. e.g., Abdo et al. 2010d). Also in these cases, the differences of the TS values (for the putative change in position of 1FGL J1857.1+0212c) was large (), and suggests that the association is significantly unlikely. Thus, we believe we can safely entertain the hypothesis that HESS J1858+020 and 1FGL J1857.1+0212c are not associated and proceed to impose upper limits.
2.2 Upper limits
| Energy | |||
|---|---|---|---|
| (GeV) | ph cm-2s-1 | erg s-1cm-2 | erg s-1cm-2 |
| 0.10 - 1.00 | 50 | 1.85 | 0.72 |
| 1.00 - 10.00 | 6.93 | 2.56 | 1.00 |
| 10.00 - 100.00 | 0.21 | 0.76 | 0.30 |
| 0.10 | 113 | 7.33 | – |
Once the hypothesis of association is rejected, the significance of the plausible gamma-ray emission from HESS J1858+020 was evaluated by means of adding an extra source at its position in the spectral-spatial model for the likelihood analysis. We model it with a power-law. When redoing the analysis, we set free the photon index and flux parameters of HESS J1858+020, and the flux parameter of all the point-like sources closer than 3∘, with the exception of 1FGL J1857.1+0212c. As discussed above, this is the closest 1FGL source to the position of interest; and for it, we fixed all its parameters. The latter choice can be understood if one takes into account that the Fermi-LAT PSF at 1 GeV (around the peak of the LAT sensitivity) is 0.8o. If a new source is supposed to be at a smaller distance from a bright one that is already known in the spectral-spatial model, we expect that the likelihood fitting procedure will not suppress it even if fake, but will simply share the photon counts among them, resulting in a good significance (TS25) for both sources. Such case has been found, for instance, for SGR 162741 (Abdo et al. 2010d), where it was found that the high TS derived by the gtlike analysis has been caused by the presence of the rather strong unidentified source (1FGL J1636.44737), which lies at 0.12∘ from the magnetar (although as in this case, it was positionally incompatible with the magnetar).
With these settings, the HESS J1858+020 likelihood analysis always results in a 25, implying no detection. After fitting, we derived 95% flux upper limits for 100 MeV with the profile method, increasing the flux obtained for HESS J1858+020 until the maximum log likelihood decreases by 2.71/2. In the same way, the 95% flux upper limits were evaluated in three energy bins (100 GeV) fixing the photon index to 2.26 (the result of the likelihood fit is 2.26 0.13). The uncertainties of the Fermi-LAT effective area, and of the Galactic diffuse emission are the two main sources of systematics that can affect the results derived with our analysis. We estimated these systematics effects by repeating the upper limits analysis using modified instrument response functions that bracket the “Pass 6 v3 Diffuse” effective areas, and changing the normalization of the Galactic diffuse model artificially by . In addition to the evaluation of 95% flux upper limits (), we derived the energy flux upper limits (), and the SED points ().
In the same way, we have also evaluated the upper limits on the base of Helene’s Bayesian method (Helene 1983). The main difference respect the profile method is that in this case the 95% upper limits are found integrating the likelihood profile (function of the source flux ) starting from , without any assumption on its distribution. Whereas the results for the upper limits obtained with the two methods were similar, the Bayesian one gave those more conservative. The results of this analysis are reported in Table 1.
2.3 Additional checks
We additionally tested that by changing the energy threshold (from 100 to 200 MeV), the Fermi Science tools (from v9r17p0 to v9r18p6), slightly different selection cuts in gtmktime, and different number of sources in the background model (including those in a ROI with size from 10o to 20o), all results are stable. Additionally, we have repeated the analyses using an updated version of the Fermi-LAT Catalog sources, built using two years of data and thus more compatible with the data of the HESS J1858+020 region we focus upon. With this catalog (which is yet internal to the Fermi-LAT collaboration), the number of sources closer than 20o from the HESS J1858+020 source are 107, while those closer than 3o are 10. No significant change in the previous results where found. We have also considered that some of the closest sources could be extended, and also found the results to be stable. We have also re-computed the upper limits with different values of the assumed photon index and found the results to be stable too. For instance, assuming a value of 2.1 for the photon index, which is the mean value of the diffuse emission spectrum, only affects the upper limit in the highest energy bin by about 1%.
3 Models
In this Section we follow the analysis of Aharonian & Atoyan (1996) for a point-like injection, and of Li & Chen (2010) for a non-point-like injection of cosmic-rays in order to assess the hadronic production of gamma-rays in the proximity of SNR G35.6-0.4. See these references for notation and further clarifications. In addition of those cosmic-rays injected by the SNR, we also consider the contribution of diffuse Galactic protons, as measured in the Solar neighborhood (see, e.g., Dermer 1986). For the gamma-ray spectrum calculations we use the analytic photon emissivity developed by Kelner et al. (2006).
In order to apply the non-point like approach we consider that the high-resolution radio image of SNR G35.6-0.4 (Green 2010) shows an extent of 1511 arcmin2 and thus we approximate the average radius as pc using the distance of 10.5 kpc based on the proximity of the remnant with the HII region G35.5-0.0 (Paron & Giacani 2010). The remnant radius and age at the transition from the Sedov phase to the radiative phase are given by (Lozinskaya 1991):
| (1) |
respectively. If we assume the SNR explosion energy erg and the ambient gas density of order 1 cm-3, G35.6-0.4 seems to be near the transition time, of age kyr. Thus we use the Sedov (1959) law for the previous evolution of G35.6-0.4:
| (2) |
We shall adopt different values for the diffusion coefficient, taking into account the slow diffusion correction around SNRs are possible (e.g., Fujita et al. 2009, Torres et al. 2010) and an efficiency (e.g., Blandford & Eichler 1987), i.e., a total injection in cosmic-rays of erg (10% of the explosion power) along the SNR lifetime. In any case, the transition from the Sedov phase to the radiative phase is not sharp; and as usual, key parameters (such as distance, accurate radius, ambient density, and explosion energy) are uncertain. Because of this, we also explore possible fits with the simple point-like injection approach, more appropriate for the larger timescales.
3.1 Point-like injection
| kind | |||||
|---|---|---|---|---|---|
| (pc) | () | ||||
| impulsive | 27 | 2 | 0.5 | 0.08 | 0.001 |
| impulsive | 29 | 2 | 0.5 | 0.16 | 0.001 |
| impulsive | 31 | 2 | 0.5 | 0.28 | 0.001 |
| impulsive | 33 | 2 | 0.5 | 0.39 | 0.001 |
| impulsive | 40 | 2 | 0.5 | 3.36 | 0.01 |
| impulsive | 50 | 2 | 0.5 | 6.05 | 0.01 |
| impulsive | 60 | 2 | 0.5 | 8.40 | 0.01 |
| impulsive | 70 | 2 | 0.5 | 12.61 | 0.01 |
| impulsive | 120 | 2 | 0.5 | 168 | 0.1 |
| impulsive | 130 | 2 | 0.5 | 220 | 0.1 |
| impulsive | 140 | 2 | 0.5 | 280 | 0.1 |
| impulsive | 150 | 2 | 0.5 | 388 | 0.1 |
| continuous | 25.5 | 2 | 0.5 | 0.04 | 0.001 |
| continuous | 26.5 | 2 | 0.5 | 0.06 | 0.001 |
| continuous | 27.5 | 2 | 0.5 | 0.07 | 0.001 |
| continuous | 28.5 | 2 | 0.5 | 1.00 | 0.001 |
| continuous | 35 | 2 | 0.5 | 1.7 | 0.01 |
| continuous | 40 | 2 | 0.5 | 2.2 | 0.01 |
| continuous | 50 | 2 | 0.5 | 2.8 | 0.01 |
| continuous | 55 | 2 | 0.5 | 3.9 | 0.01 |
| continuous | 40 | 2 | 0.5 | 12 | 0.1 |
| continuous | 50 | 2 | 0.5 | 20 | 0.1 |
| continuous | 60 | 2 | 0.5 | 30 | 0.1 |
| continuous | 70 | 2 | 0.5 | 40 | 0.1 |
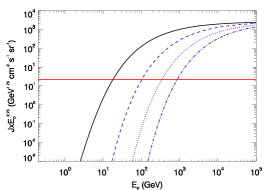
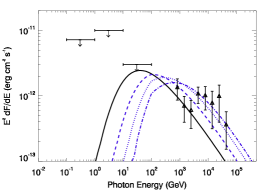
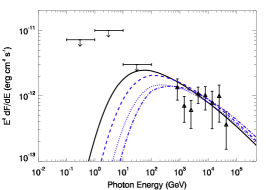
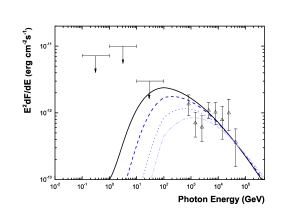
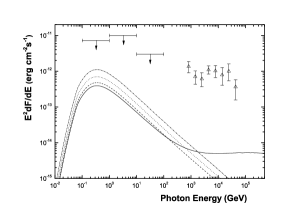
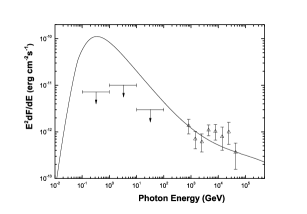
We first adopt the point-like injection approximation and analyse which are the possible combinations of parameters, if any, which would show the GeV–TeV phenomenology seen. Figure 2 shows some examples of these cases. In the first place, we show the resulting SED in the gamma-ray domain for a point-like impulsive cosmic-ray injection, of 1050 erg. The accelerator is placed at the center of the SNR G35.6-0.4, and the SED is the result of the interaction of the diffusing cosmic rays with the molecular material, assumed to be located in a cloud at a separate position. Table 2 and the top panels of Figure 2 summarize the results. The diffusion coefficient is assumed to be in the form of a power-law in energy (see, e.g., Aharonian & Atoyan 1996) where is the correction factor for slow diffusion around the SNR (e.g., Fujita et al. 2009) and –0.7 (e.g., Berezinskii 1990). The value is referred to as below. To simplify, we have adopted a fiducial value for the slope of the injected cosmic-ray spectrum , and , since other values within the corresponding typical phase space of these parameters do not change our conclusions. Instead, we show results for different values of , from to 1027 cm2 s-1. We see that the higher the value of the more important becomes the contribution of the cosmic-ray sea with respect to that of the accelerator. This happens because in order to have a reasonably good fit to the GeV–TeV data, we need larger values of SNR-MC separation and MC masses. The latter cannot attain any needed value, of course, but it is constrained to be less than the measured one in the region, which is of the order of M⊙ (Paron & Giacani 2010). In addition, the separation cannot be arbitrarily large, since, unless the clouds are significantly in the foreground or background of the accelerator –which admittedly may well be the case– the projected distance would be larger than measured. The projected distance of the MC to the SNR center is pc. These constraints exclude most models with an impulsive injector and cm2 s-1. A value of cm2 s-1 with an impulsive injection from the SNR is untenable, for instance, since it would require two orders of magnitude more molecular material than available. For the largest (top panel, right), even considering unrealistic masses and distance, the model fits for large separations are above the upper limits and seem inadequate. Reasonably good fits, i.e., resulting in separation and MC masses in agreement with measurements, and within the assumptions made, would require a very low value of the diffusion coefficient. Such values of , representing a very slow diffusion, have been used for instance by Gabici et al. (2007), but it is likely that they require a much denser cloud to be feasible.
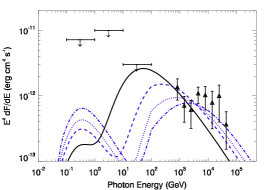
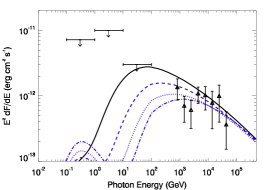
In Figure 2 and Table 2 we also show several examples of the resulting SED for a continuous injection of 1.17 erg s-1 (totalizing 1050 erg in the lifetime of the SNR) with the accelerator also located at the SNR center. Again, reasonably good fits can only be obtained with low values of , up to 1026 cm2 s-1. Values of the needed molecular mass in interaction with the cosmic-ray population increases with , but in this case, values up to cm2 s-1 are able to produce a good fit, whereas higher ones would require masses beyond those measured.
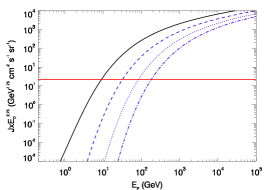
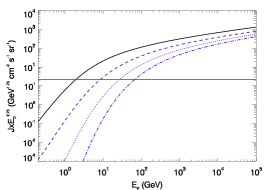
In Figure 3 we show the cosmic-ray spectrum at the position of HESS J1858+020 resulting from the point-like models of Figure 1, as compared with the cosmic-ray sea. From left to right, we plot the cases with and 0.1, using the same color coding and parameters as those presented in Figure 1 and Table 2. The only solutions that may be in agreement with the total molecular mass measured in this environment correspond to the leftmost top panel, and the two leftmost bottom panels in this figure. The particles injected by the accelerator dominate the cosmic-ray sea for energies above 10 GeV in these cases, and quickly overcome it by several orders of magnitude for higher energies.
We note however that the caveat of this analysis might be in its point-like assumption. The size of the SNR shell, and position of the cloud with respect to the center of the SNR are comparable, and it is thus an approximation to consider this setup. In order to explore further this environment, especially for the continuous injection, we apply the cumulative diffusion model to explore the range of parameters with which the source HESS J1858+020 could be associated with the newly identified SNR G35.6-0.4 leaving a non-detection at GeV energies when the SNR is no longer assumed to be point-like.
3.2 Non point-like injection
The way in which the cosmic-ray spectrum is constructed in the cumulative model is different from the more direct point-like approach. In the cumulative model, we are adding contributions coming from different distances, and thus diffusing differently. This is especially important when the MC is indeed close to the SNR shell. In this case the cosmic rays entering the cloud arrive from distances that span from a few to tens of pc (for those coming from the other side of the shell).
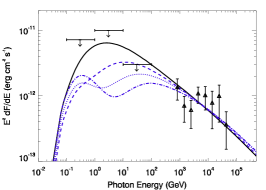
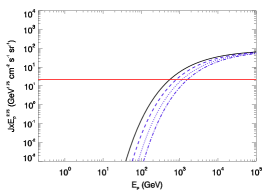
With these SNR parameters, the GeV–TeV data of HESS J1858+020 are fitted (as plotted in Figure 4) and the resulting parameters are listed in Table 3. To compare with the former case, we have adopted an initial spectral index of escaping protons, , predicted by the classic Fermi-type acceleration process, and . We have also explored steeper values of to fit the gamma-ray spectrum of this source so as to study the parameter dependence. For -values equal to 2.1 or 2.2, the needed would decrease a little in the range 0.3–0.5 to better fit the spectral data, while the lower limit of would still be at 40–60 pc. Higher values of , e.g., 2.4 and beyond, would produce , which is unreasonable for the cosmic-ray diffusion process.
| kind | |||||
|---|---|---|---|---|---|
| (pc) | () | ||||
| 3D | 22 | 2 | 0.5 | 1.1 | 0.001 |
| 3D | 23 | 2 | 0.5 | 1.1 | 0.001 |
| 3D | 24 | 2 | 0.5 | 1.2 | 0.001 |
| 3D | 25 | 2 | 0.5 | 1.6 | 0.001 |
| 3D | 30 | 2 | 0.5 | 6.7 | 0.01 |
| 3D | 35 | 2 | 0.5 | 8.2 | 0.01 |
| 3D | 40 | 2 | 0.5 | 12 | 0.01 |
| 3D | 45 | 2 | 0.5 | 19 | 0.01 |
| 3D | 50 | 2 | 0.5 | 70 | 0.1 |
| 3D | 60 | 2 | 0.5 | 80 | 0.1 |
| 3D | 70 | 2 | 0.5 | 100 | 0.1 |
| 3D | 80 | 2 | 0.5 | 120 | 0.1 |
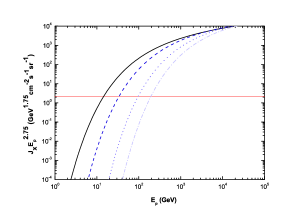
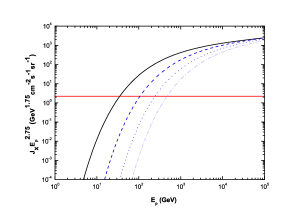
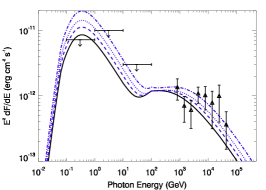
The fitting results for and 0.1 are shown in Figure 3. As expected, among the fitted parameters, the MC mass () and the distance from the SNR center to the MC () decrease when the value is reduced. In the higher end for the diffusion coefficient (), the fitted value should be in the range of 50 pc to 80 pc. But also for the 3D model it can be noted that the MC mass required for is of order M☉, which significantly conflicts with the observed value. In the more realistic 3D model, also the case with cm2 s-1 requires a mass beyond the one measured, by a factor of or more if the clouds are more distant. On the other hand, in the lower end of (), the distance from the SNR center to the MC is quite similar to the SNR radius itself ( pc), implying that the MC is essentially at the end of the shock front, which actually could be argued from the projected maps of Paron & Giacani (2010). Thus we find that in order for a hadronic origin of the gamma-ray emission seen be viable, the diffusion coefficient near this SNR should be greatly suppressed with respect to the average Galactic value, by more than one order of magnitude.
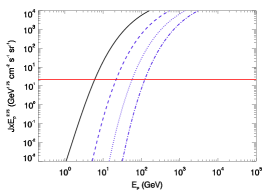
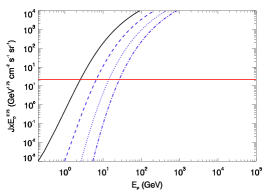
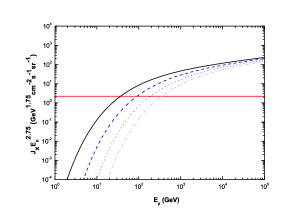
Figure 5 shows the results for the cosmic-ray spectrum. Note especially the differences at the lowest value of , the leftmost panel, when compared with the point-like injection. The 3D analyses more realistically describes the obtained data at GeV and TeV energies, with a much lower enhancement of cosmic rays in the region; about a factor of 100 beyond the cosmic-ray sea level at 1 TeV and a crossing at 10–100 GeV.
3.2.1 An energy-independent diffusion?
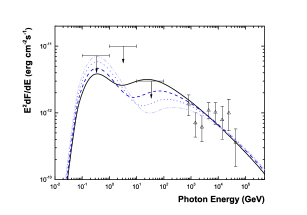
We checked whether the case of an energy-independent diffusion, i.e. , can provide a good fit. To do that we have used the same parameters (except for ) as those shown in Table 3 to explore their matching to the multi-wavelength data. As an example, results for and 0.01 are shown in Figure 6. Additionally, we have also set other parameters free (apart from fixing ) to fit the H.E.S.S. data and the Fermi-LAT upper-limits: For instance, in order to fit the H.E.S.S. data with gamma-ray index , the proton spectrum index should also be 2.2 if . The right panel of Figure 6 shows the case for =30 pc, , , M⊙, and , which matches the H.E.S.S. data, at the price of unavoidably violating the Fermi-LAT upper-limits. The required MC mass would be much larger than the one measured in the region, and the model is already ruled out by this. A spectral break between GeV and TeV is needed to fit the spectral data, which can be naturally produced by an energy-dependent diffusion model.

4 Discussion
The GeV counterparts of some unidentified very high-energy sources have been searched by Fermi-LAT and some of them show spectral breaks between the GeV and the TeV band (e.g. HESS J1834-087/HESS J1804-216), which may imply that the spectra cannot be treated as a single emission component (Tam et al. 2010). These scenarios have been studied earlier by Funk et al. (2008), using EGRET data. The very faint X-ray emission of these unidentified sources indicates that, unless evolved pulsar wind nebulae, these sources are likely not gamma-ray emitters themselves, and cosmic-ray diffusion origins such as the one explored in this paper could be a possible alternative.
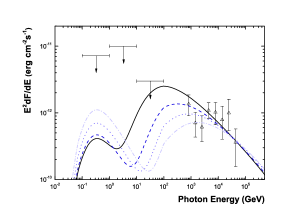
The cumulative diffusion model predicts concave gamma-ray spectra, in which two peaks are present. The one at the lowest energies is attributed to the diffuse Galactic protons, while the one at the highest energies, and putatively responsible for the emission detected from HESS J1858+020 is attributed to the accelerated protons that escaped from the nearby SNR G35.6-0.4. It can be seen that the high-energy emission peak shifts to higher energies when the distance between the SNR and the cloud increases. Therefore, accelerator-illuminated gamma-ray sources, which have the property of being TeV bright but GeV faint, can be explained by diffusion effects. Such a scenario was applied, for e.g., by Li & Chen (2010) to explain the gamma-rays of the four sources in the SNR W28 field. In W28, four gamma-ray sources with various GeV and TeV brightnesses are accounted for by assuming different distances from the SNR center. HESS J1858+020/SNR G35.6-0.4 might in principle be another case of such generic phenomenology.
In this paper we have studied HESS J1858+020 at GeV energies, while considering its possible association to the radio source, recently re-identified as a SNR G35.6-0.4. The latter is found to be middle-aged ( kyr) and has nearby MCs (Paron & Giacani 2010). The Fermi-LAT First Source Catalog did not list any source coincident with the position of HESS J1858+020, but the closest Fermi-LAT source, 1FGL J1857.1+0212c, could have in principle been associated to it. A detailed analysis of 2 years of Fermi-LAT data disfavors this association, and we have imposed upper limits to the GeV emission from the region of interest. Using both, a point-like and 3D models for the cosmic-ray injection and propagation out from the shell of the SNR, we consider whether the interaction between SNR G35.6-0.4 and the MCs nearby could give rise to the TeV emission of HESS J1858+020 without producing a GeV counterpart. We have found that although the phase space in principle allows for such a situation to appear, usual and/or observationally constrained values of the parameters (e.g., diffusion coefficients and cloud-SNR shell distance) would disfavor it. Specifically, at the currently assumed distance of SNR G35.6-04 and the MC complex, the diffusion coefficient near this SNR should be greatly suppressed with respect to the average Galactic value, by more than one order of magnitude, in order for the gamma-ray phenomenology detected to be a viable outcome of the three hadronic models considered here. This may be possible, and such cases have earlier been considered in the literature, but the size and density of this particular cloud may be too low to generate such a slow diffusion timescale.
Acknowledgments
This work was supported by the grants AYA2009-07391 and SGR2009-811, as well as the Formosa Program TW2010005. AC is a member of the Carrera del Investigador Científico of CONICET, Argentina. YC acknowledges support from the NSFC grant 10725312 and the 973 Program grant 2009CB824800. We thank M. Lemoine-Goumard and S. Digel for comments. The Fermi-LAT Collaboration acknowledges generous ongoing support from a number of agencies and institutes that have supported both the development and the operation of the LAT as well as scientific data analysis. These include the National Aeronautics and Space Administration and the Department of Energy in the United States, the Commissariat à l’Energie Atomique and the Centre National de la Recherche Scientifique / Institut National de Physique Nucleaire et de Physique des Particules in France, the Agenzia Spaziale Italiana and the Istituto Nazionale di Fisica Nucleare in Italy, the Ministry of Education, Culture, Sports, Science and Technology (MEXT), High Energy Accelerator Research Organization (KEK) and Japan Aerospace Exploration Agency (JAXA) in Japan, and the K. A. Wallenberg Foundation, the Swedish Research Council and the Swedish National Space Board in Sweden. Additional support for science analysis during the operations phase is gratefully acknowledged from the Istituto Nazionale di Astrofisica in Italy and the Centre National d’Études Spatiales in France.
References
- (1) Abdo, A. A. et al., 2009, ApJL, 706, 1
- (2) Abdo, A. A. et al. 2010a, ApJS, 188, 405
- (3) Abdo, A. A. et al. 2010b, ApJS, 187, 460
- (4) Abdo, A. A. et al. 2010c, ApJ, 722, 1303
- (5) Abdo, A. A. et al. 2010d, ApJL, 725, L73
- (6) Abdo, A. A. et al. 2010e, ApJ, 718, 348
- (7) Abdo, A. A. et al. 2010f, ApJ, 712, 459
- Aharonian et al. (2008) Aharonian, F. A., et al. 2008, A&A, 477, 353
- (9) Aharonian, F. A., & Atoyan, A. M. 1996, A&A 309, 917
- (10) Atwood, W. B. et al. 2009, ApJ 697, 1071
- (11) Berezinskii, V. S., Bulanov, S. V., Dogiel, V. A., & Ptuskin, V. S. 1990, Amsterdam: North-Holland, 1990, edited by Ginzburg, V.L..
- (12) Dermer, C. D. 1986, A&A 157, 223
- (13) Li H., & Chen, Y. 2010, MNRAS 409, L35
- (14) Fujita, Y., Ohira, Y., Tanaka, S. J., & Takahara, F. 2009, ApJL 707, L179
- (15) Funk, S., Reimer, O., Torres, D. F., & Hinton, J. A. 2008, ApJ, 679, 1299
- (16) Gabici S., Aharonian F. A., & Blasi P. 2007, Astrophysics and Space Science 309, 365
- (17) Gabici, S., Aharonian, F. A., & Casanova, S. 2009, MNRAS, 396, 1629
- (18) Gaisser T. K. 1990, Cosmic Rays and Particle Physics, Cambridge University Press, Cambridge, UK
- (19) Gaisser T. K., Schaefer R. K., 1992, ApJ, 394, 174
- (20) Ginzburg V. L., Syrovatskii S. I. 1964, “The Origin of Cosmic Rays”, Pergamon Press, London
- (21) Green, D .A. 2010, MNRAS, 399, 177
- (22) Helene O. 1983, NIMPR, 212, 319H
- (23) Lozinskaya, T. A. 1991, Supernovae and Stellar Wind in the Interstellar Medium
- (24) Mattox, J. R., et al. 1996, ApJ, 461, 396
- Ohira et al. (2011) Ohira, Y., Murase, K., & Yamazaki, R. 2011, MNRAS, 410, 1577
- Ormes et al. (1988) Ormes, J. F., Ozel, M. E., & Morris, D. J. 1988, ApJ, 334, 722
- (27) Paron, S. & Giacani, E. 2010, A&A 509, L4
- (28) Paron, S., Giacani E., Rubio M. & Dubner G. 2011, arXiv 1103.5742
- (29) Rando, R. 2009 [arXiv:0907.0626]
- (30) Rodríguez Marrero A. Y., Torres D. F., de Cea del Pozo E., Reimer O., & Cillis A. 2008, ApJ, 689, 213
- (31) Sedov, L. I. 1959, Similarity and dimensional methods in mechanics (New York: Academic)
- (32) Tam P. H. T., Wagner S. J., Tibolla O., & Chaves R. C. G. 2010, A&A 518, 8
- (33) Torres D. F., Rodríguez Marrero A. Y. and de Cea del Pozo E. 2010, MNRAS 408, 1257
- (34) Torres D. F. et al., 2003, Phys. Rep., 382, 303