Quantitative aspects of L-type Ca2+ currents
Abstract
currents in neurons and muscle cells have been classified as being one of 5 types of which four, L, N, P/Q and R were said to be high threshold and one, T, was designated low threshold. This review focuses on quantitative aspects of L-type currents. L-type channels are now distinguished according to their structure as one of four main subtypes - . L-type calcium currents play many fundamental roles in cellular dynamical processes including pacemaking in neurons and cardiac cells, the activation of transcription factors involved in synaptic plasticity and in immune cells. The half-activation potentials of L-type currents () have been ascribed values as low as -50 mV and as high as near 0 mV. The inactivation of has been found to be both voltage (VDI) and calcium-dependent (CDI) and the latter component may involve calcium-induced calcium release. CDI is often an important aspect of dynamical models of cell electrophysiology. We describe the basic components in modeling including activation and both voltage and calcium dependent inactivation and the two main approaches to determining the current. We review, by means of tables of values from over 65 representative studies, the various details of the dynamical properties associated with that have been found experimentally or employed in the last 25 years in deterministic modeling in various nervous system and cardiac cells. Distributions and statistics of several parameters related to activation and inactivation are obtained. There are few reliable experimental data on L-type calcium current kinetics for cells at physiological calcium ion concentrations. Neurons are divided approximately into two groups with experimental half-activation potentials that are high, -18.3 mV, or low, -36.4 mV, which correspond closely with those for and channels in physiological solutions. There are very few experimental data on time constants of activation, those available suggesting values around 0.5 to 1 ms. In modeling, a wide range of time constants has been employed. A major problem for quantitative studies due to lack of experimental data has been the use of kinetic parameters from one cell type for others. Inactivation time constants for VDI have been found experimentally with average 65 ms. Examples of calculations of are made for linear and constant field methods and the effects of CDI are illustrated for single and double pulse protocols and the results compared with experiment. The review ends with a discussion and analysis of experimental subtype ( - ) properties and their roles in normal, including pacemaker activity, and many pathological states.
Keywords: L-type calcium currents, neuronal modeling, calcium-dependent inactivation
*Email address: tuckwell@mis.mpg.de
Abbreviations: AHC, auditory hair cells; AM, atrial myocyte; B, Brugada syndrome; BAPTA, 1,2-bis (2-aminophenoxy) ethane--tetra-acetic acid; BK, big potassium channel; , , internal calcium ion concentration; , , external calcium ion concentration; CDI, calcium-dependent inactivation; CH, chromaffin; CICR, calcium-induced calcium release; CORT, cortical; DA, dopamine; DCN, dorsal cochlear nucleus; DRG, dorsal root ganglion; dors, dorsal; DRN, dorsal raphe nucleus; EGTA, ethylene glycol (-amino-ethyl ether)--tetra-acetic acid; GABA, gamma-aminobutyric acid; HEK, human embryonic kidney; HVA, high-voltage activated; IC, inferior colliculus; KO, knockout; LD, laterodorsal; LVA, low-voltage activated; Mag, magnocellular; MR, medullary respiratory; med, medial; MID, midbrain; MN, motoneuron; N, neuron; NRT, nucleus reticularis thalami; PC, pituitary corticotroph; PF, Purkinje fiber; PM, pacemaker; RF, renal failure; SA, sino-atrial; SE, serotonergic; SH3-GK, src homology 3 - guanylate kinase; SK, small potassium channel; SM, skeletal muscle; SMM, smooth muscle; SN, substantia nigra; SNc; substantia nigra pars compacta; SON, supraoptic nucleus; SS, disulphide bond; SYMP, sympathetic; TR, thalamic relay; VDI, voltage-dependent inactivation; VM, ventricular myocyte; VWA, Von Willebrand Factor A; WT, wild-type.
1 Introduction
1.1 Perspective
The passage of ions across cell membranes, and within cells, is of fundamental importance in determining the electrophysiological responses of nerve and muscle cells. Such responses are manifested ultimately in the functioning of the nervous and muscular systems, including organs of crucial biological importance such as the heart and brain. In the late 19th and early 20th centuries, key discoveries were made and biophysical theories proposed concerning such ionic currents, for example by Nernst (1889), Planck (1890) and Bernstein (1902). With new electrophysiological recording techniques, many advances were made in the 1940’s and 1950’s by, amongst others, in alphabetical order, Eccles, Hodgkin, Huxley and Katz - see Huxley (1959) for a summary. In the 1970’s and 1980’s, much additional insight was obtained when recordings were made of currents through single ion channels, notably by Neher and Sakmann (Hamill et al., 1981). In the last 20 or so years there has been an enormous number of discoveries concerning the factors which determine ionic current flows in neurons and muscle cells. The present review concerns modeling aspects of the class of calcium currents called L-type, which, as will be seen below, have many consequences beyond electrophysiology.
For graphic but brief historical accounts of calcium current discoveries see Tsien and Barrett (2005) and Dolphin (2006). According to the former review, “…it is apparent that channels have reached the forefront of the field of ion channel research…due to their vital role in cellular signaling, their diversity, and great susceptibility to modulation…”. Records of the first single channel recording of currents identified as being L-type were given in (Nowycky et al., 1985). More recent single channel recordings are in Cens et al. (2006), where a comparison of results for and as charge carrier is shown, and Schröder et al. (1998), where the much greater magnitude of L-type currents in failing heart are compared with those in normal heart.
The principal motivation for the analysis and quantitative modeling of L-type calcium currents is that they occur in most nerve and muscle cells. They often play basic roles in pacemaker activity (see Section 5.2) and more generally in regulating spike frequency by inducing afterhyperpolarization, as for example in the hippocampus by coupling to SK channels (Tanabe et al.,1998). Wu et al. (2008) showed that L-type current in CA1 pyramidal cells, by coupling to delayed rectifier potassium channels (Kv7.x), can give rise to long-lasting changes in adaptation.
Comprehensive models of nerve cells may include spatial variations or not, but in either case the minimum number of current components is at least 10 and amongst these there should or will usually be included several currents. If they are included in a model, L-type currents require a careful treatment and our aim here is to attempt to summarize several details of their basic properties and modeling which have been employed for many kinds of nerve and muscle cell.
1.2 Ion channels and neurons
Many protein molecules are embedded in the cell membranes of neurons. Some of these molecules are receptors for the main central neurotransmitters glutamate (excitatory) and GABA (inhibitory), as well as transmitter/modulators such as noradrenaline, dopamine, and serotonin all of which are released from vesicles in response to signals arriving at synapses where neighboring cells make close contact. (See for example Cooper et al. (2003) for an introduction to basic neurochemistry and neuropharmacology.) Of particular importance in determining the way in which a neuron behaves in response to electrical and chemical stimuli are other protein molecules which serve as entrance and exit pathways for electrically charged ions. Such molecules are called ion channels.
If an ion channel is relatively more selective for a certain kind of ion, for example, sodium, , then it is called a sodium channel. The most commonly occurring cation channels in neurons are sodium, potassium and calcium. Such ion channels may be open or closed, which means they may or may not permit the passage of ions through them. One of the chief consequences of the ionic currents which flow through such channels when they are open is the alteration of the electrical potential difference across the cell membrane. In the resting state, this potential difference is in the approximate range from -80 mV to -50 mV. An inward flux of positive ions such as or leads to a diminution of the potential difference, called depolarization or excitation, which, if sufficiently strong, may give rise to an action potential or spike. When the membrane is depolarized, ion channels such as those of undergo conformational changes which lead to their opening for certain time intervals. Hence they are called voltage-gated ion channels.
1.2.1 Activation and inactivation
The process of opening the channel is called activation. However, channels may be in several different states because often there is also a process of inactivation which is not simply the cessation of activation. For a channel to be conducting, the inactivation component must be switched off and the activation component switched on. If we denote the probability of activation being on by (for example) and the probability of inactivation being off as , then Table 1 gives the various channel states and their probabilities. It will be seen that the sum of the probabilities in the third column of the table add to unity, as they must. For more details, see, for example, texts such as Levitan and Kaczmarek (1997) or Koch (1999).
| Activation process | Inactivation process | Probability | Conducting state |
|---|---|---|---|
| Off (deactivated) | On (inactivated) | Non-conducting | |
| On (activated) | On (inactivated) | Non-conducting | |
| On (activated) | Off (de-inactivated) | Conducting | |
| Off (deactivated) | Off (de-inactivated) | Non-conducting |
In the case of voltage-gated ion channels, the activation and inactivation probabilities usually depend on voltage and time. Hence if denotes membrane potential and denotes time, then and . As in the pioneering work of Hodgkin and Huxley (1952) on squid axon, the activation and inactivation variables satisfy approximately differential equations whose solution enables one to predict reasonably accurately the ion currents flowing across nerve or other membrane. This is further elaborated on in Section 2.3.
1.3 Voltage-gated calcium channels
Calcium currents, which are found in all excitable cells, were divided into the two main groups of low-threshold or low-voltage activated (LVA) and high-threshold or high-voltage activated (HVA). The former group contains the T-type (T for transient) and the latter group consists of the types L, N, P/Q and R (L for so called long-lasting, N, either for neither T nor L, or neuronal, P for Purkinje, and R for resistant). For interesting reviews of the history of the discoveries of these various types and the experiments that preceded them, back to 1953, see Tsien and Barrett (2005) and Dolphin (2006).
Although L-type currents, the main topic of the present article, were originally designated as belonging to the HVA group, their properties are diverse (Avery and Johnston, 1996; Lipscombe, 2002), varying greatly with cell-type and ionic environment - see the data below and in particular the review of Lipscombe et al. (2004). They have been implicated as playing an important role in pacemaker activity in some neurons and cardiac cells (see for example, Kamp and Hell, 2000; Mangoni et al., 2003; Brown and Piggins, 2007; Marcantoni et al., 2007; Putzier et al., 2009a, b; Vandael et al., 2010) and being involved in the amplification of certain synaptic inputs (Bui et al., 2006).
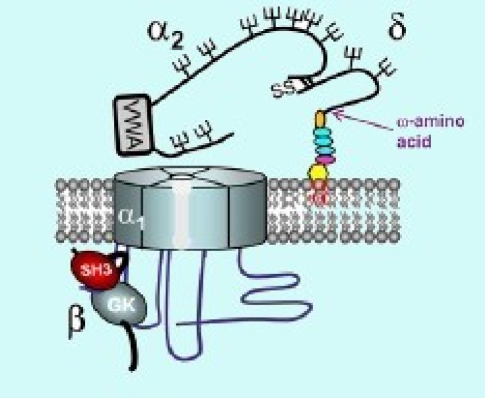
Calcium channel molecules have up to four subunits, , -, and , which may exist in different forms, and which modulate the conductance and dynamical properties of the channel (Dolphin, 2006, 2009; Davies et al., 2010). The ten forms of the conducting pore subunit, , lead to an expansion of the above groups (Catterall et al., 2005; Dolphin, 2009) to 10 main subtypes. According to the accepted nomenclature, L-type channels consist of the subtypes . The remaining “high-threshold” currents, P/Q, N and R are respectively - and the T-current subtypes are . Of the L-channel subtypes, sub-type is mainly found in skeletal muscle and the subtype is found mainly in retinal cells (Lipscombe et al., 2004; Baumann et al., 2004; Catterall et al. 2005; Lacinová, 2005; Dolphin, 2009; Weiergräber et al., 2010). In cardiac myocytes and most central nervous system cells the subtypes are mainly or . See subsection 5.1 for further discussion.
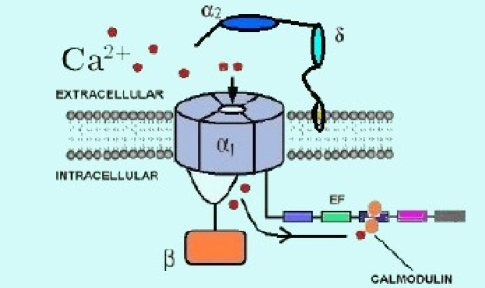
In Figure 1 is shown a recent schematic representation of the molecular structure of a voltage-gated calcium channel, showing the subunits , and . Note that until recently the subunit had been thought to straddle the membrane rather than project into the extracellular compartment (Bauer et al., 2010; Dolphin, 2010). Figure 2 schematically depicts some of the structures involved in the important phenomenon of calcium-dependent inactivation, which is elaborated upon in Section 2.
Since there are several different types of calcium currrent, and in particular high threshold ones, whose current-voltage relations are not completely distinguishing, in order to identify them, pharmacological methods are used. Each channel type/subtype, acts as a receptor for specific molecules, most often toxins, leading to reduced calcium current. In some cells, R-type currents, once thought not to have a specific blocker and which are borderline between HVA and LVA, have been more recently found to be blocked by the tarantula toxin SNX-482 (Li et al.,1997; Newcomb et al.,1998). Table 2, adapted from Striessnig and Koschak (2008) and Catterall et al. (2005), summarizes the main agents used for blocking or partially blocking the various types/subtypes. Note, however, that dihydropyridines, phenylalkylamines and benzothiazepines block all L-type channels to some degree.
to identify various types/subtypes
| Type | Subtype by | Agent (Example) |
|---|---|---|
| subunit | ||
| L | Dihydropyridines (Nifedipine) | |
| Phenylalkylamines (Verapamil) | ||
| Benzothiazepines (Diltiazem) | ||
| P/Q | -Agatoxin IVA | |
| N | -Conotoxin-GVIA | |
| R | SNX-482 | |
| T | Kurtoxin | |
It is noteworthy that one of the most important areas in which the quantitative study of L-type (and other) currents plays a fundamental role is in the electrophysiology of the heart. In medicine, L-type calcium currents are the prime target of important calcium channel blockers such the benzothiazapine diltiazem, the phenylalkylamine verapamil and the dihydropyridines such as nifedipine, which are used to treat, inter alia, hypertension, angina and cardiac arrhythmias.
Within the above subtypes, various configurations of other subunits lead to channels, with quite different properties (Dolphin, 2009; Catterall, 2010). Thus, L-type variants may have differing current magnitudes and pharmacology (Andrade et al., 2009). One cannot therefore ascribe definite parameters in the dynamical description of L-type calcium currents based on the subtypes . For example, the subunit regulates current density (defined, for example, as current per unit area) and the properties of activation and inactivation. There are four forms of the subunit, and being highly expressed in the brain (Dolphin, 2003).
1.3.1 A brief background and useful references
It has become apparent that quantitative descriptions of L-type calcium currents are often a fundamental component in computational modeling of neuronal and muscle cell dynamics. The first descriptions of L-type current dynamics in such a context appear to be those of Belluzzi and Sacchi (1991) and McCormick and Huguenard (1992), although there had been many models containing calcium currents, prior to the division into the above types, for example for cardiac cells. In fact Belluzzi and Sacchi’s (1991) model for a sympathetic neuron in the rat superior cervical ganglion described a high-threshold current which had an inactivation similar to the L-type of Fox et al. (1987) but an activation similar to the N-type current.
For an introduction to fundamentals about ion channels see, for example, Levitan and Kaczmarek (1997). Additional reviews on voltage-dependent -channels pertaining to their molecular structure, nomenclature and function, including modulation and regulation are contained in, for example, in chronological order, Tsien et al. (1988), Bean (1989), Tsien and Tsien (1990), Anwyl (1991), Catterall (1995), De Waard et al. (1996), Jones (1998), Hofmann et al. (1999), Catterall (2000), Ertel et al. (2000), Kamp and Hell (2000), Lacinová (2005), Zamponi (2005) and Catterall (2010). Reviews addressing specific related topics include those on synaptic transmission (Meir et al., 1999; Neher and Sakaba, 2008), T-type currents (Perez-Reyes, 2003; Cueni et al., 2009), calcium-dependent inactivation in neurons (Budde et al., 2002), dynamics of calcium signaling in neurons (Augustine et al., 2003), models of calcium sparks and waves (Coombes et al, 2004), L-type currents in the heart (Bodi et al., 2005), the role of calcium currents in circadian rhythms (Brown and Piggins, 2007), calcium release and the roles of ryanodine receptors in heart and skeletal muscle diseases (Zalk, 2007), channels in chromaffin cells (Marcantoni et al., 2008) and calcium dynamics in relation to absence epilepsy (Weiergräber et al. 2010). Calcium ion influx through L-type channels leads via various signaling pathways to the activation of transcription factors such as CREB and hence the expression of genes that are essential for synaptic plasticity and other important cellular processes (Dolmetsch et al., 2001; Hardingham et al., 2001; Mori et al., 2004; Power and Sah, 2005; Satin et al., 2011). The role of calcium ion influx through L-type channels in immune cells has also been recently reviewed (Suzuki et al. 2010). It was also recently demonstrated that calcium currents of L-type, together with R-type, are involved in the activation of SK channels, which attenuate excitatory synaptic transmission in pyramidal cells of the medial prefrontal cortex (Faber, 2010).
Mathematical modeling of the electrophysiology of cardiac cells has a history spanning nearly the last 50 years - see for example DiFrancesco and Noble (1985) - and reviews by Noble (1995), Wilders (2007), Fink et al. (2011) and Williams et al. (2010). Brette et al. (2006) reviews background physiology and biophysics of calcium currents in cardiac cells. The modeling has taken into account details of the dynamics of several ionic currents, particularly calcium currents (as for example in Luo and Rudy, 1994). For a discussion of the dynamics underlying the large difference between the relatively short action potential duration in neurons and heart cells, see Boyett et al. (1997). In ventricular cardiomyocytes L-type calcium currents play a pivotal role (Benitah et al., 2010) although T-type currents, important in development and in some pathologies (Ono and Iijima, 2010) are also present (Bean, 1989) and play a role in pacemaker activity (Bers, 2008). L-type channels, located in the sarcolemma, are involved in arrythmias, and are activated by depolarization and inactivated by both voltage-dependent and intracellular mechanisms. The inactivation of L-channels, which is elaborated upon below, is complex, not only in cardiac cells, and not completely understood (Imredy and Yue, 1994; Findlay et al. 2008; Grandi et al., 2010). See also Lacinová and Hofmann (2005) and the review of mechanisms of calcium and voltage-dependent inactivation in Cens et al. (2006). The website of David Yue (Calcium signals lab) http://web1.johnshopkins.edu/csl/ contains a wealth of information about calcium dynamics.
In the electrophysiology of neurons and muscle cells, calcium currents usually have crucial roles. Hence there is the need to represent as accurately as possible, in mathematical or computational modeling, calcium entry into cells along with related processes, such as buffering and pumping. The latter two topics are not explored in depth here, but see for example Standen and Stanfield (1982), Blaustein (1988), Tsien and Tsien (1990), McCormick and Huguenard (1992), Tank et al. (1995), Lindblad et al. (1996), Blaustein and Lederer (1999), Stokes and Green (2003), Shiferaw et al. (2003), Rhodes and Llinás (2005), Roussel et al. (2006), Higgins et al. (2007), Friel and Chiel (2008) and Brasen et al. (2010).
2 Quantitative description of L-type Ca2+ currents
We are here concerned with deterministic approaches that have been employed in the quantitative description of L-type currents. Such descriptions are probably adequate in many preparations although it has not been found to be the case for high rates of action potentials in cardiac myocytes, where a many-state Markov chain model, used in conjunction with the constant field method (Mahajan et al, 2008), was found to be more accurate. See also Jafri et al. (1998), Sun et al. (2000), Fink et al. (2011), Grandi et al. (2010) and Williams et al. (2010) for more details on the Markov chain approach for determining L-type channel-open probabilities. Destexhe and Sejnowski (2001) contains a brief introduction to such models, especially for voltage-dependent sodium channels. As far as can be discerned, until now there have been no Markov models of L-type calcium channels in non-cardiac cells.
2.1 General description: VDI and CDI
Whereas activation kinetics of L-type channels are voltage-dependent (Budde et al., 2002; Lacinová, 2005), inactivation has often been found to have dependence on both voltage and the internal “concentration” of calcium ions, as discovered by Brehm and Eckert (1978) in Paramecium and Tillotson (1979) in molluscan neurons. The two components are called CDI (calcium-dependent inactivation) and VDI (voltage-dependent inactivation). A hallmark of CDI is that it has a maximal effect where the relevant calcium currents are themselves maximal. Other markers are the reduction in CDI if is the charge carrier or if the buffers EGTA or BAPTA are present in the pipette (see Budde et al., 2002, for a discussion).
The relative contributions of CDI and VDI vary widely amongst cell types and modeling these contributions is not always as straightforward as in the simplified scheme presented below. Sometimes CDI may be absent, especially in the case of channels (Koschak et al., 2003; Baumann et al. 2004, Singh et al., 2006; Wahl-Scott et al., 2006; Liu et al, 2010). Indeed, often CDI is not included in modeling and often there is no inactivation at all, neither voltage nor calcium dependent, but it is not clear if this renders some calculations inaccurate.
In Tables A1.1-A1.4 of the Appendix, there are given data for about 65 studies, which involved L-type (or undefined high threshold calcium) currents. This survey is not exhaustive but representative of works from 1987 to the present. About half of these are experimental and about half concern mathematical modeling. Some salient aspects of the experimental studies are discussed in Section 3. Here we note that for the 24 neuronal modeling studies, 16 included no inactivation, 3 included VDI only, 3 included CDI only and a further 2 included both VDI and CDI. It is not clear if inactivation was omitted in several cases simply because the models employed data extrapolated from other cell types or the inactivation was considered to be unimportant or extremely slow. For the 7 models for cardiac cell L-type calcium currents, 2 studies included VDI only and 5 included both CDI and VDI. It is claimed (De Waard et al., 1996) that inactivation of L-type currents is generally slow in neurons and secretory cells but more rapid in cardiac cells. The data in Table A3 indicate that this may not always be the case, but the definition of the term rapid is no doubt flexible.
Generally, CDI has been cited as being more rapid than VDI (Budde et al., 2002; Lacinová and Hoffman, 2005; Grandi et al., 2010). The molecular basis of the dynamics of CDI has been an active and fascinating research area in the last two decades (Imredy and Yue, 1992,1994; Lee et al., 1999; Peterson et al., 1999; Qin et al., 1999; Zühlke et al., 1999; Erickson et al., 2003; Soldatov, 2003; Bazzazi et al., 2010). It was found that calmodulin, which is tethered to the channel, must bind , as depicted in Figure 2, whereupon a configurational change takes place resulting in inactivation. Crump et al. (2011) have reported that calmodulin and can compete to limit CDI in . The roles of the and subunits in determining the properties of channels have been discussed in Ravindran et al. (2008) and Ravindran et al. (2009).
There have been developed, since the original discovery of CDI, two main modeling ideas concerning the spatial distribution of calcium ions which participate in the inactivation process. One, called shell theory and posited originally by Standen and Stanfield (1982), is that there is a region of some 100 nm depth inside the cell membrane where calcium ions may accumulate, giving a concentration much higher than in the remaining cytoplasm and that it is which should be used to determine the rate of CDI. This approach is widely used in neuronal modeling, if indeed CDI is included. The second approach, called domain theory (Sherman et al., 1990), takes account of the calcium ions just inside the pore where they have entered the cell. In fact, according to Imredy and Yue (1994) and Cens et al. (2006), inactivation (CDI) can be induced in a section of membrane which contains a single L-type channel. However, in some cells, in a region with many channels, averaging over all channels should make the often used and simpler shell approach a reasonable approximation.
Special consideration is made for some cardiac and other muscle cells where calcium entry, principally through L-type channels, leads to -induced calcium release (CICR) of stored calcium via ryanodine receptors and results in rapid CDI. Many articles have addressed the modeling of CICR and the geometrical details and the formation of localized increases in , called calcium sparks, and their triggering of a large local increase in (see for example and references therein, Shiferaw et al., 2003; Soeller and Cannell, 2004; Koh et al., 2006; Bers, 2008; and Groff and Smith, 2008). Many of these approaches employ Markov models (Hinch et al., 2004; Shannon et al., 2004; Greenstein et al. 2006; Faber et al., 2007). Scriven et al. (2010) have provided detailed information on the geometry and numbers of channels and ryanodine receptor clusters in rat VM which are useful in modeling dynamics.
Ryanodine receptors may also be coupled to L-type calcium channels in some neurons so that CICR plays a role. A comprehensive review containing many examples of CICR in neurons, including that involving L-type currents in the hippocampus, was compiled by Verkhratsky (2005). Coulon et al. (2009) report the occurrence of both low threshold and high threshold calcium currents in connection with CICR in the thalamus. In bullfrog sympathetic neurons, Albrecht et al. (2001) showed that small elevations of evoked by weak depolarization lead to accumulation by the endoplasmic reticulum, and that accumulation became stronger after inhibiting CICR with ryanodine. A mathematical model was presented in support of these results. In another interesting related study, Hoesch et al. (2001) concluded that caffeine is a reliable agonist for CICR in rabbit vagal sensory neurons, but that caffeine-activated rises in in nerve cells could not be attributed solely to release from intracellular stores. See Tsien and Tsien (1990), Friel and Tsien (1992), Chavis et al. (1996) and Ouyang et al. (2005) for further examples and discussions of neuronal CICR.
2.2 The basic model for L-type current
In the following, the membrane potential is , the internal calcium concentration is , the external calcium concentration is and is time. All the deterministic formulations of the L-type calcium current employed in modeling to date are included in the general form
| (1) |
where is the voltage-dependent activation variable, is the voltage-dependent inactivation variable and is the (internal) calcium-dependent inactivation variable. The factor contains membrane biophysical parameters and, as described below, is of the Ohmic (or linear) form (as in (15)) used in the original Hodgkin-Huxley model, or the constant-field form (as in (17) or (19)), often called the Goldman-Hodgkin-Katz form. The values of and are ideally dictated by best fits of current-voltage relations to experimental data. The power to which is raised, is about equally frequently or , with invariably for cardiac cells. For skeletal muscle, before the L-type was distinguished, the value was employed (Standen and Stanfield, 1982). Details are given in Tables A1.1- A1.4 in the Appendix. The value of , if indeed VDI is included, is invariably . (Putting implies no VDI.) The notation is often used for and often used for , but the present notation avoids excessive subscripts in subsequent formulas. If other calcium currents were under consideration, the variables for L-type current might be usefully written as , and . In some reports, L-type channels are described as being also permeable to and , the relative permeabilities being given for ventricular myocytes as 2800:3.5:1 (Luo and Rudy, 1994; Faber et al., 2007) and 3600:18:1 (Shannon et al., 2004). The contributions from and are evidently sufficient to bring the reversal potential for from its value around the Nernst potential for (about 120-150 mV), which it would be close to if it was through a purely -conducting channel, to the observed values of about 70 mV. However, in what follows there is no focus on the and components of the L-type current. In modeling neuronal or other cell-type dynamics, there are of course many other components, one of which will be the intracellular calcium concentration whose value will directly influence , usually being regarded as constant.
Each of the variables , and takes values between 0 and 1, inclusively, and the product is interpretable as the probability that the channel is open or conducting or equivalently gives the expected fraction of such channels in a large sample. As can also be seen from Tables A1.1-A1.4, there have been many forms other than what might be called the full description as in Equ. (1) in which there there is both time-varying voltage-dependent inactivation and time-varying calcium-dependent inactivation. Thus, as mentioned in Section 2.1, in some computations, there is no inactivation whatsoever, or there may be just one or the other of voltage-dependent or calcium-dependent inactivation, either with or without time dependence. Sometimes, if a time constant for an activation or inactivation variable is very small, the steady state value of the variable is assumed to hold instantaneously with no time dependence. With a few exceptions, this has been the case in modeling calcium-dependent inactivation.
2.3 Activation and inactivation variables
Most of the material in this subsection is standard but is repeated here for notational purposes and to make the account self-contained. According to the above basic model there are three dynamical variables determining the magnitude of the current. These are the activation variable, always assumed to be purely voltage-dependent, the voltage-dependent inactivation variable, and the calcium-dependent inactivation variable.
2.3.1 Activation variable and voltage-dependent inactivation variable
The activation variable is usually assumed to satisfy the differential equation
| (2) |
where is the steady state value and is a time constant which may depend on . Similarly for the voltage-dependent inactivation variable
| (3) |
In the classical approach, the voltage dependence of the steady state activation variable is written in the Boltzmann form
| (4) |
where is the membrane potential. The half-activation potential is given by , and if the derivative of is denoted by then the slope factor is . Similarly, if a voltage-dependent inactivation is included then its steady state form may be written as
| (5) |
where and the slope factor is .
In many instances the Boltzmann forms are not used but rather forward and backward rate coefficients and respectively, are introduced, so that
| (6) |
with a similar equation for . It is usually the case that and and similarly for the inactivation variable, but as will be seen from Table A2, variations have been employed.
The Boltzmann forms for and have the advantage of making it immediately transparent at which voltages these functions have their half-maximal values and over what ranges of they are significantly different from zero or one. If and are given, and , then one may determine an approximating Boltzmann curve by graphical inspection or calculation to ascertain the and -values.
2.3.2 Calcium-dependent inactivation variable
It will be seen in the summary of various models presented below that the inactivation variable has entered the modeling in many different forms. The most general, which contains all those employed, can be written as
| (7) |
where is the steady state and is a time constant which may depend on . Here and are defined through
| (8) |
| (9) |
where , with units time-1, is a constant and in mM is the value of at which the steady state inactivation has half-maximal value. The index has been given the values 1 (Standen and Stanfield, 1982), 2 (Luo and Rudy, 1994) and 3 (Fox et al., 2002). It can be argued that , which is often referred to as a Hill coefficient, is the approximate number of calcium ions which bind to a channel or associated molecule to give inactivation. However this reasoning is open to considerable doubt (Weiss, 1997). Höfer et al. (1997) reported that the Hill coefficient for binding of to the site mediating CDI was close to 1 with an “inhibition constant ” of 4M. In the original derivation of Standen and Stanfield (1982) it was assumed that the underlying reaction was in fact simply
| (10) |
with . Using standard reaction rate theory (e.g. McConigle and Molinoff, 1989) this scheme gives the ratio of inactivated to activated as
| (11) |
(Recall that is the interpretable as the probability that a channel is not inactivated by a -dependent mechanism.) The alternative formulation of the time-dependent behaviour in the case of calcium ions binding to give an inactivated channel is through the differential equation
| (12) |
where which is consistent with (7)-(9). However, refinements of this basic model would be needed to incorporate other findings such as the dependence of CDI on voltage in cardiac myocytes (Faber et al., 2007).
2.4 Determining the current
Although they are well-known, we give here for completeness the two most generally used methods for calculating membrane ion currents (see e.g., Tuckwell, 1988; Koch, 1999). These are the linear and constant field methods, of which the former is simpler. In the 22 works on non-cardiac cells summarized in Table A1.1, which state the method of determining the current, 15 use the linear method and 7 use the constant field method. All cardiac cell studies in Table A1.4 use the constant field method. Although the constant field method is considered more appropriate, if the voltage doesn’t spend much time above 0 then the linear method may be sufficiently accurate, especially when there is voltage-dependent inactivation, which is supported by the calculations in Section 4.1.
2.4.1 Linear method
This method, employed by Hodgkin and Huxley (1952) in their fundamental modeling of the action potential in squid giant axon, consists of multiplying the membrane conductance by the driving potential , where is a reversal potential, to give
| (13) |
This method is called linear (or Ohmic), as the term is linear in , but not of course the conductance. The conductance is the product of a maximal value and one to three of the factors , and , all of which are dimensionless and take values between 0 and 1 inclusively. That is,
| (14) |
Assuming a membrane area sq cm, a channel density per sq cm and a single channel open conductance of , the maximal conductance is . Then in terms of fundamental quantities
| (15) |
As can be seen from Tables A1.1-1.4, and are usually small non-negative integers between 0 and 2 for L-type currents. If is in mS and voltages are in mV, then given by (15) is in A.
The reversal potential for an ion type is often taken to be its Nernst potential which for is
| (16) |
where and are external and internal concentrations, , and have their usual meanings, having units of volts. Although is sometimes taken as the value of , it is usually of magnitude about 120 mV, which is much higher than experimentally determined values of which are around 60-70 mV. In modeling, using thus gives substantially larger calcium currents than expected.
2.4.2 Constant field method
From the basic expression for the current density under the constant field assumption (see for example Tuckwell, 1988, Chapter 2), the L-type calcium current, in A, through a membranous area of square cm is given by the Goldman-Hodgkin-Katz flux equation
| (17) |
where for convenience of expression we have defined the temperature-dependent voltage
| (18) |
is Faraday’s constant (96500 coulombs/mole), is the membrane permeability coefficient in cm/sec, and and are the intracellular and extracellular concentrations of in mM. Note that the partition coefficient, here assumed the same for the intracellular and extracellular boundaries, is absorbed into the permeability coefficient. However, if the intracellular and extracellular partition coefficients are different, then additional multiplicative factors will appear with ion concentrations, as in, for example, Sun et al. (2000) and Fink et al. (2011). In terms of single channel properties, the current in A through an area of cm2 is
| (19) |
where is the density of channels in cm-2 and is the single channel permeability in cm3/sec.
3 Data on L-type activation and inactivation
A large number of sources of data for L-type activation and inactivation, including both VDI and CDI, have been considered, back to the first uses of the term “L-type” (Nowycky et al., 1985; Fox et al., 1987). Data on the half activation potentials and slopes are given in Tables A1.1-A1.4. In these and all subsequent tables the authorship of articles is given only by first author and date to minimize column width. In the first column of Tables A1.1-1.4 are given carrier concentrations. M denotes a purely mathematical modeling study, the absence of M can denote either a purely experimental work, or experimental work in conjunction with modeling. The characterization of currents as L-type by various authors has been assumed to be correct. Voltage-dependent inactivation parameters and are also given if available. Table A1.1 contains data for neurons and secretory cells, whereas Table A1.2 is restricted to cardiac cells. In some cases, marked with asterisks (∗), parameters have been estimated approximately from data presented graphically, but the original articles should be consulted for details. Table A1.3 has data for neurons and secretory cells with both VDI and CDI and Table A1.4 presents these data for cardiac cells. In Table A1.1 the entry for Joux et al. (2001) for has two values as fits were to a double Boltzmann function. Note that the concentrations may differ in the various preparations, (and occasionally be ) as described in the first column of Tables A1.1-1.4. For example, the value in the first entry (Fox et al., 1987) is =10mM, which may explain why the value of seems rather high. In general, much of the variability in the data presented is attributable to various ionic carrier concentrations and differing subunit isoforms. In order to keep the Tables relatively simple, many such details are omitted, but these can be obtained from the original sources in most cases.
3.1 Steady state activation and inactivation
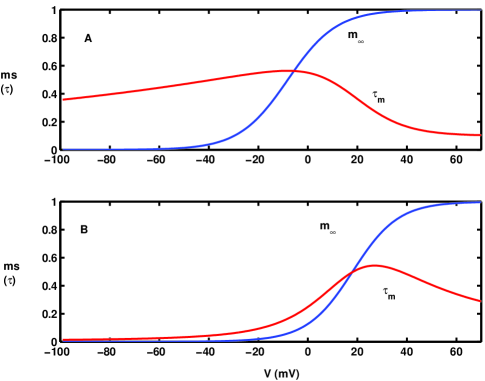
In the top part of Figure 3 the steady-state activation is plotted against for the two lowest and two highest values of the half-activation potential found in a comprehensive, but not exhaustive, search of the literature, including all modeling and experimental results in the Tables A1.1-1.4. The two lowest are for midbrain dopamine neurons, with half-activation potentials of -50 mV (Amini et al., 1999; Komendantov et al., 2004).
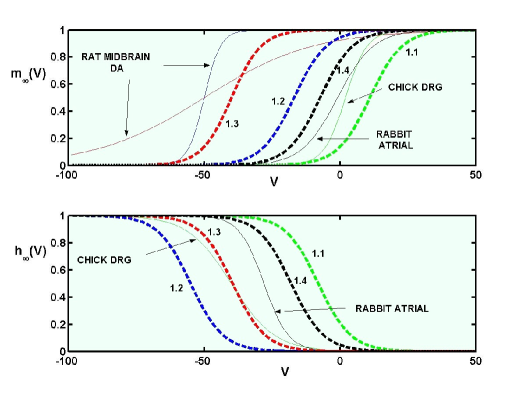
The two highest are +5 mV for ventricular myocytes (Shiferaw et al., 2003) and +2 mV for chick dorsal root ganglion (Fox et al. 1987). Also shown in the top part of the figure are examples of the curves found for the channel subtypes -. It can be seen that the curves for the subtypes cover or span those for the lowest and highest activation curves for cells except for the one for midbrain dopamine neurons.
In the lower part of Figure 3 are shown the corresponding steady state V-dependent inactivation curves for the two highest half-activation potentials. For the other two cases with =-50, there was only CDI. Also shown in the lower part of Figure 3 are the curves for each channel subtype. The curve for seems more extreme than that for any cell. In some cases Boltzmann functions for and were not given but rather explicit expressions for the forward and backward rate functions , , and . Such formulas when available are given for all cell types in Table A3. The parameters of fitted Boltzmann functions for the corresponding and were given in Tables A1.1-A1.4. When explicit expressions were given for the activation time constants , these are given in Table A4.
3.1.1 Distribution of half-activation potentials
It can be seen from Tables A1.1-A1.4 that there is great variability in the parameters for the activation and inactivation properties of L-type currents in various cells. The underlying reasons for variability include, (a) the occurrence of different subtypes of L-channels, some examples of whose properties are listed in Table A6; (b) the various locations of the channels over the soma-dendritic surface; (c) the interaction of L-type channels with other neighboring ionic channels; and (d) the ionic compositions of the intracellular and extracellular compartments of the cell under consideration. One other source of variability is that there are different methods, some more accurate than others, for calculating Boltzmann curves.
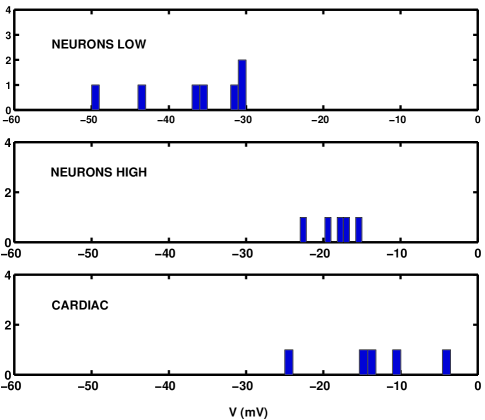
The majority of data in tables A1.1-A1.4 concerns modeling studies and it is useful to separate out the experimental values, and to subdivide these into those for neurons and cardiac cells. In particular, the experimental results considered here are only those for calcium concentrations in the physiological range because high concentrations of either barium or calcium ions can shift the half-activation potential in the depolarizing direction by 10 or more mV (Jaffe et al., 1994; Muinuddin et al., 2004). With these restrictions there are 13 half-activation potentials given for neurons and 5 for cardiac cells. Histograms for the values are shown in Figure 4. For neurons, the data are divided into a high ( mV) and a low group, the topmost panel being for the low group. The mean for the neuron high group is mV whereas that for the low group is mV. The mean slope factors for these two groups of neurons are mV for the high group and mV for the low group. These average slope factors are obtained on omitting the outliers 2.45 in the high group and 20.0 in the low group. The mean value of for the experiments with cardiac cells is -13.6 mV with a standard deviation of 7.8 mV, and the corresponding average is 6.84 mV with standard deviation 1.61 mV. It is then of interest to note that the average values of the half activation potentials for and , using Table A6 values with physiological calcium ion concentrations, are -18.7 mV and -38.9 mV, respectively. These values correspond well with the mean values of the high and low groups of neurons. The values for cardiac cells tend to be higher than those in even the high neuron group, but the sample sizes are too small to draw any statistically significant conclusions.
For all the 25 neuronal modeling studies the mean value of is -21.0 mV with a standard deviation of 12.21 mV, and for the mean is 7.26 with a standard deviation of 2.33. The mean modeling study parameters correspond roughly to the experimental values for the high neuron group. For the 7 cardiac cell (all kinds) modeling studies the mean half-activation potential is -8.8 mV with a standard deviation of 9.1 mV and the corresponding mean for is 6.4 mV with a standard deviation of 0.52.
For the parameters of the Boltzmann function for the steady state inactivation, and , there are, unfortunately little appropriate experimental data, and none which could be considered reliable, though many modeling studies have employed estimates (see Tables A1.1-A1.4) and see below. In order to provide crude estimates based on experiment, one may use the results of Koschak et al. (2001) as given in Table A6 for the differences in voltage between and for and in high barium concentration. This procedure yields values which are summarized in Table 3 for the activation and inactivation parameters.
activation and inactivation in neurons
| High neuron | Low neuron | All models | |
|---|---|---|---|
| group (expt) | group (expt) | ||
| -18.7 | -38.9 | -21.0 | |
| 8.4 | 5.8 | 7.26 | |
| -42.0∗ | -61.9∗ | -38.95 | |
| 13.8∗ | 6.6∗ | 6.82 |
∗ Estimated - see text.
For cardiac cells, based on the few experimental studies available, the mean is -40.0 mV with standard deviation 12.8, the corresponding mean value of being 6.85 mV with a standard deviation of 2.04 mV.
Of the 25 neuronal modeling studies in the tables, only 6 included VDI and these yielded a mean value of -38.95 mV for with standard deviation 14.29. For the corresponding values of the slope factor , the mean is 6.82 with a standard deviation of 2.16, where one value is omitted as an extreme outlier. For the cardiac modeling, the mean value of is -30.1 mV with a standard deviation of 10.9 mV and the corresponding mean for is 6.1 mV with a standard deviation of 2.00 mV.
3.2 Time constants for activation
Some values of for activation, with corresponding inactivation, if available, are reported in Table A3. This table has been divided into a part with experimental results and a part on values of which have been employed in modeling studies. As seen in Table A3-Experimental, there are not many explicit experimental results available for the time constants of activation (or inactivation) of L-type currents. In neurons values of range from about 0.5 ms in sympathetic neurons (Belluzzi and Sacchi, 1991) to 2.3 ms in hippocampal pyramidal cells (Avery and Johnston, 1996), a maximum value of 1.541 ms being reported for thalamic relay cells (McCormick and Huguenard, 1992). These values seem compatible with those given for the appropriate subtypes in Table 6. For skeletal muscle, a value of 19.82 ms (Standen and Stanfield, 1982; here assuming L-type) is also compatible with the relatively high value for the subtype. The experimental values reported for smooth muscle are around 4.0 ms (Muinuddin et al., 2004). Some available data for for subtypes are given in Section 5.
In Table A3-Modeling, there are reported 23 values employed
for , with a large range of values, many of which
are much larger than the values for subtypes reported in Table 6.
Many of the values employed for a given neuron type are
not based on experiments for that neuron type but adapted
from those for other, sometimes quite different, neurons.
Often quite disparate values appear for what are possibly
the same kind of cell. Discrepancies may arise
because it is difficult to categorize a specific
channel type in a neuron without a detailed voltage-clamp
and pharmacological analysis.
We consider cells in the following categories.
Dopaminergic neurons. The value of about
0.134 ms was employed by
(Li et al., 1996) which contrasts greatly with the value 19.5 ms used
by both Amini et al. (1999) and Komendantov et al. (2004).
The approach of Li et al. (1996) is critically discussed by
Amini et al. (1999).
Cardiac cells. Concerning the listed values, in the three modeling studies
on ventricular myocytes, two (Luo and Rudy, 1994; Shannon et al.,
2004) have -values with a maximum around 2.25 ms whereas
a third
puts the maximum value much higher at about 19.3 ms (Fox et al., 2002) and
at a considerably more hyperpolarized level.
In their analysis of the firing properties of rabbit sino-atrial
node pacemakers, Zhang et al. (2000) chose a value of about 3.8 ms
for the maximum activation time constant. Thus in most
of these studies the magnitudes of are comparable
with or near the values for and channels (see Table 6) which are
plentiful in the heart.
Hippocampal cells.
The range of activation time constants for hippocampal
pyramidal cell models is from 0.83 ms for CA1 (Poirazi et al., 2003)
to 4.56 ms for CA3 (Migliore et al., 1995). For the latter
cell-type, Jaffe et al. (1994) used a value with a maximum of 1.5 ms.
According to Table 6 and
Figure 12 all of these values are
within the ranges of the ones given for
and channels, both of which are prevalent in the hippocampus.
Thalamic relay cells.
The experimental findings of McCormick and Huguenard (1992)
for , with a maximum of 1.541 ms at mV,
were implemented in a model by the same authors. The same
values were later employed by Hutcheon et al. (1994). Rhodes and
Llinas (2005) put the maximum value of the time constant somewhat larger at
2.1 ms at -19 mV, but in the table of parameter values the current is
referred as a generic rather than specifically as an
L-type current. All of these values are compatible with the expected
subtype values.
Pituitary corticotrophs. The two modeling studies
of these cells listed in the table have fairly large values of .
In the first study, LeBeau et al. (1997) set the value at 27 ms
for all , whereas Shorten and Wall (2000) had a maximum
for of value 11.32 occurring at mV.
There seems to be a fairly large difference between these
values and the sub-type values, but there are many sources
of variability as discussed elsewhere in this review.
Cortical pyramidal cells. In the one parameter
set available (Rhodes and Llinas, 2001), the maximal time constant for
L-type activation was
set at 2.1 ms, occurring at -19 mV. This value is well within the
range of the available data for the appropriate subtypes as given
in Table 6 and Figure 12.
Spinal motoneurons. The L-type activation listed
in the 3 listed modeling studies of these neurons (Booth et al, 1997;
Carlin et al. 2000; Bui et al, 2006)
is much slower than
the values available for either of the subtypes which are
candidates for being present in CNS neurons. The first of these
studies set ms, whereas the two subsequent ones put
ms whereas the largest value in Figure 12 is about 4 to 5 ms.
Smooth muscle. In modeling
a rat mesenteric smooth muscle cell, Kapela et al. (2008) for
used a Gaussian-like function with a maximum value of 3.65 ms at mV.
Such a value is close to the experimentally reported time constant in
(Muinuddin et al., 2004).
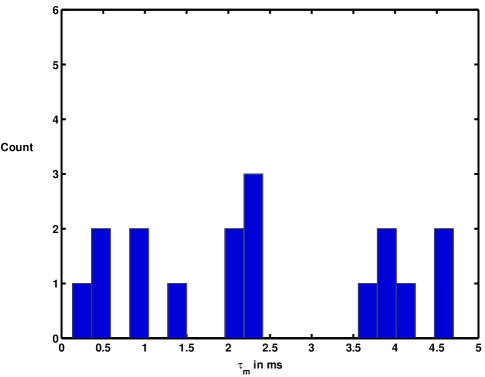
Figure 5 shows two plots of versus for two of the few available experimental data sets (but see Section 5 for results for L-subtypes).These are both for rat sympathetic neurons (A, Belluzzi and Sacchi, 1991; B, Sala, 1991) and are, in the absence of reliable L-type data in physiological or near physiological solutions, taken from HVA studies which may contain L-type and other high threshold components. These data sets are very different in magnitude and form from those used in many modeling studies, where sometimes the time constant for activation is taken to be a large value, constant and independent of voltage. They are also considerably less than the values reported for and in 2mM in Section 5. Molitor and Manis (1999) report experimental values of with a maximum of about 1.2 ms at about V=-20 mV in guinea pig dorsal cochlear nucleus neurons. In Figure 5 are also drawn the steady state activation functions, also based on experiment, for comparison.
The data of Table A3 on maximum values of activation time constants are collected into a histogram in Figure 6, but this includes only values less than 10 ms. The mean for the experimental results on neurons is 1.34 ms. For all the data shown (n=17) the mean is 2.38 ms and the standard deviation is 1.51.
For time constants for voltage dependent inactivation in neurons there are very few data. The average of the two available experimental maximum values is 65 ms and the average of 5 modeling maximum values is 140.9 ms.
3.3 Magnitudes of or related quantities
Data on the magnitudes of in various cells is collected in Table A5. Such data are presented in several forms, viz, (a) the actual current density, usually in pA/pF, which may be for the whole cell or a part thereof (b) the permeability (c) the conductance per unit area (d) the whole cell conductance (d) the fraction of total calcium current that is . It can be seen that the proportion of across cell types is extremely variable from nearly all of the calcium current in some muscle and cardiac cells (Kapela et al., 2008; Benitah et al., 2010) to just a few percent, for example in serotonergic (dissociated) cells of the dorsal raphe nucleus (Penington et al., 1991). The roles of are presumably very different in these examples. From Table A5, the largest current density is 19.3 pA/pF in supraoptic nucleus (Joux et al., 2001), but almost as high magnitudes are found in rat CA1 pyramidal cells (Xiang et al., 2008) and ventricular cardiomyocytes in rats with renal failure (Donohoe et al, 2000). The highest reported conductance density is 7 mS per square cm in rat CA1 pyramidal cells (Xiang et al., 2008). Note that current densities can differ significantly in different preparations such as those with different ages, or with different times in culture.
4 Examples of calculations of
In this Section we apply the basic model (1) to determine the L-type calcium current in three cases. In the first, only VDI is considered, whereas in the remaining two examples, VDI and CDI are both operative.
4.1 Steady state currents obtained by the linear and constant field methods with voltage dependence only
The activation and inactivation variables, which are dimensionless and take values in [0,1], may depend on membrane potential or ion concentrations, or both, but in this section only voltage dependence is considered. Here we wish to compare current-voltage relations obtained by the two methods outlined in Section 2.4. In order to compare the steady state currents and calculated by the two methods, an average maximal conductance density (from the values given in Table A5) of 1.3925 mS/cm2 was assumed for the determination of , although this value varies greatly from cell to cell. For the steady state activation variable used in the calculation of , two values of were employed, being a relatively low value, mV, and an intermediate value mV. The corresponding values of were 6.97 mV (low) and 7.78 (intermediate). When inactivation was included, the values for were mV (low) and mV (intermediate), with corresponding values for of 9.55 mV (low) and 6.18 (intermediate).
Four sets of values for and were employed, giving the forms and . The calculated results are shown in the four panels of Figure 7.
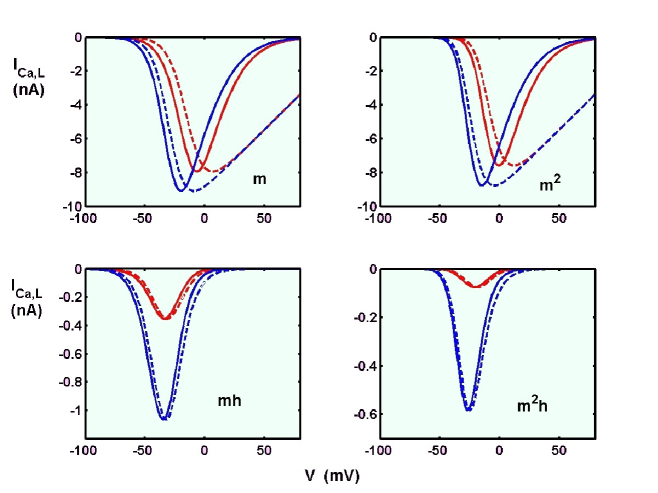
In each case the current (linear method) was calculated first, the temperature being set at 25o C, the internal calcium concentration fixed at 100 nM and the external concentration fixed at 2 mM, giving mV which was used as the reversal potential. The constant field current was then calculated and the permeability adjusted to make the peak (inward, negative) current the same as that in the linear case. This gave 8 values of the permeability which are listed in Table 4 which are close to those reported for L-type calcium currents (Hutcheon et al., 1994; Luo and Rudy, 1994).
| Low (-29.6 mV) | 3.01 | 3.40 | 2.08 | 2.41 |
| Intermediate (-14.39 mV) | 4.41 | 5.26 | 2.11 | 2.76 |
The following can be seen from the results in Figure 7. Details of the values of at which minima in (maximal current amplitude) occur are given in Table 5. Firstly, without inactivation (top two panels), as expected, the constant field and linear calculations are similar in magnitude until a value of just greater than that at which the minimum of (maximum amplitude) occurs. However, the minima in the constant field case occur at voltages about 11-13 mV more negative than for the linear case, both for open probabilities given by or and whether is ascribed the low or high value. For larger values of the two calculations give strikingly different results, as the constant field currents are almost symmetric about their minima and return to almost zero at values of around 70 mV whereas the linear calculation has the current returning to zero very gently by comparison, and of course reaching zero at the reversal potential of (about 128 mV). Whether such differences are significant for any given cell depend on how long the voltage stays at values greater than those at the minima (maximum amplitude), which are given in Table 5.
Changing from an to an dependence for shifts the voltage at which the greatest current amplitude occurs by about 5 or 6 mV in the depolarizing direction. Furthermore, there is not a large difference in the magnitude of the current between the low and high cases.
| =-29.7 mV | =-14.4 mV | |||
|---|---|---|---|---|
| Linear | Const Field | Linear | Const Field | |
| -9 | -20 | 6.5 | -7 | |
| -4 | -15 | 12 | -1 | |
| -32 | -35 | -32 | -34 | |
| -25 | -27 | -18 | -21 | |
Secondly, with inactivation (bottom two panels) the current/voltage relations are practically symmetric for all combinations of and the factors and . Thus, the constant field calculations are practically the same as the linear calculations for all values of . Inactivation, either as or shifts the voltage of maximal current amplitude by very large amounts in the hyperpolarizing direction. The smallest shift is -12 mV with and the constant field calculation and the largest is -30 mV with and the linear calculation. The magnitudes of the currents are reduced by an order of magnitude by the inactivation and the reductions are much greater for the higher value of (red curves). The difference for the linear and constant field results for the voltage of maximal current amplitude is only a few mV.
4.2 Time dependent for high and low group neurons with VDI: or ?
The question arises as to when the time-dependent results for an form of current differ significantly from those for an form. This was investigated using the parameters for steady state activation and inactivation for the two sets called high and low summarized in Table 3.
The time constant of activation was set at the average maximal experimental value of 1.34 ms for neurons and the time constant for inactivation was set at 29.9 ms as found in Belluzzi and Sacchi (1991), this being one of the only two experimental values available. Current flows were computed for voltage steps from an initial value mV to final values mV and mV. The following Hodgkin-Huxley (1952) formula may then be applied
where we have employed the abbreviations for the activation, for the inactivation, and being the time constants. For these calculations was set at unity as only relative magnitudes are of interest.
The results are shown in Figure 8. It can be seen that in most of the examples shown, there are only minor differences in the currents computed by the versus form. The case where the difference is very significant (plot 8A) is for the high neuron group with a voltage step from - 80 mV to -30 mV. However, only a detailed neuron model, which is beyond the scope of this article, could ascertain whether significant differences arise in the ongoing spiking activity when L-type currents are one of an array of current types. Nevertheless, it has been demonstrated that the choice of the form of the open probability contribution from voltage dependent terms, , can have significant consequences for the current/voltage relations or for current versus time. In the ideal situation voltage-clamp data for both activation and inactivation would be used to find the best fitting theoretical form for a component current, as in the original Hodgkin-Huxley (1952) analysis. Care is required in reporting parameters for activation and functions so that it is clear whether they are for or . It is also important that the experimental data have been analyzed correctly.
4.3 Two time constants in inactivation
For L-type calcium current inactivation, most reports indicate that there are two time constants, one fast and one slow (Luo and Rudy, 1994; Romanin et al., 2000; Meuth et al., 2001; Budde et al., 2002; Lacinova and Hoffman, 2005; Faber et al., 2007; Findlay et al., 2008). According to Lacinova and Hoffman (2005), such is the case for smooth muscle, ventricular myocytes, several neurons and the channel. Furthermore, in cells, fast time constants range from 7 to 50 ms and slow ones from 65 to 400 ms whereas for the channel, the ranges are 20 to 100 (fast) and 160 to 2000 (slow). See Table A3 for several data although no distinction is made between fast and slow inactivation time constants in the cited works. In an earlier study of calcium currents (not specifically stated as L-type) in CA1 pyramidal cells, Kay (1991) found, with 5mM , a fast time constant with a maximum value of about 240 ms at V=-10 mV, and a slow time constant with a maximum of about 2200 ms at V=-11 mV. It was pointed out that typically (in cells without CDI) the amount of inactivation increases with increasing V, and that the rate of inactivation tends to be Gaussian-like as a function of V, with a maximum around the voltage at which the steady state inactivation is half-maximal.
The relative contributions of CDI and VDI vary. Lacinova and Hoffman (2005) state that in general for a brief pulse, CDI is responsible for about 80% of inactivation and VDI responsible for the remaining 20%. The faster time constant is usually taken to be associated with CDI. However, in some cases there are taken to be two time constants for VDI of L-type Ca currents, such as in ventricular myocytes (Faber et al., 2007; Findlay et al., 2008) where the dichotomy is attributed to the existence of two voltage-dependent inactivation states. Two time constants were also demonstrated by Morad and Soldatov (2005) for barium currents with no CDI for .
To illustrate the occurrence of two time constants we show results obtained for for the basic model of Equation (1) using the constant field expression for the current. These are designed to be comparable to the experimental results on thalamic relay (LGN) neurons in Budde et al. (2002), where a step to a test voltage of 10 mV is made for 800 ms after holding at -60 mV. The parameters used were as follows. For activation, was set at -37.5 mV with slope factor 5 mV, and for voltage-dependent inactivation, was set at -59.5 mV with a slope factor of 10 mV. The time constant for activation was given by
| (20) |
and that for VDI was set at ms for all . In addition, a calcium pump term was added of the form
| (21) |
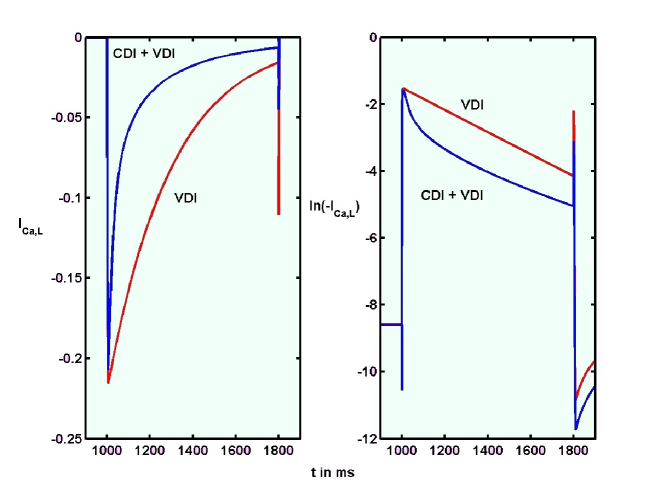
where mM (Rhodes and Llinás, 2005) and . Initial internal calcium concentration was set at 70 nM and extracellular at 2mM. The standard value of the multiplicative factor in (19) was chosen to make the maximum amplitude of about 0.2 nA as in Budde et al. Figure 2. For the CDI term we use the standard model (7) and (8) with , ms (constant) and mM.
Results are shown for in Figure 9, the contribution from the pump being small and not included. During the pulse the internal calcium concentration rose to a maximum of about 300 nM. In the left panel, is plotted against time in the cases of CDI + VDI (blue curve) and for VDI only (red curve). With CDI the initial decline of current is very rapid and merges into a slower decay after about 100 ms; with VDI only, the decline in current is slow and relatively uniform as can be seen in the right hand panel where is plotted against time to reveal changes in time constant. The curve for VDI is a straight line, indicating a single time constant. The early (fast) time constant for CDI + VDI was approximately 49 ms and the slow time constant about 264 ms. Both of these values are in the ranges given by Lacinova and Hoffman (2005) quoted above. They are also similar in magnitudes to the values reported in Budde et al. (2002).
4.3.1 Effects of varying parameters
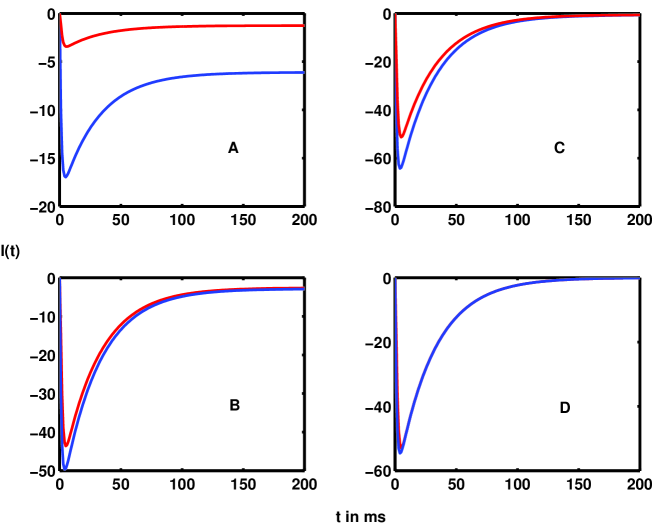
The effects of varying several parameters on the inactivation of according to the above test pulse procedure are shown in Figure 10. Here both CDI and VDI are present, but the graphical results are given only for the first 200 ms. The parameters used here are as given by Rhodes and Llinás (2005) as in Table A1.3, using the same , but with time dependent . The standard set of parameters is taken to be as for Figure 9, with the following variations. In the top left panel, the current is calculated for four values of the CDI time constant , being 5, 10, 30 and 100 ms. Note that most modeling of L-type currents effectively takes (see Table A1.3), as the steady state is assumed to be attained immediately. When is 5 or 10 ms (blue and red curves), the current has almost the same time course as it does when the immediate steady state assumption is made. For ms (green curve), which is the value used by Standen and Stanfield (1982), the decay of current is much slower for the first 100 ms, very different from that for the immediate steady state assumption. For ms (black curve), the decline does not reach values comparable with the remaining three cases for at least 200 ms. In the top right panel are shown for four values of the time constant for voltage-dependent inactivation, no dependence on being assumed. The value of is set at 10 ms.
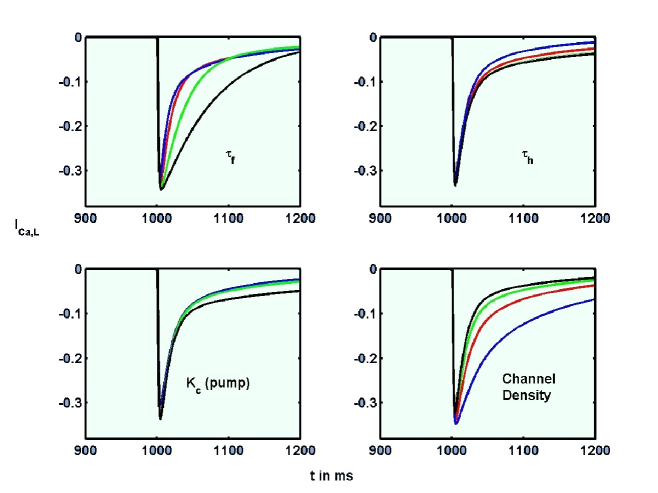
Results are shown for time constants (in ms) of 100 (blue), 200 (red), 300 (green) and 400 (black), which values encompass approximately the values employed (Table A3). As could be anticipated, increasing from 100 to 400 has a negligible effect for the first 20 ms but quite noticeable effects on the late current.
In the bottom left panel are shown results of varying the parameter which determines the rate of calcium pumping as in (21). The values employed are 1,2,3 and 10 times a base rate with blue, red, green and black curves respectively. When the pump rate is higher, is less available for CDI so the current has a larger magnitude. However, in the situation modeled here, it can be seen that a significant difference in occurs when the pump rate is increased tenfold, but that increases of 100% and 200% have only a small effect. Finally, in the bottom right panel are shown the time courses of for various channel densities, being 1 (blue), 4 (red), 8 (green) and 12 (black) times a base rate. The current amplitude is assumed proportional to the channel density so the higher channel densities result in more effective CDI. These results indicate that these four quantities have a significant influence on the amounts of CDI and VDI and thus the magnitude and time course of .
4.3.2 CICR
If there is a substantial amount of CICR, as occurs in cardiac and other muscle cells, then there may be two phases of CDI, consisting of an early rapid component due to release of from the sarcoplasmic reticulum and then a slower phase in response to calcium ion entry through L-type channels (or other calcium channels) (Budde et al., 2002; Bodi et al., 2005; Cueni et al., 2009; Empson et al., 2010). This raises the possibility of three time constants in the decay of , two for the two phases of CDI and one for VDI, or even four time constants if as mentioned above there are two for VDI. The effect of released from sarcoplasmic reticulum is graphically illustrated in Hinch et al. (2004). The basic model (1) can incorporate the influence of CICR on CDI by taking account of the time-course of the concentration, as stated in Section 2.1. This quantity will usually be obtained from either ordinary (for ) or partial differential equations (for , where is from 1 to 3 space variables) which incorporate calcium ion concentration changes due to pumping and buffering as well as fluxes through various channels. See Luo and Rudy (1994) for such a deterministic example. A detailed stochastic model for CICR in cardiac myocytes has been analyzed by Williams et al. (2007).
4.4 Calculations for double-pulse protocols
According to Budde et al. (2002), CDI tends to be rapid and results in a “U-shaped” inactivation curve when investigated using a double pulse protocol (Tillotson, 1979; Kay, 1991; Meuth et al., 2001). We show corresponding results for the standard model for L-type calcium currents as described in section 2. The voltage is held at a “conditioning” value, followed by a pause and then a “test” pulse at is delivered. Of interest is the relationship between the first and second responses. As in Figure 1 of Budde et al. (2002), mathematically we have
| (22) |
We use the constant field method and assume, as the results of Section 4.2 indicate a relative insensitivity to the power of ,
| (23) |
where contains physical constants and the constant field factor as given by (17). For the CDI term we use (7) and (8) with , mS (constant) and mM.
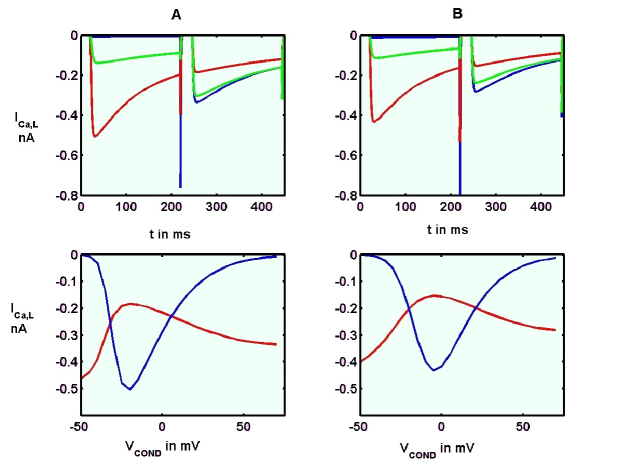
For the voltage-dependent activation and inactivation parameters we use the two sets for thalamic relay cells as given by Pospischil et al. (2008) (see Table A1.1) and Rhodes and Llinás (2005) (see Table A1.3). The time constant for activation was chosen as in Equation (20), and the inactivation time constant was set at ms for all .
The conditioning pulse is on from 20 to 220 ms and the test pulse is on from 225 to 445 ms. The voltage at the test pulse is taken as that at which the response to the first pulse has the largest (negative) amplitude. Results of these calculations are shown in Figure 11. The curves in the bottom part of the figure show the magnitudes of the currents in response to the first (blue) and second (red) pulses. The reduction in the amplitude of in the second pulse is most prominent when the response to the first pulse is the greatest, because has increased the most, resulting in the greatest amount of CDI. In the top parts of the Figure are shown responses to two-pulse clamps for three particular values of , as explained in the Figure caption. Although such results indicate that the standard model for with the usual voltage-dependent activation, coupled with VDI and CDI may be adequate for describing certain experimental paradigms, it is uncertain whether this is the case in applications to single cell models, mainly due to the lack of concrete data. The relative contributions of CDI and VDI depend on the particular cell type, mainly through the various combinations of subtypes of L-channels as well as modulating factors such as sub-unit configurations and various ligands.
4.5 Difficulties in the accurate modeling of
Mathematical modelers of nerve cell physiology are invariably faced with the dilemma of insufficient accurate data concerning the many ion channels influencing a neuron or muscle cell’s activity. It is hard to think of a single neuron for which such data is available for all known channel types. As an example, L-type current data, for a current denoted by , were not available for thalamic relay neurons when they were first comprehensively modeled (McCormick and Huguenard, 1992). Instead, the parameters were obtained from the calcium current results of Kay and Wong (1987) for CA1 pyramidal cells, where in fact an L-type current had not been pharmacologically identified. Kay and Wong hypothesized that the channels they had analyzed were from a homogeneous population. The same or similar data were employed by Traub et al. (1991) for in CA1 pyramids, Hutcheon et al. (1994) for in thalamic relay cells, Traub et al. (1994) for for in CA3 pyramids, Wallenstein (1994) for in nucleus reticularis thalami neurons and Wang (1998) for in cortical pyramidal cells. In none of these models was calcium-dependent inactivation included.
It is hoped that in the future, experiments can be performed to remedy the paucity of accurate data required for L-type (and other) current modeling. There are other limitations apart from the use of data from one cell type for another. The fact that the majority of experiments are performed on dissociated cells means that existing data must be biased towards those for cell somas, so that guesses have to be made for dendrites. To make choice of parameters even more difficult is the use of various different concentrations of either calcium or barium ions which may give results for such quantities as activation potentials which are very different from those for physiological concentrations. Temperature is another key factor which may alter the dynamic properties considerably. Furthermore, results for heterologous ion channels may not be the same as for the corresponding channels in native cells.
Thus, given the many uncertainties in the parameters describing the kinetics of the various ion channels, it is hard to know whether model-based predictions are truly descriptive of cell electrophysiology even when they agree with experimental observations. The hope is then that the modeling results are robust enough with respect to relatively small changes in the parameters. To construct a model of a nerve cell is a very large undertaking, and fortunately many researchers have had the courage to proceed with such endeavours in the light of uncertainties concerning the underlying channel data.
5 L-channel subtype properties
L-type currents are not only important for neuronal and cardiac cell dynamics. Although L-type channels play a limited role in the process of synaptic transmission, they are crucial for activity-dependent gene expression and for regulating plasticity at certain synapses (Hardingham et al. 2001; Dolmetsch et al., 2001; Helton et al. 2005). Thus they have been found to play an essential role in long-term alterations in synaptic efficacy underlying learning and memory in the hippocampus (Kapur et al., 1998; Graef et al., 1999; Leitch et al., 2009) where both and channel subtypes are predominantly located in postsynaptic dendritic processes and somata. Furthermore, current through channels has been demonstrated at the output synapses of mice AII amacrine cells (Habermann et al., 2003).
5.1 Distribution
The subtype is mainly found in skeletal muscle and is found in the retina, but also in human T lymphocytes (Kotturi and Jefferies, 2005). The remaining subtypes and constitute the main L-type channels in neurons, endocrine cells and heart cells. The subtype is widely expressed in heart, brain, smooth muscle and endocrine systems (Ertel et al., 2000). In the brain it is found in cortex, hippocampus, thalamus, hypothalamus, caudate putamen and amygdala (Splawski et al., 2004). In neuroendocrine cells, and channels are involved in action potential generation, bursting activity and hormone secretion (Lipscombe et al., 2004; Marcantoni et al., 2007). According to Vignali et al. (2006), 60% of calcium current in both mouse pancreatic A- and B-cells is L-type, with mainly in B-cells and both and in A-cells. The subtype is found in sinoatrial node, cochlear hair cells, and dendritic neuronal processes (Dolphin, 2009). Schlick et al. (2010) reported distributions of subtypes in many brain regions, including during development, and found that patterns tended to be intrinsic rather than dependent on neural activity. Using barium as charge carrier, Navedo et al. (2007) investigated isoform contributions in mouse arterial smooth muscle. Both and were involved in calcium sparklet formation but was primarily responsible (see Table A6).
Immunofluorescence studies have determined that both and have mainly proximal locations on neurons, particularly on the dendrites, and they may make a substantial contribution to the inward current and the action potential (Holmgaard et al., 2008). According to Martinez-Gomez and Lopez-Garcia (2007), in mouse and rat spinal neurons channels tend to localize in soma and proximal dendrites whereas channels are also found in distal dendrites. However, Zhang et al. (2006) found that in the cat, channels were dense in ventral horn motoneurons, occurring mainly on somata and proximal dendrites and being responsible for plateau potentials in these cells. Forti and Pietrobon (1993) found that functionally different L-type channels coexist in rat cerebellar granule cells. Although and are often found in the same neuronal processes, particularly dendrites, their subcellular distributions are sometimes distinct (Hell et al. 1993). An interesting graphical representation of the distribution of various calcium channels over the surface of hippocampal pyramidal cells was given in Magee and Johnston (1995).
Differential effects of corticosterone have been found for and in the CA1 region of hippocampus and the basolateral amygdala (Liebmann et al., 2008). In the former, corticosterone increases the amplitude of the slow afterhyperpolarization whereas in the latter no such effect is observed. The different responses are thought to reflect the expression of in hippocampus and the absence of this subtype in the basolateral amygdala.
5.2 Role in pacemaking
In the heart, is found in atrial tissue where it contributes to pacemaking but not in ventricular muscle that expresses (Lipscombe et al. 2004). According to Torrente et al. (2011), SA node pacemaker activity controls heart rate and local release is tightly controlled by channels. In KO mice, the frequency of transients in pacemaker cells was reduced by 45% relative to WT. In another study with KO mice, Zhang et al. (2011) found that channels are highly expressed in atrioventricular node cells and played a critical role in their firing. Mesirca et al. (2010) pointed out that atrioventricular node cells may contribute to pacemaker activity in the case of SA node failure.
The properties of channels which make them more suitable for pacemaking activity than channels were discussed in Vandael et al. (2010) with particular attention to dopaminergic neurons, cardiac pacemaker cells and adrenal chromaffin cells. activates with steep voltage dependence at voltages considerably more negative than and has faster activation but slower and less complete voltage-dependent inactivation. According to Striessnig (2007), such activation at low voltages enables currents to support pacemaking activity in sinoatrial node and some neurons (for example Putzier et al., 2009a). For adrenal chromaffin cells, Marcantoni et al. (2010) found that although and occurred with about equal frequency in WT cells, most of which fired at about 1.5 Hz, -deficient cells had significantly less firing. The essential role of and their coupling to BK channels in the pacemaker activity of these cells was established. Alternative splicing of the C terminus of the subunit of has been shown to give two forms, of which one (short, 42A) is expected to be more supportive of pacemaker activity (Singh et al., 2008) with 73.6% inactivation of in 30 ms. See also Table A6.
5.3 Biophysical properties: activation and VDI
In Table A6 are listed some of the available data on voltage-dependent activation and inactivation for examples of the four main subtypes. As pointed out in the Introduction, there are no definitive results for each subtype because of the modulatory effects of other subunits and varying experimental conditions such as the use of different hosts and different ionic concentrations. That is, one can expect considerable variability in channel properties for a given subtype from different preparations. As seen in the examples shown in Figure 3, channels can have quite low activation thresholds compared to the subtype and which are, in the data given here, similar to that of T-type. The latter have strong VDI whereas currents are reported to have have weak VDI and strong CDI (Lipscombe, 2002). Very few modeling studies have distinguished subtypes, an exception being Shapiro and Lee (2007). It is also apparent from the steady state inactivation function for shown in Figure 3, based on Hu and Marban (1998), that virtually no channels would be available to open around resting membrane potential (about -60 mV).
In a pioneering study using tsA201 cells, Koschak et al. (2001) determined electrophysiological properties for and (see Table A6) with current densities of 24.5 and 24.3 pA/pF, respectively, in 15 mM Ba2+. Generally in the cases reported has faster kinetics than (Helton et al., 2005) which is seen in the data of Table 6 and Figure 12. Inspection of Table A6 reveals surprisingly that is lower in the example for than for , but that is higher for than for . Unfortunately the incompleteness of the data for all subtypes prevents a quantitative comparison of their relative current amplitudes, either singly or in combinations. Such a program will be useful for future work when more data are available.
| Reference | ||||
|---|---|---|---|---|
| Koschak (2001) | 2.3 ms | 1.2 ms | ||
| 15mM Ba++ | 15mM Ba++ | |||
| Hildebrand (2004) | Control | 1.34 ms | ||
| 2mM Ba++ | 10 M allethrin | 1.23 ms | ||
| Catterall (2005) | 50 ms | 1 ms | 1 ms | 1 ms |
| 10 mV | 10 mV | 10 mV | ||
| Helton (2005) | ||||
| Shapiro (2007) | Model, MN | 30 ms | 24 ms | |
| Luin (2008) | young 53.6* | |||
| old 62.5* |
There are only limited data on activation time constants for L-channel subtypes, some being given in Table 6. Those for and are graphed in Figure 12. Data from Koschak et al. (2001) are for tsA201 cells. The data of Helton et al. (2005) were given over the membrane potential ranges for and for . The following expression was employed by Putzier et al. (2009a) for the activation time constant of :
| (24) |
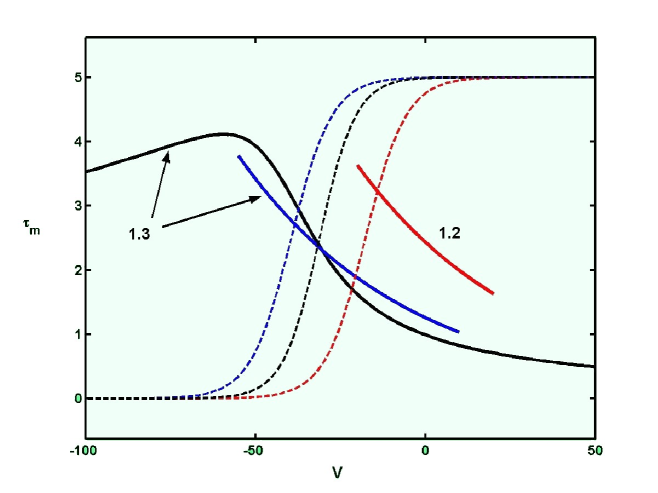
This function is plotted in Figure 12 and can be seen to be approximately the same as the function given by Helton et al. (2005) over the range . Also shown for comparison in Figure 12 are the steady state activations corresponding to the three graphs of versus .
5.4 Pathologies linked to and channels
Several pathologies have been linked to and channels. Examples include autism, bipolar disorder, and Parkinson’s disease (Andrade et al., 2009). On the other hand, and were shown to not be directly related to absence epileptogenesis (Weiergräber et al., 2010). Mutations of have been found to result in Timothy syndrome (Splawski et al., 2004), which is a multi-organ disease manifesting in cardiac arrythmias, metabolic and immune system deficiencies and autism. It has been posited (Barrett and Tsien, 2008; Yarotskyy et al., 2009) that strongly decreased voltage-dependent inactivation, but not CDI, associated with the mutant channel subtype is a possible underlying cause. Alterations in L-channel density and activity have been found in aged rat hippocampal neurons with the possibility of a role in cognitive decline and the occurrence of Alzheimer’s disease (Thibault and Landfield, 1996; Thibault et al., 2001, 2007; Norris et al., 2010). The expression of amyloid precursor protein was shown to increase L-type currents, thus leading to the inhibition of calcium oscillations (Santos et al., 2009). Further, performance of rats in a maze task was found to be strikingly negatively correlated with L-channel density (Thibault and Landfield, 1996).
Altered properties of L-type calcium channels have also been implicated in muscular dystrophy (Collet et al., 2003) and epilepsy (Fuller-Bicer et al., 2009). N’Gouemo et al. (2009) found upregulation of various high threshold calcium currents including in rat models of epilepsy.
The role of in pacemaking in sino-atrial node and inner hair cells of the cochlea has been demonstrated in KO mice which exhibit significant sinus bradycardia and hearing loss (see Lipscombe et al., 2004). Striessnig et al. (2004) reviewed the role of L-type calcium channels in human disease caused by genetic channel defects (channelopathies) in subunits. Recently it has been demonstrated in humans that a mutation in a gene which encodes the -subunit of channels is associated with deafness and sino-atrial node dysfunction (Baig et al., 2010). The possibility and usefulness of subtype-specific therapeutic drugs has been discussed in Striessnig et al. (2006) and more recently in Zuccotti et al. (2011). A comprehensive review of L-subtype properties (and other calcium currents) and associated channelopathies was compiled by Piedras-Rentería et al. (2007).
6 Concluding remarks
L-type currents have many fundamental roles, including providing basic depolarization in action potential generation, amplification of synaptic inputs (established in spinal motoneurons) and involvement in signaling pathways for activating transcription factors such as CREB and hence the expression of genes that are essential for synaptic plasticity and other important cellular processes. L-type channels are also involved in -signaling in immune cells
Quantitative descriptions of L-type currents thus play an important role in understanding the dynamics of many processes in neurons and other cells, particularly cardiac myocytes. We have here reviewed the basic deterministic methods for a mathematical description of these currents. Whereas activation is usually taken to be voltage dependent, inactivation has varying degrees of CDI and VDI and each cell type requires a separate analysis of their relative contributions, which requires experimental investigation in addition to fundamental current-voltage relations. Incorporating L-type currents in a neuronal model is often hampered by lack of knowledge as to the location of the corresponding ion channels, which is important to ascertain their contributions to cell dynamics. An additional complication is that some cells have more than 1 subtype of L-type channels with separate properties and locations.
The use of Markov chain theory, not described here, for transitions between various channel states has proven useful for cardiac cells but as far as can be discerned has not yet been applied to L-type channels in neurons. The deterministic, or averaging approach, outlined in this review has the advantage of simplicity and is thus likely to continue to be employed in modeling L-type (and other) calcium currents in multi-component nerve cell models. It is nevertheless not capable of capturing the fine details of the gating schemes for the activation and inactivation processes (Peterson et al., 1999; Erickson et al., 2003; Tanskanen et al., 2005; Tadross and Yue, 2010; Williams et al., 2010) which are made complicated by the roles of subunits and the varying degrees of voltage-dependent and calcium-dependent dynamics. See also Section 4.4 for a discussion of some of the general difficulties encountered in constructing accurate mathematical models for neurons.
7 Acknowledgements
I am grateful to Professor Nicholas Penington, Physiology and Pharmacology, SUNY Downstate Medical Center, Brooklyn, for useful comments on the manuscript and for valuable references, and to Professor Annette Dolphin, Department of Neuroscience, University College London, for permission to reprint Figure 1. The referees’ remarks were an invaluable source of improvement and gave rise to a more complete content. Support from the Max Planck Institute is appreciated.
8 Appendix: Tables of data on L-type currents
The following tables are representative of experimental and modeling studies involving L-type calcium currents or calcium currents with properties similar to (or claimed to be similar) to L-type. In the years following the introduction of the term L-type, the term was often taken to imply a high threshold current, although later some L-type currents were found to be activated at quite low membrane potentials. The pharmacological distinction between the various types is desirable but has not always been possible. Except in the case of experiments on subtypes which are clearly identified, usually in transfected cells, original sources may be consulted to determine the likelihood that the ion channels under consideration belong to the L-type category. Table A1.1 contains activation and inactivation data and modeling studies as opposed to experimental determinations have been marked M. Table A3 on time constants has been divided into an experimental part and a modeling part.
Table A1.1
Parameters for L-type Ca2+ activation and, if included, VDI
Non cardiac cells *Denotes estimated M denotes model
| Source, cell type | Form for current | ||||
|---|---|---|---|---|---|
| if given | |||||
| Fox (1987) | 2 | 4 | -40 | 8 | |
| Chick DRG, 10mM | |||||
| Kay (1987) | -19 | 7.73 | |||
| CA1 pyramidal, 2mM | |||||
| Fisher (1990) | 17 | 4.7 | |||
| CA3 pyramidal, 100mM Ba2+ | |||||
| Belluzzi (1991) | , const. field | -8.1 | 9.85 | -19.91 | 4.5 |
| SYMP N, 5mM | |||||
| Sala (1991) | -4 | 9.7 | |||
| SYMP N, 4mM | |||||
| Thompson (1991) | -78 | 9.9 | |||
| CA1 pyramidal, 3-10mM Ba2+ | |||||
| Traub (1991), M | -19 | 7.73 | |||
| CA3 pyramidal, =140 | |||||
| McCormick (1992), M | , const. field | -14.1* | 8.7* | ||
| TR cell, 2mM | |||||
| Schild (1993), M† | -2.8 | 9.85 | -14.61 | 4.5 | |
| Rat med, 2.4mM | |||||
| Hutcheon (1994), M | , const. field | -14 | 9.1 | ||
| TR med dors, 2mM | |||||
| Jaffe (1994), M | , const. field | 4 | 4.7 | ||
| CA3 pyramidal | |||||
| Traub (1994), M | -19 | 7.73 | |||
| CA3 pyramidal, 2mM | |||||
| Wallenstein (1994), M | , const. field | -14.1 | 8.7 | ||
| NRT N, 2mM | |||||
| Johnston (1995) | , const. field | -15 | |||
| General | |||||
| Kuryshev (1995) | -12.3 | 7.8 | |||
| Rat corticotropes, 10mM Ba2+ | |||||
| Migliore (1995), M | -11.3 | 5.7 | |||
| CA3 pyramidal, 2mM |
Table A1.1 continued
| Source, cell type | Form for current | ||||
|---|---|---|---|---|---|
| if given | |||||
| Magee (1995) | 9 | 6 | |||
| CA1 pyramidal, 20mM Ba2+ | |||||
| Avery (1996) | -30 | 6 | |||
| CA3 pyramidal, 2 mM | |||||
| Li (1996), M | -20.0 | 5.3 | |||
| DA SN, =120 | |||||
| LeBeau (1997), M | , const. field | -12 | 12 | ||
| PC | |||||
| Booth (1997), M | -40 | 7 | |||
| Spinal, =80 | |||||
| Wang (1998), M | -20 | 9 | |||
| CORT pyramid, =120 | |||||
| Molitor (1999) | -10 | 8 | |||
| DCN N, 10mM Ba2+ | |||||
| Athanasiades (2000), M | -22.8 | 9.85 | -34.61 | 4.5 | |
| MR, 2.4 mM | |||||
| Guyot(2000) | -15 | 6 | -33.5 | 4.5 | |
| Bovine adrenal, 20mM Ba2+ | |||||
| Shorten (2000), M | , const. field | -18 | 12 | ||
| PC, 20 mM | |||||
| Carlin (2000), M (HVA) | -10 | 6 | |||
| Carlin (2000), M (LVA) | -30 | 6 | |||
| Spinal MN, =60 | |||||
| Joux (2001) | -27.3 | ||||
| SON, 5mM (Double Bolt) | -12.4 | ||||
| Zhuravleva (2001) | -43.4 | 5.0 | -78.2 | 11.5 | |
| LD thalamic N, 10mM Ba2+ | |||||
| Collet (2003) | -1.1 | 6.7 | control | ||
| Mouse, SM, 2.5 mM | -6.4 | 6.2 | mdx | ||
| Schnee (2003) | -35 | 4.7 | high frequ | ||
| Turtle AHC, 2.8 mM | -43 | 4.2 | low frequ | ||
| Durante (2004) | -31.1 | 5.5∗ | |||
| Rat DA SNc, 2mM | |||||
| Muinuddin (2004) | distal | -7.8 | 16.8 | -33.4 | 11.6 |
| Cat SMM, 20mM Ba2+ | proximal | -6.1 | 17.3 | -36.5 | 13.2 |
| Jackson (2004) | -36 | 5.1 | |||
| Dorsomedial SCN, 1.2 mM |
Table A1.1 continued
| Source, cell type | Form for current | ||||
|---|---|---|---|---|---|
| if given | |||||
| Liu (2005) | -16.6 | 2.45 | -16.8 | 5.95 | |
| Rat IC, 2 mM | |||||
| Bui (2006), M | -33 | 6 | |||
| Spinal MN, =60 | |||||
| Marcantoni (2007) | -30* | 9* | |||
| Adrenal CH cells, 2 mM | |||||
| Kager (2007), M | -11.3 | 5.7 | |||
| CA3 pyramidal, 1.5 mM | |||||
| Kapela (2008), M | const. field | -40† | 8.3 | -42 | 9.1 |
| Mesenteric SMM, 2.5 mM | Printed as 0 | ||||
| Luin (2008) | young | 8.73 | 7.72 | -5.77 | 7.30 |
| Cultured human SM, 10 mM | old | 14.47 | 7.74 | 2.38 | 10.1 |
| Pospischil (2008), M | -33.4 | 4.45 | -58.5 | 20.28 | |
| TR, CORT, =120 | |||||
| Xiang (2008) | -6 | 16.7 | -30.5 | 11.2 | |
| CA1 pyramidal, 5 mM | |||||
| Marcantoni (2009) | -15 | 11∗ | |||
| Adrenal CH cells, 2 mM | |||||
| Marcantoni (2010) | -23 (WT) | 6.9 | |||
| Adrenal CH cells, 2 mM | -18.1(KO) | 7.9 | |||
| Adrenal CH cells, 2 mM |
Table A1.2
Parameters for L-type Ca2+ activation and, if included, VDI
Cardiac cells
| Source, cell type | Form for current | ||||
| if given | |||||
| Lindblad (1996), M | ( | -0.95(1) | 6.6(1) | -28 | 4.52 |
| Rabbit AM, 2.5 mM | -33 (2) | 12(2) | |||
| Handrock (1998) | -3.5 | 4.9 | -60 | 7.5 | |
| Failing human VM, 1 mM | |||||
| Van Wagoner (1999) | -14* | 7.75* | -31.7 | 4.6 | |
| Human AM, 1 mM | |||||
| Donohoe (2000) | -25.9 | ||||
| Rat VM, 1 mM | -25.1 RF | ||||
| Zhang (2000), M | -23.1 (1) | 6 | -45 | 5 | |
| Rabbit SA PM, 2 mM | -14.1 (2) | 6 | |||
| Arikawa (2002) | (Control) | -10.7 | 6.2 | -28.2 | 6.2 |
| Rat VM | (Diabetic) | -11.5 | 6.0 | -27.2 | 6.4 |
| Mangoni (2003) | -25 | -45 | 10 | ||
| Mouse SA PM, 4 mM | |||||
| Mangoni (2003) | -3 | -36 | 4.6 | ||
| Mouse SA PM 1.3KO | |||||
| Benitah (2010) | -15 | 8.5∗ | -35 | 5.95 ∗ | |
| VM, 1.5 mM |
Table A1.3
Parameters for L-type Ca2+ current activation, VDI and/or CDI.
Neurons and secretory cells Source, cell type Form for current and/or equation for Amini (1999), M -50 3 MID DA, 2.4 mM Rhodes (2001), M -19.3 † 7.5 -42 8 CORT pyramidal Poirazi (2003),M const. field -30.1 4.8 CA1 pyramidal soma Komendantov (2004) -50 20 MID DA, 2.4 mM Rhodes (2005), M -19† 8 -42 8 TR, =60 Komendantov (2007), M -27 4.5 Mag Endocrine, 2.4mM
Table A1.4
Parameters for L-type Ca2+ current activation, VDI and/or CDI
Cardiac and skeletal muscle cells Source, cell type Form for and/or current equation for Standen (1982), M -21.1 4.69 Insect SM, const. field = shell conc Luo (1994), M -10 6.24 VM, 1.8 mM const. field Fox (2002), M -10 6.24 -12.5 5 VM, 2 mM const. field Shiferaw (2003), M 5 6.24 -35 8.6 VM, 1.8 mM const. field Shannon (2004), M -14.5 6 -34.9* 3.7 VM, 1.8 mM const. field Stewart (2009), M -8 7.5 -20 7 PF, 2 mM const. field See source for details
Table A2
Forward and backward rate functions, and for , and, if given,
All cell types Source, cell type , Standen (1982) Insect SM, Kay (1987) CA1 pyramidal Sala (1991) SYMP N, 4mM McCormick (1992) TR N Hutcheon (1994) TR N med dors Rybak (1997) Respiratory N Lindblad (1996) a=1.5, b= 211 Rabbit AM c=-37.427 d=20.213 Athanasiades (2000) MR Rhodes (2001) CORT pyramid Poirazi (2003) CA1 pyramidal, soma Kager (2007) CA3 pyramidal Pospischil (2008) TR, CORT
Table A3 - Experimental
Time constants for L-type activation and, if included, VDI
All cell types Source, cell type Standen (1982) 19.82 -28 Insect SM, Kay (1987) 1.5-2.07 -18 Insect SM, Belluzzi (1991) 0.564 -8.0 29.90 -22 SYMP N Sala (1991) 1.16 1 SYMP N Thompson (1991) 100 CA1 pyramidal Avery (1996) 2.3 CA3 pyramidal Molitor (1999) 1.5 -10 DCN N Donohoe (2000) , at 0 mV Rat VM , RF Muinuddin (2000) 4.0 ms distal , Cat SMM, 20mM Ba2+ 4.2 ms proximal , Schnee (2003) 0.5 Turtle AHC Jackson (2004) 2 Dorsomedial SCN Luin (2008) young 53.6* Cultured human SM old 62.5*
Table A3 - Modeling
Time constants for L-type activation and, if included, VDI
All cell types Source, cell type Traub (1991, 1994) 2.11 -18 CA3 pyramid McCormick (1992) 1.541 -15 TR neuron Luo (1994) 2.23 -10 25.2 -10 VM Min not max Hutcheon (1994) 1.541 -15 TR med dors Jaffe (1994) 1.5 CA3 pyramidal Wallenstein (1994) 1.541 -15 NRT N Migliore (1995) 4.56 -11 CA3 pyramidal Li (1996) 0.134 4 DA SN Lindblad (1996) 4.7 -39 226 -37.4 Rabbit AM LeBeau (1997) 27 (all ) PC Booth (1997) 40 (all ) Spinal MN Amini (1999) 19.5 -45 CDI only MID DA Athanasiades (2000) 0.563 -28 29.9 -42 MR Zhang (2000) 3.8 -37 40 -28 Rabbit SA PM Shorten (2000) 11.32 -12 PC Carlin (2000) (HVA) 20, all V -10 Carlin (2000) (LVA) 20, all V -30 Spinal MN Rhodes (2001) 2.1 -18 20.0 CORT pyramid Fox (2002) 19.3 -33 230 VM
Table A3 - Modeling, continued
| Source, cell type | ||||
|---|---|---|---|---|
| Poirazi (2003) | 0.826 | -35 | 4.8 | |
| CA1 pyramidal soma | ||||
| Komendantov (2004) | 19.5 | -45 | CDI only | |
| MID DA | ||||
| Shannon (2004) | 2.38 | -15 | 25.2 | -15 |
| VM | Min not max | |||
| Rhodes (2005) | 2.1 | -19 | 200, all V | |
| TR N | ||||
| Bui (2006) | 20, all V | |||
| Spinal MN | ||||
| Komendantov (2007) | 0.9, all V | |||
| Mag Endocrine | ||||
| Pospischil (2008) | 7.04 | -38 | 449.8 | -67 |
| TR, CORT | ||||
| Kapela (2008) | 3.65 | -40 | 110 | -35 |
| Mesenteric SMM |
Table A4
Time constants if given by explicit formulas
All cell types Source, cell type Belluzzi (1991) SYMP N, 5mM Luo (1994)† VM Li (1996) , DA SN Amini (1999) Komendantov (2004) MID DA Shorten (2000), PC Fox (2002), VM Shannon (2004) VM a=0.02, b=0.0197 Rhodes (2005) 200 TR N Kapela (2008) Mesenteric SMM
Table A5
Magnitude of L-type currents or related quantities
All cell types Source, cell type L-type magnitude Remarks Penington (1991) 4% of total Soma, dissociated cells DRN SE McCormick (1992) 1pA/pF ∗, Dissociated cells TR N = 80.10-6 cm3/sec Schild (1993) mS/cm2 Cell, GL=0.075S, Rat med C=0.052 nF Hutcheon (1994) 1.3mS/cm2 as in McCormick(1992) TR med dors Kuryshev (1995) 52% of HVA is L-type 70pA Rat corticotropes 10mM Ba2+ Li (1996) 0.19 mS/ cm2 DA SN (dendrites) Booth (1997) 0.33 mS / cm2 Spinal MN (dendrites) Schröder (1998) 13.2 fA (control) Ensemble averages Human VM 38.2 fA (failing heart) single channel () Amini (1999) GL=0.0005S 30pA; gL=0.018 mS/ cm2 MID DA (sphere, rad 15 ) Van Wagoner (1999) 9.13 pA/pF 3.35 pA/pF Human AM (control) (atrial fibrillators) Athanasiades (2000) GL=0.075S gL=1.44 mS/cm2 MR cf Schild (1993) Carlin (2000) Spinal MN LVA & HVA, soma 10mS/ cm2 LVA & HVA, dend 0.3mS/ cm2 Donohoe (2000) 16.8 pA/pF at -10 mV Rat VM 18.3 pA/pF RF Joux (2001) 19.3 pA/pF SON Fox (2002) 1pA/pF, VM cm/ms Mangoni (2003) 3.32 pA/pF 1.05 pA/pF Mouse SA PM (wild type) (1.3 knockout) Poirazi (2003) 7 mS / cm2 CA1 pyramidal (soma)
Table A5 continued
| Source, cell type | L-type magnitude | Remarks |
| Tipparaju (2004) | 2.5 pA/pF | 1.2 pA/pF, 2.6 pA/pF |
| Human AM | Young adults | Infants, Older Adults |
| Durante (2004) | 27% of is L-type | |
| Rat DA SNc | ||
| Komendantov (2004) | 0.216 mS / cm2 | |
| MID DA | ||
| Rhodes (2005) | 4 mS / cm2 | |
| TR N soma | ||
| Vignali (2006) | 60% of is L-type | |
| Pancreatic A,B | ||
| Komendantov (2007) | 0.4 mS / cm2 | 0.22, 0.46 mS / cm2 |
| Mag Endocrine | (soma) | (prim., sec. dendrites) |
| Marcantoni (2007) | 10% of | 15 pA |
| Adrenal CH cells | -60 to -40 mV | |
| Kapela (2008) | 100% of is | |
| Mesenteric SMM | ||
| Xiang (2008) | 18.7 pA/pF | is mainly |
| CA1 pyramidal | (control) | |
| Fuller-Bicer (2009) | 5.76 pA/pF | 3.17 pA/pF |
| Mouse VM | WT | -1 KO |
| Benitah (2010) | is mainly | |
| VM | ||
| Empson (2010) | 5% of | Soma & dendrites |
| Purkinje neuron |
Table A6
Parameters for examples of L-type channel subtype activation and VDI Source Subtype , Carrier Koschak (2001) -3.9 7.8 -27.6 13.8 tsA201 15 mM -17.5 8.9 -42.7 6.6 15 mM Xu (2001) 3.3 Xenopus oocytes 5 mM -8.8 5 mM -20 5 mM -36.8 5 mM Schnee (2003) -35 4.7 high frequ Turtle AHC 2.8 mM -43 4.2 low frequ 2.8 mM Lipscombe (2004) -16.1 6∗ tsA201 -40.4 5.5∗ 2 mM Hildebrand (2004) -13.9 -33.7 control tsA201, 2 mM -52.5 allethrin Helton (2005) -17.6 tsA201 -39.4 2 mM Catterall (2005) 8 to 14 -8 10 mM -17 -60 to -50 HEK 2mM -60 to -50 -37 -43 to -36 HEK 2 mM -43 to -36 -2.5 to -12 -27 to -9 HEK 2 - 20 mM -27 to -9 Navedo (2007) 31.9 9.3 -2.7 5.2 110 mM tsA201 9.7 10.8 -18.7 3.5 Arterial SMM 33.8 8.0 -4.9 5.4 Shapiro (2007) -20 6 Model, MN -41 6
Table A6 continued
| Source | Subtype | , Carrier | |||
|---|---|---|---|---|---|
| Luin (2008) | 8.73 young | 7.72 | -5.77 | 7.30 | |
| Cultured human SM | (Assumed) | 10 mM | |||
| 14.47 old | 7.74 | 2.38 | 10.1 | ||
| Peloquin (2008) | 5 | 5.9 | |||
| tsA201 | 20 mM 23∘C | ||||
| -13 | 3.9 | ||||
| 20 mM 37∘C | |||||
| Singh (2008) | (42, long) | -2.2 | 9.1 | ||
| (42A, short) | -12.9 | 6.9 | |||
| 15 mM | |||||
| (42, long) | -11.8 | 7.8 | |||
| (42A, short) | -20.2 | 6.6 | |||
| 15 mM | |||||
| Fuller-Bicer (2009) | WT | -3.5 | 4.87 | -15.15 | 5.54 |
| Mouse VM | -1 KO | 4.66 | 5.88 | -2.18 | 6.14 |
| 1.8 mM | |||||
| Putzier (2009a) | -31.1 | 5.35 | |||
| Cordeiro (2009) | WT | 1.5 | -24.8 | 9.13 | |
| tsA201 | B mutant | 3.5 | -30.0 | 6.25 | |
| 15 mM | |||||
| Gebhart (2010) | -0.9 | 9 | |||
| tsA201 | 15mM |
9 References
Albrecht MA, Colegrove SL, Hongpaisan J, Pivovarova NB, Andrews SB, and Friel DD (2001). Multiple modes of calcium-induced calcium release in sympathetic neurons. I. Attenuation of endoplasmic reticulum accumulation at low []i during weak depolarization. J Gen Physiol 118: 83-100.
Amini B Clark JW Jr Canavier CC (1999) Calcium dynamics underlying pacemaker-like and burst firing oscillations in midbrain dopaminergic neurons: A computational study. J. Neurophysiol 82, 2249-2261.
Andrade A, Sandoval A, Ricardo González-Ramírez R, Lipscombe D, Campbell K, Felix R (2009) The subunit augments functional expression and modifies the pharmacology of L-type channels. Cell Calcium 46: 282-292.
Anwyl R (1991) Modulation of vertebrate neuronal calcium channels by transmitters. Brain Res 16: 265-281.
Arikawa M, Takahashi N, Kira T, Hara M, Saikawa T, Sakata T (2002) Enhanced inhibition of L-type calcium currents by troglitazone in streptozotocin-induced diabetic rat cardiac ventricular myocytes. Brit J Pharmacol 136: 803-810.
Athanasiades A, Clark JW Jr, Ghorbel F, Bidani A (2000) An ionic current model for medullary respiratory neurons. J Comp Neurosci 9, 237-257.
Augustine GJ, Santamaria F, Tanaka K (2003) Local calcium signaling in neurons. Neuron 40: 331-346.
Avery RB, Johnston D (1996) Multiple channel types contribute to the low-voltage-activated calcium current in hippocampal CA3 pyramidal neurons. J Neurosci 16: 5567-5582.
Baig S, Koschak A, Lieb A et al. (2010) Loss of (CACNA1D) function in a human channelopathy with bradycardia and congenital deafness. Nat Neurosci 14: 77-84.
Barrett CF, Tsien RW (2008) The Timothy syndrome mutation differentially affects voltage- and calcium-dependent inactivation of L-type calcium channels. PNAS 105: 2157-2162.
Bauer CS, Tran-Van-Minh A, Kadurin I, Dolphin AC (2010) A new look at calcium channel subunits. Curr Opion Neurobiol 20: 563-71.
Baumann L, Gerstner A, Zong X, Biel M, Wahl-Schott C (2004) Functional characterization of the L-type -channel from mouse retina. Invest Ophthal Vis Sci 45: 708-713.
Bazzazi H, Johnny MB, Yue DT (2010) Calmodulin release from the IQ Domain of channels during calcium dependent inactivation? Biophys J 98 Issue, Supp 1: 519a.
Bean BP (1989) Classes of calcium channels in vertebrate cells. Ann Rev Physiol 51:367-384.
Belluzzi O, Sacchi O (1991) A five-conductance model of the action potential in the rat sympathetic neurone. Prog Biophys Molec Biol 55: 1-30.
Benitah J-P Alvarez JL, Gómez AM (2010) L-type Ca2+ current in ventricular cardiomyocytes. J Mol Cel Cardiol 48: 26-36.
Bernstein J (1902) Untersuchungen zur Thermodynamik der biolektrischen Ströme. Arch Ges Physiol Pfug 92: 521-562.
Bers DM (2008) Calcium cycling and signaling in cardiac myocytes. Ann Rev Physiol 70:23-49.
Bidaud I, Lory P (2011) Hallmarks of the channelopathies associated with L-type calcium channels : A focus on the Timothy mutations in channels. Biochimie xxx: 1-7.
Blaustein MP (1988) Calcium transport and buffering in neurons. TINS 11: 438-443.
Blaustein MP, Lederer WJ (1999) Sodium/calcium exchange: its physiological implications. Physiol Rev 79: 763-854.
Bodi I, Mikala G, Koch SE, Akhter SA, Schwartz A (2005) The L-type calcium channel in the heart: the beat goes on. J Clin Invest 115: 3306-3317.
Booth VB, Rinzel J, Kiehn O (1997) Compartmental model of vertebrate motoneurons for Ca2+-dependent spiking and plateau potentials under pharmacological treatment. J Neurophysiol 78: 3371-3385.
Boyett MR, Clough A, Dekanski J, Holden AV (1997) Modelling cardiac excitation and excitability. In: Computational Biology of the Heart, pp 1-47. Eds Panfilov AV, Holden AV. Wiley, New York.
Brasen JC, Olsen LF, Hallett MB (2010) Cell surface topology creates high Ca2+ signalling microdomains. Cell Calcium 47: 339-349.
Brehm P, Eckert R (1978) Calcium entry leads to inactivation of calcium channel in Paramecium. Science 202: 1203-1206.
Brette F, Leroy J, Le Guennec JY, Salle L (2006) currents in cardiac myocytes: old story, new insights. Prog Biophys Mol Biol 91: 1-82.
Brown TM, Piggins HD (2007) Electrophysiology of the suprachiasmatic circadian clock. Prog Neurobiol 82: 229-255.
Budde T, Meuth S, Pape H-C (2002) Calcium-dependent inactivation of neuronal calcium channels. Nat Rev Neurosci 3: 873-883.
Bui TV, Ter-Mikaelian M, Bedrossian D, Rose PK (2006) Computational estimation of the distribution of L-type Ca2+ channels in motoneurons based on variable threshold of activation of persistent inward currents. J Neurophysiol 95: 225-241.
Carlin KP, Jones KE, Jiang Z, Jordan LM, Brownstone, RM (2000) Dendritic L-type calcium currents in mouse spinal motoneurons: implications for bistability. Eur J Neurosci 12: 1635-1646.
Catterall WA (1995) Structure and function of voltage-gated ion channels. Ann Rev Biochem 64:493-531.
Catterall WA (2000) Structure and regulation of voltage-gated Ca2+ channels. Ann Rev Cell Dev Biol 16:521-555.
Catterall WA (2010) Voltage-gated calcium channels. Handbook of Cell Signaling, Ch 112, pp 897-909. Elsevier, Amsterdam.
Catterall WA, Perez-Reyes E, Snutch TP, Striessnig J (2005) International Union of Pharmacology. XLVIII. Nomenclature and structure-function relationships of voltage-gated calcium channels. Pharmacol Rev 57:411-425.
Cens T, Rousset M, Leyris J-P, Fesquet P, Charnet P (2006) Voltage- and calcium-dependent inactivation in high voltage-gated Ca2+ channels. Prog Biophys Mol Biol 90: 104-117.
Chameau P, Qin Y, Spijker S, Smit G, Joëls M (2007) Glucocorticoids specifically snhance L-type calcium current amplitude and affect calcium channel subunit expression in the mouse hippocampus. J Neurophysiol 97: 5-14.
Chavis P, Fagni L, Lansman JB, Bockaert J (1996) Functional coupling between ryanodine receptors and L-type calcium channels in neurons. Nature 382: 719-722.
Collet C, Csernoch L, Jacquemond V (2003) Intramembrane charge movement and l-type calcium current in skeletal muscle fibers isolated from control and mdx mice. Biophys J 84: 251-265.
Coombes S, Hinch R, Timofeeva Y (2004) Receptors, sparks and waves in a fire-diffuse-fire framework for calcium release. Prog Biophys Mol Biol 85: 197-216.
CooperJR, Bloom FE, Roth RH (2003) The Biochemical Basis of Neuropharmacology. Oxford University Press: Oxford.
Cordeiro JM, Marieb M, Pfeiffer R, Calloe K, Burashnikov E, Antzelevitch C (2009) Accelerated inactivation of the L-type calcium current due to a mutation in CACNB2b underlies Brugada syndrome. J Mol Cell Cardiol 46: 695-703.
Coulon P, Herr D, Kanyshkova T, Meuth P, Budde T, Pape H-C (2009). Burst discharges in neurons of the thalamic reticular nucleus are shaped by calcium-induced calcium release. Cell Calcium 46: 333-346.
Cox DH, Dunlap K (1994) Inactivation of N-type calcium current in chick sensory neurons: calcium and voltage dependence. J Gen Physiol 104: 311-366.
Crump SM, Schroder EA, Sievert GA, Andres DA, Satin J (2011) Calmodulin interferes with C-terminal regulation of L-type channel current. Biophys J 100, Supp 1: 571a.
Cueni L, Canepari M, Adelman JP, Lüthi A (2009) signaling by T-type channels in neurons. Pflugers Arch 457:1161-1172.
Davies A, Kadurin I, Alvarez-Laviada A, Douglas L, Nieto-Rostro M, Bauer CS, Pratt WS, Dolphin AC (2010) The subunits of voltage-gated calcium channels form GPI-anchored proteins, a posttranslational modification essential for function. PNAS 107: 1654-1659.
Destexhe A, Sejnowski TJ (2001) Thalamocortical Assemblies. Oxford University Press: Oxford, UK.
De Waard M, Gurnett CA, Campbell KP (1996) Structural and functional diversity of voltage-gated calcium channels. Ion Channels 4: 41-87.
DiFrancesco D, Noble D (1985) A model of cardiac electrical activity incorporating ionic pumps and concentration changes. Phil Trans R Soc Lond B 307: 353-398.
Doan L (2010) Voltage-gated calcium channels and pain. Tech Reg Anesth Pain Manag 14: 42-47.
Dolmetsch RE, Pajvani U, Fife K, Spotts JM, Greenberg ME (2001) Signaling to the nucleus by an L-type Calcium channel- calmodulin complex through the MAP kinase pathway. Science 294: 333-339.
Dolphin AC (2003) subunits of voltage-gated calcium channels. J Bioenerg Biomembr 35:599-620.
Dolphin AC (2006) A short history of voltage-gated calcium channels. Br J Pharmacol 147(S1): S56-S62.
Dolphin, AC (2009) Calcium channel diversity: multiple roles of calcium channel subunits. Curr Opin Neurobiol 19:237-244.
Dolphin AC (2010) Age of quantitative proteomics hits voltage-gated calcium channels. PNAS 107: 14941-14942.
Donohoe P, McMahon AC, Walgama OV et al. (2000) L-type calcium current of isolated rat cardiac myocytes in experimental uraemia. Nephrol Dial Transplant 15: 791-798.
Durante P, Cardenas CG, Whittaker JA, Kitai ST, Scroggs RS (2004) Low-threshold L-type calcium channels in rat dopamine neurons. J Neurophysiol 91: 1450-1454.
Empson RM, Knöpfel T (2010) Functional integration of calcium regulatory mechanisms at Purkinje neuron synapses. Cerebellum 10: online.
Erickson Mg, Liang H, Mori MX, Yue DT (2003) FRET two-hybrid mapping reveals function and location of L-type Ca2+ channel CaM preassociation. Neuron 39: 97-107.
Ertel EA, Campbell KP, Harpold MM, Hofmann F, Mori Y, Perez-Reyes E, Schwartz A, Snutch TP, Tanabe T, Birnbaumer L, et al. (2000) Nomenclature of voltagegated calcium channels. Neuron 25:533-535.
Faber ESL (2010) Functional interplay between NMDA receptors, SK channels and voltage-gated channels regulates synaptic excitability in the medial prefrontal cortex. J Physiol 588.8: 1281-1292.
Faber GM, Silva J, Livshitz L, Rudy Y (2007) Kinetic properties of the cardiac L-Type Ca2+ Channel and Its role in myocyte electrophysiology: a theoretical investigation. Biophys J 92: 1522-1543.
Findlay I, Suzuki S, Murakami S, Kurachi Y (2008) Physiological modulation of voltage-dependent inactivation in the cardiac muscle L-type calcium channel: a modelling study. Prog Biophys Mol Biol 96: 482-498.
Fink M, Niederer SA, Cherry EM et al. (2011) Cardiac cell modelling: observations from the heart of the cardiac physiome project. Prog Biophys Mol Biol 104: 2-21.
Fisher RE, Gray R, Johnston D (1990) Properties and distribution of single voltage-gated calcium channels in adult hippocampal neurons. J Neurophysiol 64: 91-104.
Forti L, Pietrobon D (1993) Functional diversity of L-type calcium channels in rat cerebellar neurons. Neuron 10: 437-450.
Fox AP Nowycky MC Tsien RW (1987) Kinetic and pharmacological properties distinguishing three types of calcium currents in chick sensory neurones. J Physiol 394: 149-172.
Fox JJ, McHarg JL, Gilmour RF Jr (2002) Ionic mechansim of electrical alternans. Am J Physiol Heart Circ Physiol 282: H516-H530.
Friel DD, Chiel HJ (2008) Calcium dynamics: analyzing the regulatory network in intact cells. TINS 31: 8-19.
Friel DD, Tsien RW (1992) A caffeine- and ryanodine-sensitive store in bullfrog sympathetic neurones modulates effects of entry. J Physiol 450: 217-246.
Fuller-Bicer GA, Varadi G, Koch SE et al. (2009) Targeted disruption of the voltage-dependent calcium channel -1-subunit. Am J Physiol Heart Circ Physiol 297: H117-H124.
Gebhart M, Juhasz-Vedresa G, Zuccotti A et al. (2010) Modulation of channel gating by Rab3 interacting molecule. Mol Cell Neurosci 44: 246-259.
Graef IA, Mermelstein PG, Stankunas K, Neilson JR, Deisseroth K, Tsien RW, Crabtree GR (1999) L-type calcium channels and GSK-3 regulate the activity of NF-ATc4 in hippocampal neurons. Nature 401: 703-708.
Grandi E, Morotti S, Ginsburg KS, Severi S, Bers DM (2010) Interplay of voltage and Ca-dependent inactivation of L-type Ca current. Prog Biophys Mol Biol 103: 44-50.
Greenstein JL, Hinch R, Winslow RL (2006) Mechanisms of excitation-contraction coupling in an integrative model of the cardiac ventricular myocyte. Biophys J 90: 77-91.
Groff JR, Smith GD (2008) Calcium-dependent inactivation and the dynamics of calcium puffs and sparks. J Theor Biol 252: 483-499.
Guyot A, Dupré-Aucouturier S, Ojeda C, Rougier O, Bilbaut A (2000) Two types of pharmacologically distinct currents with voltage-dependent similarities in zona fasciculata cells isolated from bovine adrenal gland. J Membrane Biol 173: 149-163.
Habermann CJ, O’Brien BJ, Wässle H, and Protti DA (2003) AII amacrine cells express L-type calcium channels at their output synapses. J Neurosci 17: 6904-6913.
Hamill OP, Marty A, Neher E, Sakmann B, Sigworth FJ (1981) Improved patch-clamp techniques for high-resolution current recording from cells and cell-free membrane patches. Pflügers Arch 391: 85-100.
Handrock R, Schröder F, Hirt S, Haverich A, Mittmann C, Hrzig S (1998) Single-channel properties of L-type calcium channels from failing human ventricle. Cardiovasc Res 37: 445-455.
Hardingham GE, Arnold FJL, Bading H (2001) Nuclear calcium signaling controls CREB-mediated gene expression triggered by synaptic activity. Nat Neurosci 4: 261-267.
Hell JW, Westenbroek RE, Warner C, Ahlijanian MK, Prystay W, Gilbert MM, Snutch TP, Catterall WA (1993) Identification and differential subcellular localization of the neuronal class C and class D L-type calcium channel alpha 1 subunits. J Cell Biol 123: 949-962.
Helton TD, Xu W, Lipscombe D (2005) Neuronal L-Type calcium channels open quickly and are inhibited slowly. J Neurosci 25:10247-10251.
Higgins ER, Goel P, Puglisi JL, Bers DM, Cannell M, Sneyd J (2007) Modelling calcium microdomains using homogenisation. J Theor Biol 247: 623-644.
Hildebrand ME, McRory JE, Snutch TP, Stea A (2004) Mammalian voltage-gated calcium channels are potently blocked by the pyrethroid insecticide allethrin. J Pharmacol Exp Ther 308: 805-813.
Hinch R, Greenstein JL, Tanskanen AJ, Xu L, Winslow RL (2004) A simplified local control model of calcium-induced calcium release in cardiac ventricular myocytes. Biophys J 87: 3723-3736.
Hodgkin AL, Huxley AF (1952) A quantitative description of membrane current and its application to conduction and excitation in nerve. J Physiol 117: 500-544.
Hoesch RE, Weinreich D, Kao JPY (2001) A novel influx pathway in mammalian primary sensory neurons is activated by caffeine. J Neurophysiol 86: 190-196.
Höfer GF, Hohenthanner K, Baumgartner W, Groschner K, Klugbauer N, Hofmann F, Romanin C (1997) intracellular Ca2+ inactivates L-Type Ca2+ channels with a Hill coefficient of 1 and an inhibition constant of 4 M by reducing channel’s open probability. Biophys J 73: 1857-1865.
Hofmann F, Lacinová, L, Klugbauer N (1999) Voltage-dependent calcium channels: from structure to function. Rev Physiol Biochem Pharmacol 139: 33-87.
Holmgaard K, Jensen K, Lambert JDC (2008) Imaging of Ca2+ responses mediated by presynaptic L-type channels on GABAergic boutons of cultured hippocampal neurons. Brain Res 1249: 79-90.
Hutcheon B, Miura RM, Yarom Y, Puil E (1994) Low-threshold calcium current and resonance in thalamic neurons: a model of frequency preference. J Neurophysiol 71: 583-594.
Hu H, Marban E (1998) Isoform-specific inhibition of L-type calcium channels by dihydropyridines is independent of isoform-specific gating properties. Molec Pharmacol 53: 902-907.
Huxley AF (1959) Ion movements during nerve activity. Ann NY Acad Sci 81: 221-246.
Imredy JP, Yue DT (1994) Mechanism of Ca2+-sensitive inactivation of L-type Ca2+ channels. Neuron 12: 1301-1318.
Jackson AC, Yao GL, Bean BP (2004) Mechanism of spontaneous f iring in dorsomedial suprachiasmatic nucleus neurons. J Neurosci 24: 7985-7998.
Jaffe DB, Ross WN, Lisman JE, Lasser-Ross N, Miyakawa H, Johnston D (1994) A model for dendritic accumulation in hippocampal pyramidal neurons based on fluorescence imaging measurements. J Neurophysiol 71: 1065-1077.
Jafri MS, Rice JJ, Winslow RL (1998) Cardiac Ca2+ dynamics: the roles of ryanodine receptor adaptation and sarcoplasmic reticulum load. Biophys J 74: 1149-1168.
Johnston D, Wu S (1995) Foundations of Cellular Neurophysiology. MIT Press: Cambridge, MA.
Jones SW (1998) Overview of voltage-dependent calcium channels. J Bioenerg Biomemb 30: 299-312.
Joux N Chevaleyre V Alonso G et al. (2001) High voltage-activated Ca2+ currents in rat supraoptic neurones: biophysical properties and expression of the various channel subunits. J Neuroendocrinol 13, 638-649.
Kager H, Wadman WJ, Somjen GG (2007) Seizure-like afterdischarges simulated in a model neuron. J Comp Neurosci 22:105-128.
Kamp TJ, Hell JW (2000) Regulation of cardiac L-type calcium channels by protein kinase A and protein kinase C. Circ Res 87:1095-1102.
Kapela A, Bezerianos A, Tsoukias M (2008) A mathematical model of Ca2+ dynamics in rat mesenteric smooth muscle cell: agonist and NO stimulation. J Theor Biol 253: 238-260.
Kapur A, Yeckel MF, Gray R, Johnston D (1998) L-type calcium channels are required for one form of hippocampal mossy fiber LTP. J Neurophysiol 79: 2181-2190.
Kay AR (1991) Inactivation kinetics of calcium current of acutely dissociated CA1 pyramidal cells of the mature guinea-pig hippocampus. J Physiol 437: 27-48.
Kay AR, Wong RKS (1987) Calcium current activation kinetics in isolated pyramidal neurons of the CA1 region of the mature guinea-pig hippocampus. J Physiol 392: 603-616.
Koch C (1999) Biophysics of Computation. Oxford University Press: Oxford UK.
Koh X, Srinivasan B, Ching HS, Levchenko A (2006) A 3D Monte Carlo analysis of the role of dyadic space geometry in spark generation. Biophys J 90: 1999-2014.
Komendantov AO, Komendantova OG, Johnson SW, Canavier CC (2004) A modeling study suggests complementary roles for GABAA and NMDA receptors and the SK channel in regulating the firing pattern in midbrain dopamine neurons. J Neurophysiol 91: 346-357.
Komendantov AO Trayanova NA Tasker JG (2007) Somato-dendritic mechanisms underlying the electrophysiological properties of hypothalamic magnocellular neuroendocrine cells: A multicompartmental model study. J Comp Neurosci 23,143-168.
Koschak A, Reimer D, Huber I et al. (2001) () subunits can form L-type channels activating at negative voltages. J Biol Chem 276: 22100-22106.
Koschak A, Reimer D, Walter D et al. (2003) subunits can form slowly inactivating dihydropyridine-sensitive L-type channels lacking -dependent inactivation. J Neurosci 23: 6041-6049.
Kotturi MF, Jefferies WA (2005). Molecular characterization of L-type calcium channel splice variants expressed in human T lymphocytes. Mol Immunol 42: 1461-1474.
Kuryshev YA, Childs GV, Ritchie AK (1995) Three high threshold calcium channel subtypes in rat corticotropes. Endocrinology 136: 3916-3924.
Lacinová L (2005) Voltage-dependent calcium channels. Gen Physiol Biophys 24 (Suppl. 1): 1-78.
Lacinová L, Hofmann F (2005) Ca2+- and voltage-dependent inactivation of the expressed L-type Cav1.2 calcium channel. Arch Biochem Biophys 437: 42-50.
LeBeau AP, Robson AB, McKinnon AE, Donald RA, Sneyd J (1997) Generation of action potentials in a mathematical model of corticotrophs. Biophys J 73: 1263-1275.
Lee A, Wong ST, Gallagher D, Li B, Storm DR, Scheuer T, Catterall WA (1999) Ca2+/calmodulin binds to and modulates P/Q-type calcium channels. Nature 399: 155-159.
Leitch B, Szostek A, Lin R, Shevtsova O (2009) Subcellular distribution of L-type calcium channel subtypes in rat hippocampal neurons. Neuroscience 164: 641-657.
Levitan IB, Kaczmarek LK (1997) The Neuron. Oxford University Press: Oxford UK.
Li L, Bischofberger J, Jonas P (2007) Differential gating and recruitment of P/Q-, N-, and R-type channels in hippocampal mossy fiber boutons. J Neurosci 27: 13420 -13429.
Li Y-X, Bertram R, Rinzel J (1996) Modeling N-methyl-D-aspartate-induced bursting in dopamine neurons. Neuroscience 71: 397-410.
Liebmann L, Karst H, Sidiropoulu K, van Gemert N, Meijer OC, Poirazi P, Joëls M (2008) Differential effects of corticosterone on the slow afterhyperpolarization in the basolateral amygdala and CA1 region: possible role of calcium channel subunits. J Neurophysiol 99: 958-968.
Lindblad DS, Murphey CR, Clark JW, Giles WR (1996) A model of the action potential and underlying membrane currents in a rabbit atrial cell. Am J Physiol 271:H1666-1696.
Linz KW, Meyer R (1998) Control of L-type calcium current during the action potential of guinea-pig ventricular myocytes. J Physiol 513: 425-442.
Lipscombe D (2002) L-type calcium channels: highs and new lows. Circ Res 90: 933-935.
Lipscombe D, Helton TD, Xu W (2004) L-type calcium channels: the low down. J Neurophysiol 92: 2633-2641.
Liu X, Yang PS, Yang W, Yue DT (2010) Enzyme-inhibitor-like tuning of channel connectivity with calmodulin. Nature 463: 968-972.
Liu Y, Li X, Ma C, Liu J, Lu H (2005) Salicylate blocks L-type calcium channels in rat inferior colliculus neurons. Hearing Res 205: 271-276.
Luin E, Lorenzon P, Wernig A, Ruzzier F (2008) Calcium current kinetics in young and aged human cultured myotubes. Cell Calcium 44: 554-566.
Luo C-H, Rudy Y (1994) A dynamic model of the cardiac ventricular action potential. I. Simulations of ionic currents and concentration changes. Circ Res 74:1071-1096.
Magee JC, Johnston D (1995) Characterization of single voltage-gated Na+ and Ca2+ channels in apical dendrites of rat CA1 pyramidal neurons. J Physiol 487.1: 67-90.
Mahajan A, Shiferaw Y, Sato D et al. (2008) A rabbit ventricular action potential model replicating cardiac dynamics at rapid heart rates. Biophys J 94: 392-410.
Mangoni ME, Couette B, Bourinet E, Platzer J, Reimer D, Striessnig J, Nargeot J (2003) Functional role of L-type Cav1.3 Ca2+ channels in cardiac pacemaker activity. PNAS 100: 5543-5548.
Marcantoni A, Baldelli P, Hernandez-Guijo JM, Comunanza V, Carabelli V, Carbone E (2007) L-type calcium channels in adrenal chromaffin cells: role in pace-making and secretion. Cell Calcium 42: 397-408.
Marcantoni A, Carabelli V, Comunanza V, Hoddah H, Carbone E (2008) Calcium channels in chromaffin cells: focus on L and T types. Acta Physiol 192: 233-246.
Marcantoni A, Carabelli V, Vandael DH, Comunanza V, Carbone E (2009) PDE type-4 inhibition increases L-type Ca2+ currents, action potential firing, and quantal size of exocytosis in mouse chromaffin cells. Eur J Physiol 457:1093-1110.
Marcantoni A, Vandael DHF, Mahapatra S, Carabelli V, Sinnegger-Brauns MJ, Striessnig J, Carbone E (2010) Loss of channels reveals the critical role of L-type and BK channel coupling in pacemaking mouse adrenal chromaffin cells. J Neurosci 30:491-504.
Martinez-Gomez J, Lopez-Garcia JA (2007) Simultaneous assessment of the effects of L-type current modulators on sensory and motor pathways of the mouse spinal cord in vitro. Neuropharmacol 53: 464-471.
McConigle P, Molinoff PB (1989) Quantitative aspects of drug-receptor interactions. In: Basic Neurochemistry: Molecular, Cellular and Medical Aspects, pp 183-201. Eds Siegel GJ et al.. Raven Press: New York.
McCormick DA, Huguenard JR (1992) A model of the electrophysiological properties of thalamocortical relay neurons. J Neurophysiol 68: 1384-1400.
Meir A, Ginsburg S, Butkevich A, Kachalsky SG, Kaiserman I, Ahdut R, Demirgoren S, Rahamimoff R (1999) Ion channels in presynaptic nerve terminals and control of transmitter release. Physiol Rev 79: 1019-1088.
Mesirca P, Marger L, Torrente A, Striessnig J, Nargeot J, Mangoni ME (2010) Pacemaker cells of the atrioventricular node are dependent oscillators. Biophys J 98, Supp 1: 339a.
Meuth S, Budde T, Pape H-C (2001) Differential control of high-voltage activated Ca2+ current components by a Ca2+-dependent inactivation mechanism in thalamic relay neurons. Thalamus Relat Syst 1: 31-38.
Migliore M, Cook EP, Jaffe DB, Turner DA, Johnston D (1995) Computer simulations of morphologically reconstructed CA3 hippocampal neurons. J Neurophysiol 73: 1157-1168.
Molitor SC, Manis PB (1999) Voltage-gated conductances in acutely isolated guinea pig dorsal cochlear nucleus neurons. J Neurophysiol 81: 985-998.
Morad M, Soldatov N (2005) Calcium channel inactivation: possible role in signal transduction and signaling. Cell Calcium 38: 223-231.
Mori MX, Erickson MG, Yue DT (2004) Functional stoichiometry and local enrichment of calmodulin interacting with Ca2+ channels. Science 304: 432-5.
Muinuddin A, Kang Y, Gaisano HY, Diamant NE (2004) Regional differences in L-type channel expression in feline lower esophageal sphincter. Am J Physiol Gastrointest Liver Physiol 287: G772–G781.
Navedo MF, Amberg GC, Westenbroek RE, Sinnegger-Brauns MJ, Catterall WA, Striessnig J, Santana LF (2007) Cav1.3 channels produce persistent calcium sparklets, but Cav1.2 channels are responsible for sparklets in mouse arterial smooth muscle. Am J Physiol Heart Circ Physiol 293: H1359-H1370.
Neher E, Sakaba T (2008) Multiple roles of calcium ions in the regulation of neurotransmitter release. Neuron 59: 861-872.
Nernst W (1889) Die elektromotorische Wirksamkeit der Ionen. Z. Phys Chem Leipzig 4: 129-181.
Newcomb R, Szoke B, Palma A, Wang G, Chen X, Hopkins W, Cong R, Miller J, Urge L, Tarczy-Hornoch K, Loo JA, Dooley DJ, Nadasdi L, Tsien RW, Lemos J, Miljanich G (1998) Selective peptide antagonist of the class E calcium channel from the venom of the tarantula Hysterocrates gigas. Biochemistry 37:15353-15362.
N’Gouemo P, Faingold CL, Morad M (2009) Calcium channel dysfunction in inferior colliculus neurons of the genetically epilepsy-prone rat. Neuropharmacology 56: 665-675.
Noble D (1995) The development of mathematical models of the heart. Chaos, Solitons & Fractals 5:321-333.
Norris CM, Blalock EM, Chen K-C, Poter NM, Thibault O, Kraner SD, Landfield PW (2010) Hippocampal ’zipper’ slice studies reveal a necessary role for calcineurin in the increased activity of L-type Ca2+ channels with aging. Neurobiol Aging 31: 328-338.
Nowycky MC, Fox AP, Tsien RW (1985) Three types of neuronal calcium channel with different calcium agonist sensitivity. Nature 316: 440-443.
Ono K, Iijima T (2010) Cardiac T-type Ca2+ channels in the heart. J Mol Cell Card 48: 65-70.
Ouyang K, Wu C, Cheng H (2005) -induced release in sensory neurons. J Biol Chem 280: 15898-15902.
Peloquin JB, Doering CJ, Rehak R, McRory JE (2008) Temperature dependence of calcium channel gating. Neurosci 151:1066-1083.
Penington NJ, Kelly JS, Fox AP (1991) A study of the mechanism of Ca2+ current inhibition produced by serotonin in rat dorsal raphe neurons. J Neurosci I7: 3594-3609.
Perez-Reyes, E (2003) Molecular physiology of low-voltage-activated T-type calcium channels. Physiol Rev 83: 117-161.
Peterson BZ, DeMaria CD, Yue DT (1999) Calmodulin is the Ca2+ sensor for Ca2+-dependent inactivation of L-type calcium channels. Neuron 22: 549-558.
Piedras-Rentería ES, Barrett CF, CaoY-Q, Tsien RW (2007) Voltage-gated calcium channels, calcium signaling, and channelopathies. In, Calcium: A Matter of Life or Death, Krebs J, Michalak M (Eds). Elsevier BV, Amsterdam.
Planck M (1890) Über die Erregung von Electricität und Warme in Electrolyten. Ann Phys Chem 39: 161-186.
Poirazi P, Brannon T, Mel BW (2003) Arithmetic of subthreshold synaptic summation in a model CA1 pyramidal cell. Neuron 37: 977-987.
Pospischil M, Toledo-Rodriguez M, Monier C, Piwkowska Z, Bal T, Frégnac Y, Markram H, Destexhe A (2008) Minimal Hodgkin-Huxley type models for different classes of cortical and thalamic neurons. Biol Cybern 99: 427-441.
Power JM, Sah P (2005) Intracellular calcium store filling by an L-type calcium current in the basolateral amygdala at subthreshold membrane potentials. J Physiol 562: 439-453.
Puglisi JL, Wang F, Bers DM (2004) Modeling the isolated cardiac myocyte. Prog Biophys Mol Biol 85:163-178.
Putzier I, Kullmann PHM, Horn JP, Levitan ES (2009a) Cav1.3 channel voltage dependence, not Ca2+ selectivity, drives pacemaker activity and amplifies bursts in nigral dopamine neurons. J Neurosci 29: 15414-15419.
Putzier I, Kullmann PHM, Horn JP, Levitan ES (2009b) Dopamine neuron responses depend exponentially on pacemaker interval. J Neurophysiol 101: 926-933.
Qin N, Olcese R, Bransby M, Lin T, Birnbaumer L (1999) Ca2+-induced inhibition of the cardiac Ca2+ channel depends on calmodulin. PNAS 96: 2435-2438.
Ravindran A, Lao QZ, Harry JB, Abrahimi P, Kobrinsky E, Soldatov NM (2008) Calmodulin-dependent gating of calcium channels in the absence of Ca subunits. PNAS 105: 8154-8159.
Ravindran A, Kobrinsky E, Lao QZ, Soldatov NM (2009) Functional properties of the calcium channel activated by calmodulin in the absence of subunits. Channels (Austin) 3: 25-31
Rhodes PA Llinás R (2001) Apical tuft input efficacy in layer 5 pyramidal cells from rat visual cortex. J Physiol 536.1, 167-187.
Rhodes PA Llinás R (2005) A model of thalamocortical relay cells. J Physiol 565, 765-781.
Romanin C, Gamsjaeger R, Kahr H, Schaufler D, Carlson O, Abernethy DR, Soldatov NM (2000) Ca2+ sensors of L-type Ca2+ channel. FEBS Lett 487: 301-306.
Roussel C, Erneux T, Schiffmann SN, Gall D (2006) Modulation of neuronal excitability by intracellular calcium buffering: from spiking to bursting. Cell Calcium 39: 455-466.
Sala F (1991) Activation kinetics of calcium currents in bull-frog sympathetic neurones. J Physiol 437: 221-238.
Santos SF, Pierrot N, Morel N, Gailly P, Sindic C, Octave J-N (2009) Expression of human amyloid precursor protein in rat cortical neurons inhibits calcium oscillations. J Neurosci 29: 4708-4718.
Satin J, Schroder EA, Crump SM ( 2011) L-type calcium channel auto-regulation of transcription. Cell Calcium 49: 306-313.
Schild JH, Khushalani S, Clark JW, Andresen MC, Kunzei DL, Yang M (1993) An ionic current model for neurons in the rat medial nucleus tractus solitarii receiving sensory afferent input. J Physiol 469: 341-363.
Schlick B, Flucher BE, Obermair GJ (2010) Voltage-activated calcium channel expression profiles in mouse brain and cultured hippocampal neurons. Neurosci 167: 786-798.
Schnee ME, Ricci AJ (2003) Biophysical and pharmacological characterization of voltage-gated calcium currents in turtle auditory hair cells. J Physiol 549: 697-717.
Schröder F, Handrock R, Beuckelmann DJ, Hirt S, Hullin R, Priebe L, Schwinger RHG, Weil J, Herzig S (1998) Increased availability and open probability of single L-type calcium channels from failing compared with nonfailing human ventricle. Circulation 98: 969-976.
Scriven DRL, Asghari P, Schulson MN, Moore EDW (2010) Analysis of and ryanodine receptor clusters in rat ventricular myocytes. Biophys J 99: 3923-3929.
Shannon TR, Wang F, Puglisi J, Weber C, Bers DM (2004) A mathematical treatment of integrated Ca dynamics within the ventricular myocyte. Biophys J 87: 3351-3371.
Shapiro NP, Lee RH (2007) Synaptic amplification versus bistability in motoneuron dendritic processing: a top-down modeling approach. J Neurophysiol 97: 3948-3960.
Sherman A, Keizer J, Rinzel J (1990) Domain model for -inactivation of channels at low channel density. Biophys J 58: 985-995.
Shiferaw Y, Watanabe MA, Garfinkel A, Weiss JN, Karma A (2003) Model of intracellular calcium cycling in ventricular myocytes. Biophys J 85: 3666-3686.
Shorten PR, Wall DJN ( 2000) A Hodgkin-Huxley model exhibiting bursting oscillations. Bull Math Biol 62: 695-715.
Singh A , Gebhart M, Fritsch R et al. (2008) Modulation of voltage- and -dependent gating of L-type calcium channels by alternative splicing of a C-terminal regulatory domain. J Biol Chem 283: 20733-20744.
Singh A, Hamedinger D, Hoda J-C et al. (2006) C-terminal modulator controls -dependent gating of L-type channels. Nat Neurosci 9: 1108-1116.
Soeller C, Cannell MB (2004) Analysing cardiac excitation-contraction coupling with mathematical models of local control. Prog Biophys Mol Biol 85: 141-162.
Soldatov, NM (2003) channel moving tail: link between -induced inactivation and signal transduction. Trends Pharm Sci 24: 167-171.
Splawski I, Timothy KW, Sharpe LM, Decher N, Kumar P, Bloise R, Napolitano C, Schwartz PJ, Joseph RM, Condouris K, Tager-Flusberg H, Priori SG, Sanguinetti MC, Keating MT (2004) calcium channel dysfunction causes a multisystem disorder including arrhythmia and autism. Cell 119: 19-31.
Standen NB, Stanfield PR (1982) A binding-site model for calcium channel inactivation that depends on calcium entry. Proc R Soc Lond B 217: 101-110.
Stokes DL, Green NM (2003) Structure and function of the calcium pump. Ann Rev Biophys Biomol Struct 32:445-468.
Striessnig J, Hoda J-C, Koschak A et al. (2004) L-type channels in channelopathies. Biochem Biophys Res Comm 322: 1341-1346.
Striessnig J, Koschak A (2008) Exploring the function and pharmacotherapeutic potential of voltage-gated channels with gene knockout models. Channels 2, 1-19.
Striessnig J, Koschak A, Sinnegger-Brauns MJ, Hetzenauer A, Nguyen NK, Busquet P, Pelster G, Singewald N (2006) Role of voltage-gated L-type channel isoforms for brain function. Biochem Soc Trans 34: 903-909.
Striessnig J (2007) C-terminal tailoring of L-type calcium channel function. J Physiol 585: 643-644.
Sun L, Fan J-S, Clark JW, Palade PT (2000) A model of the Ltype Ca2+ channel in rat ventricular myocytes: ion selectivity and inactivation mechanisms. J Physiol 529: 139-158.
Suzuki Y, Inoue T, Ra C (2010) L-type Ca2+ channels: a new player in the regulation of signaling, cell activation and cell survival in immune cells. Mol Immunol 47: 640-648.
Tadross MR, Yue DT (2010) Systematic mapping of the state dependence of voltage- and - dependent inactivation using simple open-channel measurements. J Gen Physiol 135: 217-227.
Tanabe M, Gähwiler BH, Gerber U (1998) L-Type channels mediate the slow -dependent afterhyperpolarization current in rat CA3 pyramidal cells in vitro. J Neurophysiol 80: 2268-2273.
Tank DW, Fiegehr WG, Delaney KR (1995) A quantitative analysis of presynaptic calcium dynamics that contribute to short-term enhancement. J Neurosci 15: 7940-7952.
Tanskanen A, Greenstein JL, O’Rourke B, Winslow RL (2005) The role of stochastic and modal gating of cardiac L-type channels on early after-depolarizations. Biophys J 88: 85-95.
Thibault O, Landfield PW (1996) Increase in single L-type calcium channels in hippocampal neurons during aging. Science 272: 1017-1020.
Thibault O, Hadley R, Landfield PW (2001) Elevated postsynaptic and L-type calcium channel activity in aged hippocampal neurons: relationship to impaired synaptic plasticity. J Neurosci 21: 9744-9756.
Thibault O, Gant JC, Landfield PW (2007) Expansion of the calcium hypothesis of brain aging and Alzheimer’s disease: minding the store. Aging Cell 6: 307-317.
Thompson SM, Wong RKS (1991) Development of calcium current subtypes in isolated rat hippocampal pyramidal cells. J Physiol 439: 671-689.
Tillotson D (I979) Inactivation of Ca conductance dependent on entry of Ca ions in molluscan neurones. PNAS 76: 1497-1500.
Tipparaju SM, Kumar R, Wang Y, Joyner RW, Wagner MB (2004) Developmental differences in L-type calcium current of human atrial myocytes. Am J Physiol Heart Circ Physiol 286: H1963-H1969.
Torrente A, Mesirca P, Neco P et al. (2011) L-type calcium channels-mediated ryanodine receptor dependent calcium release controls heart rate. Biophys J 100, Supp 1: 567a.
Traub RD, Wong RKS, Miles R, Michelson H (1991) A model of a CA3 hippocampal pyramidal neuron incorporating voltage-clamp data on intrinsic conductances. J Neurophysiol 66: 635-650.
Traub RD, Jeffery JGR, Miles R, Miles A. Whittington MA, Tóth K (1994) A branching dendritic model of a rodent CA3 pyramidal neurone. J Physiol 481: 79-95.
Tsien RW, Barrett CF (2005) Brief history of calcium channel discovery. In, Voltage-Gated Calcium Channels, pp 27-47. Ed Zamponi GW. Kluwer Academic/Plenum: New York.
Tsien RW, Tsien RY (1990) Calcium channels, stores and oscillations. Ann Rev Cell Biol 6: 715-60.
Tsien RW, Lipscombe D, Madison DV, Bley KR, Fox AP (1988) Multiple types of neuronal calcium channels and their selective modulation. TINS 11: 432-438.
Tuckwell HC (1988) Introduction to Theoretical Neurobiology. Cambridge University Press: Cambridge.
Vandael DH, Marcantoni A, Mahapatra S, Caro A, Ruth P, Zuccotti A, Knipper M, Carbone E (2010) Cav1.3 and BK channels for timing and regulating cell firing. Mol Neurobiol 42:185-198.
Van Wagoner DR, Pond A, Lamorgese M, Rossie SS, McCarthy PM, Nerbonne JM (1999) Atrial L-Type currents and human atrial fibrillation. Circ Res 85: 428-436.
Verkhratsky A (2005) Physiology and pathophysiology of the calcium store in the endoplasmic reticulum of neurons. Physiol Rev 85: 201-279.
Vignali S, Leiss V, Karl R, Hofmann F, Welling A (2006) Characterization of voltage-dependent sodium and calcium channels in mouse pancreatic A- and B-cells. J Physiol 572: 691-706.
Wahl-Schott C, Baumann L, Cuny H, Eckert C, Griessmeier K, Biel M (2006) Switching off calcium-dependent inactivation in L-type calcium channels by an autoinhibitory domain. PNAS 103: 15657-15662.
Wallenstein G (1994) A model of the electrophysiological properties of nucleus reticularis thalami neurons. Biophys J 66: 978-988.
Wang X-J (1998) Calcium coding and adaptive temporal computation in cortical pyramidal neurons. J Neurophysiol 79: 1549-1566.
Weiergräber M, Stephani U, Köhling R (2010) Voltage-gated calcium channels in the etiopathogenesis and treatment of absence epilepsy. Brain Res Rev 62: 245-271.
Weiss JN (1997) The Hill equation revisited: uses and misuses. FASEB J 11: 835-841.
Wilders R (2007) Computer modelling of the sinoatrial node. Med Bio Eng Comput 45:189-207.
Williams GSB, Huertas MA, Sobie EA, Jafri MS,Smith GD (2007) A probability density approach to modeling local control of calcium-induced calcium release in cardiac myocytes. Biophys J 92: 2311-2328.
Williams GSB, Smith GD, Sobie EA, Jafri MS (2010) Models of cardiac excitation-contraction coupling in ventricular myocytes. Math Biosci 226: 1-15.
Wu WW, Chan CS, Surmeier DJ, Disterhoft JF (2008) Coupling of L-Type channels to Kv7/KCNQ channels creates a novel, activity-dependent, homeostatic intrinsic plasticity. J Neurophysiol 100: 1897-1908.
Xiang K, Earl DE, Davis KM, Giovannucci DR, Greenfield LJ Jr, Tietz EI (2008) Chronic benzodiazepine administration potentiates high voltage-activated calcium currents in hippocampal CA1 neurons. J Pharm Exptal Therapeutics 327: 872-883.
Xu W, Lipscombe D (2001) Neuronal L-type channels activate at relatively hyperpolarized membrane potentials and are incompletely inhibited by dihydropyridines. J Neurosci 21: 5944-5951.
Yarotskyy V, Gao G, Peterson BZ, Elmslie KS (2009) The Timothy syndrome mutation of cardiac (L-type) channels: multiple altered gating mechanisms and pharmacological restoration of inactivation. J Physiol 587: 551-565.
Zalk R, Lehnart SE, Marks AR (2007) Modulation of the ryanodine receptor and intracellular calcium. Ann Rev Biochem 76:367-85.
Zamponi GW, Ed (2005) Voltage-gated calcium channels. Kluwer/Plenum: New York.
Zhang H, Holden AV, Kodama I, Honjo H, Lei M, Varghese T, Boyett MR (2000) Mathematical models of action potentials in the periphery and center of the rabbit sinoatrial node. Am J Physiol Heart Circ Physiol 279: H397-H421.
Zhang M, Sukiasyan N, Mller M, Bezprozvanny I, Zhang H, Wienecke J, Hultborn H (2006) Localization of L-type calcium channel in cat lumbar spinal cord - with emphasis on motoneurons. Neurosci Lett 407: 42-47.
Zhang Q, Timofeyev V, Qiu H et al. (2011) Expression and roles of () L-Type channel in atrioventricular node automaticity. J Mol Cell Cardiol 50: 194-202.
Zhuravleva SO, Kostyuk PG, Shuba YM (2001) Subtypes of low voltage-activated channels in laterodorsal thalamic neurons: possible localization and physiological roles. Pflügers Arch 441: 832-839.
Zuccotti A, Clementi S, Reinbothe T, Torrente A, Vandael DH, Pirone A (2011) Structural and functional differences between L-type calcium channels: crucial issues for future selective targeting. TIPS 868: avail online.
Zühlke RD, Pitt GS, Deisseroth K, Tsien RW, Reuter H (1999) Calmodulin supports both inactivation and facilitation of L-type calcium channels. Nature 399: 159-162.