DESY 11-084 ISSN 0418-9833
May 2011
Measurement of the Diffractive Longitudinal Structure Function at HERA
H1 Collaboration
First measurements are presented of the diffractive cross section at centre-of-mass energies of and , together with a precise new measurement at of , using data taken with the H1 detector in the years and . Together with previous H1 data at of , the measurements are used to extract the diffractive longitudinal structure function in the range of photon virtualities and fractional proton longitudinal momentum loss . The measured is compared with leading twist predictions based on diffractive parton densities extracted in NLO QCD fits to previous measurements of diffractive Deep-Inelastic Scattering and with a model which additionally includes a higher twist contribution derived from a colour dipole approach. The ratio of the diffractive cross section induced by longitudinally polarised photons to that for transversely polarised photons is extracted and compared with the analogous quantity for inclusive Deep-Inelastic Scattering
Submitted to Eur. Phys. J. C
F.D. Aaron5,48, C. Alexa5, V. Andreev25, S. Backovic30, A. Baghdasaryan38, S. Baghdasaryan38, E. Barrelet29, W. Bartel11, K. Begzsuren35, A. Belousov25, P. Belov11, J.C. Bizot27, V. Boudry28, I. Bozovic-Jelisavcic2, J. Bracinik3, G. Brandt11, M. Brinkmann11, V. Brisson27, D. Britzger11, D. Bruncko16, A. Bunyatyan13,38, G. Buschhorn26,†, L. Bystritskaya24, A.J. Campbell11, K.B. Cantun Avila22, F. Ceccopieri4, K. Cerny32, V. Cerny16,47, V. Chekelian26, J.G. Contreras22, J.A. Coughlan6, J. Cvach31, J.B. Dainton18, K. Daum37,43, B. Delcourt27, J. Delvax4, E.A. De Wolf4, C. Diaconu21, M. Dobre12,50,51, V. Dodonov13, A. Dossanov26, A. Dubak30,46, G. Eckerlin11, S. Egli36, A. Eliseev25, E. Elsen11, L. Favart4, A. Fedotov24, R. Felst11, J. Feltesse10, J. Ferencei16, D.-J. Fischer11, M. Fleischer11, A. Fomenko25, E. Gabathuler18, J. Gayler11, S. Ghazaryan11, A. Glazov11, L. Goerlich7, N. Gogitidze25, M. Gouzevitch11,45, C. Grab40, A. Grebenyuk11, T. Greenshaw18, B.R. Grell11, G. Grindhammer26, S. Habib11, D. Haidt11, C. Helebrant11, R.C.W. Henderson17, E. Hennekemper15, H. Henschel39, M. Herbst15, G. Herrera23, M. Hildebrandt36, K.H. Hiller39, D. Hoffmann21, R. Horisberger36, T. Hreus4,44, F. Huber14, M. Jacquet27, X. Janssen4, L. Jönsson20, H. Jung11,4,52, M. Kapichine9, I.R. Kenyon3, C. Kiesling26, M. Klein18, C. Kleinwort11, T. Kluge18, R. Kogler11, P. Kostka39, M. Kraemer11, J. Kretzschmar18, K. Krüger15, M.P.J. Landon19, W. Lange39, G. Laštovička-Medin30, P. Laycock18, A. Lebedev25, V. Lendermann15, S. Levonian11, K. Lipka11,50, B. List12, J. List11, R. Lopez-Fernandez23, V. Lubimov24, A. Makankine9, E. Malinovski25, P. Marage4, H.-U. Martyn1, S.J. Maxfield18, A. Mehta18, A.B. Meyer11, H. Meyer37, J. Meyer11, S. Mikocki7, I. Milcewicz-Mika7, F. Moreau28, A. Morozov9, J.V. Morris6, M. Mudrinic2, K. Müller41, Th. Naumann39, P.R. Newman3, C. Niebuhr11, D. Nikitin9, G. Nowak7, K. Nowak11, J.E. Olsson11, D. Ozerov24, P. Pahl11, V. Palichik9, I. Panagouliasl,11,42, M. Pandurovic2, Th. Papadopouloul,11,42, C. Pascaud27, G.D. Patel18, E. Perez10,45, A. Petrukhin11, I. Picuric30, S. Piec11, H. Pirumov14, D. Pitzl11, R. Plačakytė12, B. Pokorny32, R. Polifka32, B. Povh13, V. Radescu14, N. Raicevic30, T. Ravdandorj35, P. Reimer31, E. Rizvi19, P. Robmann41, R. Roosen4, A. Rostovtsev24, M. Rotaru5, J.E. Ruiz Tabasco22, S. Rusakov25, D. Šálek32, D.P.C. Sankey6, M. Sauter14, E. Sauvan21, S. Schmitt11, L. Schoeffel10, A. Schöning14, H.-C. Schultz-Coulon15, F. Sefkow11, L.N. Shtarkov25, S. Shushkevich26, T. Sloan17, I. Smiljanic2, Y. Soloviev25, P. Sopicki7, D. South11, V. Spaskov9, A. Specka28, Z. Staykova11, M. Steder11, B. Stella33, G. Stoicea5, U. Straumann41, T. Sykora4,32, P.D. Thompson3, T. Toll11, T.H. Tran27, D. Traynor19, P. Truöl41, I. Tsakov34, B. Tseepeldorj35,49, J. Turnau7, K. Urban15, A. Valkárová32, C. Vallée21, P. Van Mechelen4, Y. Vazdik25, D. Wegener8, E. Wünsch11, J. Žáček32, J. Zálešák31, Z. Zhang27, A. Zhokin24, H. Zohrabyan38, and F. Zomer27
1 I. Physikalisches Institut der RWTH, Aachen, Germany
2 Vinca Institute of Nuclear Sciences, University of Belgrade,
1100 Belgrade, Serbia
3 School of Physics and Astronomy, University of Birmingham,
Birmingham, UKb
4 Inter-University Institute for High Energies ULB-VUB, Brussels and
Universiteit Antwerpen, Antwerpen, Belgiumc
5 National Institute for Physics and Nuclear Engineering (NIPNE) ,
Bucharest, Romaniam
6 Rutherford Appleton Laboratory, Chilton, Didcot, UKb
7 Institute for Nuclear Physics, Cracow, Polandd
8 Institut für Physik, TU Dortmund, Dortmund, Germanya
9 Joint Institute for Nuclear Research, Dubna, Russia
10 CEA, DSM/Irfu, CE-Saclay, Gif-sur-Yvette, France
11 DESY, Hamburg, Germany
12 Institut für Experimentalphysik, Universität Hamburg,
Hamburg, Germanya
13 Max-Planck-Institut für Kernphysik, Heidelberg, Germany
14 Physikalisches Institut, Universität Heidelberg,
Heidelberg, Germanya
15 Kirchhoff-Institut für Physik, Universität Heidelberg,
Heidelberg, Germanya
16 Institute of Experimental Physics, Slovak Academy of
Sciences, Košice, Slovak Republicf
17 Department of Physics, University of Lancaster,
Lancaster, UKb
18 Department of Physics, University of Liverpool,
Liverpool, UKb
19 Queen Mary and Westfield College, London, UKb
20 Physics Department, University of Lund,
Lund, Swedeng
21 CPPM, Aix-Marseille Université, CNRS/IN2P3, Marseille, France
22 Departamento de Fisica Aplicada,
CINVESTAV, Mérida, Yucatán, Méxicoj
23 Departamento de Fisica, CINVESTAV IPN, México City, Méxicoj
24 Institute for Theoretical and Experimental Physics,
Moscow, Russiak
25 Lebedev Physical Institute, Moscow, Russiae
26 Max-Planck-Institut für Physik, München, Germany
27 LAL, Université Paris-Sud, CNRS/IN2P3, Orsay, France
28 LLR, Ecole Polytechnique, CNRS/IN2P3, Palaiseau, France
29 LPNHE, Université Pierre et Marie Curie Paris 6,
Université Denis Diderot Paris 7, CNRS/IN2P3, Paris, France
30 Faculty of Science, University of Montenegro,
Podgorica, Montenegron
31 Institute of Physics, Academy of Sciences of the Czech Republic,
Praha, Czech Republich
32 Faculty of Mathematics and Physics, Charles University,
Praha, Czech Republich
33 Dipartimento di Fisica Università di Roma Tre
and INFN Roma 3, Roma, Italy
34 Institute for Nuclear Research and Nuclear Energy,
Sofia, Bulgariae
35 Institute of Physics and Technology of the Mongolian
Academy of Sciences, Ulaanbaatar, Mongolia
36 Paul Scherrer Institut,
Villigen, Switzerland
37 Fachbereich C, Universität Wuppertal,
Wuppertal, Germany
38 Yerevan Physics Institute, Yerevan, Armenia
39 DESY, Zeuthen, Germany
40 Institut für Teilchenphysik, ETH, Zürich, Switzerlandi
41 Physik-Institut der Universität Zürich, Zürich, Switzerlandi
42 Also at Physics Department, National Technical University,
Zografou Campus, GR-15773 Athens, Greece
43 Also at Rechenzentrum, Universität Wuppertal,
Wuppertal, Germany
44 Also at University of P.J. Šafárik,
Košice, Slovak Republic
45 Also at CERN, Geneva, Switzerland
46 Also at Max-Planck-Institut für Physik, München, Germany
47 Also at Comenius University, Bratislava, Slovak Republic
48 Also at Faculty of Physics, University of Bucharest,
Bucharest, Romania
49 Also at Ulaanbaatar University, Ulaanbaatar, Mongolia
50 Supported by the Initiative and Networking Fund of the
Helmholtz Association (HGF) under the contract VH-NG-401.
51 Absent on leave from NIPNE-HH, Bucharest, Romania
52 On leave of absence at CERN, Geneva, Switzerland
† Deceased
a Supported by the Bundesministerium für Bildung und Forschung, FRG,
under contract numbers 05H09GUF, 05H09VHC, 05H09VHF, 05H16PEA
b Supported by the UK Science and Technology Facilities Council,
and formerly by the UK Particle Physics and
Astronomy Research Council
c Supported by FNRS-FWO-Vlaanderen, IISN-IIKW and IWT
and by Interuniversity
Attraction Poles Programme,
Belgian Science Policy
d Partially Supported by Polish Ministry of Science and Higher
Education, grant DPN/N168/DESY/2009
e Supported by the Deutsche Forschungsgemeinschaft
f Supported by VEGA SR grant no. 2/7062/ 27
g Supported by the Swedish Natural Science Research Council
h Supported by the Ministry of Education of the Czech Republic
under the projects LC527, INGO-LA09042 and
MSM0021620859
i Supported by the Swiss National Science Foundation
j Supported by CONACYT,
México, grant 48778-F
k Russian Foundation for Basic Research (RFBR), grant no 1329.2008.2
l This project is co-funded by the European Social Fund (75%) and
National Resources (25%) - (EPEAEK II) - PYTHAGORAS II
m Supported by the Romanian National Authority for Scientific Research
under the contract PN 09370101
n Partially Supported by Ministry of Science of Montenegro,
no. 05-1/3-3352
1 Introduction
The observation that a significant subset of Deep-Inelastic Scattering (DIS) events at HERA contain a large gap in activity in the forward region [1] prompted much theoretical and experimental work. Such large rapidity gap topologies signify a colour singlet or diffractive exchange and HERA has proved to be a rich environment for their study. In particular, the study of diffractive DIS (DDIS), both inclusive and exclusive, has supplied a wealth of experimental data with a hard scale given by the photon virtuality, stimulating the theoretical understanding of diffraction in terms of perturbative quantum chromodynamics (QCD).
It has been shown that the neutral current DDIS process at HERA obeys a QCD factorisation theorem [2]. This allows for a description of DDIS in terms of parton densities convoluted with hard scattering matrix elements. The diffractive parton density functions (DPDFs) depend on four kinematic variables, so an additional assumption is often made whereby the proton vertex dynamics factorise from the vertex of the hard scattering, as shown in figure 1. While this proton vertex factorisation has no complete foundation in theory, measurements of DDIS from both H1 [3, 4, 5] and ZEUS [6] show that it holds well enough such that next-to-leading order (NLO) QCD fits can be made to the data [3, 7, 8, 9]. The DPDFs then depend only on the scale and the fraction of the total longitudinal momentum of the diffractive exchange which is carried by the parton entering the hard scattering.
Measurements of the dijet cross section in DDIS allow tests of the DPDFs extracted in fits to inclusive DDIS data. This process, which is known to be dominated by boson-gluon fusion, is particularly sensitive to the poorly known gluon DPDF at large and has thus been used successfully to distinguish between different DPDF sets [9]. DDIS events containing charm particles in the final state have similarly been used to test the gluon DPDF [10].
As in the inclusive DIS case, the cross section for DDIS can be expressed in terms of a linear combination of structure functions, and [11]. While describes the total photon-proton process, is only sensitive to the longitudinally polarised photon contribution. As for its inclusive counterpart, is thus zero in the quark-parton model, but may acquire a non-zero value, in QCD, with leading twist contributions dependent on both the diffractive quark and gluon densities [12]. A measurement of provides a powerful independent tool to verify our understanding of the underlying dynamics of diffraction up to NLO in QCD and to test the DPDFs. This is particularly important at the lowest values, where direct information on the gluon density cannot be obtained from dijet data due to kinematic limitations and where novel effects such as parton saturation [13] or non-DGLAP dynamics [14, 15] are most likely to become important.
Previous attempts to measure [6, 16] have exploited the azimuthal decorrelation between the proton and electron scattering planes expected due to interference between the amplitudes for transverse and longitudinal photon polarisations [17]. However, due to the relatively poor statistical precision of the measurement, the results were consistent with zero. The H1 collaboration has recently published measurements of the inclusive structure function [18, 19] using the centre-of-mass energy dependence of the DIS cross section at fixed and . A similar approach has been proposed to extract [20].
In addition to measuring itself, it is interesting to compare the relative sizes of the diffractive cross sections induced by transversely and longitudinally polarised virtual photons. This comparison has previously been made for inclusive DIS and exclusive vector meson production through the study of the photoabsorption ratio, , where and are the cross sections for the scattering of longitudinally and transversely polarised photons, respectively. Whilst is only weakly dependent on kinematic variables in the DIS regime for inclusive cross sections [18, 21], a strong dependence on is observed for vector meson production [22], the longitudinally polarised photon cross section becoming much larger than its transverse counterpart at large . Since DDIS incorporates vector meson production and related processes at large , but exhibits kinematic dependences which are similar to those of inclusive DIS at low , it is not easy to predict its photoabsorption ratio. By analogy with the inclusive DIS case, we define for diffraction. The double ratio thus measures the relative importance of the longitudinally and transversely polarised photon cross sections in diffractive compared with inclusive scattering.
In this analysis, positron-proton collision data taken at different proton beam energies with the H1 detector at HERA in the years and are used to measure the diffractive cross section at intermediate and large inelasticities . Dedicated low and medium energy (LME) data with proton beam energies of and are analysed together with data at the nominal beam energy of . Previously published data at a proton beam energy [3] are used in addition. The positron beam energy is in all cases. These cross sections are used to extract together with the ratio and the double ratio .

2 Kinematics and cross section definition
The kinematic variables used to describe inclusive DIS are the virtuality of the exchanged boson , the Bjorken scaling variable and the inelasticity variable , defined as:
| (1) |
where and are the four-momenta of the incoming and outgoing positrons, respectively, and is the four-momentum of the incoming proton. They are related to , the square of the centre-of-mass energy, by .
In diffractive events, the hadronic final state can be divided into two systems and which are separated by the largest gap in rapidity. A diagram for the DDIS process is shown in figure 1. The system is either the elastically scattered proton, which is the dominant state in the kinematic range studied here, or its low mass excitations. In addition to the standard DIS variables and the squared four-momentum transfer at the proton vertex, , the kinematic variables and are useful in describing the diffractive DIS interaction. They are defined as:
| (2) |
where is the four momentum of the elastically scattered proton or of its low mass excitation. The variable is the longitudinal momentum fraction of the proton carried by the diffractive exchange and is the longitudinal momentum fraction of the struck quark with respect to the diffractive exchange, such that . In the simple quark-parton model, , while for higher order processes, . The results are discussed in terms of a diffractive reduced cross section, , related to the measured differential cross section by:
| (3) |
where . The diffractive reduced cross section is related to the diffractive structure functions by:
| (4) |
Due to the suppression term , the diffractive reduced cross section is only sensitive to at large values of .
As the final state system is not measured in this analysis, the cross section is integrated over ranges in its mass and in . These ranges are chosen to be
| (5) |
corresponding to the acceptance of the H1 detector in the forward direction and for consistency with previous measurements.
3 Models of
The relationships between the diffractive structure functions and the DPDFs have been shown to be analogous to those of the inclusive case in the limit where the proton mass and may be neglected compared with other relevant scales in the interaction [11]. The diffractive DIS structure function is then directly sensitive to the singlet quark DPDF and the scaling violations, , provide a measure of the gluon DPDF. NLO QCD fits to at low to intermediate values, sometimes supplemented by dijet data, thus provide DPDFs which lead to predictions of at leading twist. By analogy with the inclusive case [12, 23] and assuming collinear factorisation [2], the NLO expression for in the scheme is
| (6) |
where and are the quark and gluon DPDFs and is the electric charge of quark flavour . At the relatively large values at which can be measured at HERA, both the quark and the gluon densities are predicted to make important contributions to , despite the dominant role played by gluons in DDIS in general [3, 7].
In this paper, the measurement is compared with predictions derived from two NLO QCD fits to inclusive DDIS data [3], which are labelled ‘H1 2006 DPDF Fit A’ and ‘H1 2006 DPDF Fit B’. Proton vertex factorisation is assumed in both cases and the diffractive quark densities are very similar in the two fits. However, the two DPDF fits differ in their parameterisations of the gluon density, which leads to considerable differences at large fractional momenta [3], where the constraints from inclusive DDIS data are poor. Corresponding differences are visible between the Fit A and Fit B predictions for . The ‘H1 2006 DPDF Fit B’ DPDFs give the better description of diffractive dijet production at HERA [9] and are therefore used as the default here.
A complementary approach to modelling diffractive DIS is offered by dipole models [25, 24]. Viewed in the proton rest frame, the incoming virtual photon fluctuates into a pair or higher multiplicity state, whose scattering strength from the target is governed by a universal dipole cross section. Dipole models which are applicable to DDIS generally contain three contributions [24, 26]: leading twist terms corresponding to the scattering of and dipoles derived from fluctuations of transversely polarised photons, and a higher twist contribution (suppressed like ) in which dipoles are obtained from longitudinally polarised photons. Dipole models thus tend to neglect the leading twist contribution to which emerges naturally from NLO DPDF fits. However, the higher twist contribution to is of particular interest, since it can be predicted in perturbative QCD [27], by coupling a dipole to a two-gluon exchange in a similar phenomenology to that successfully applied to vector meson cross sections at HERA [28]. In many dipole-inspired models, this higher twist component is the dominant feature of at large and low-to-moderate .
In a recent hybrid approach to fitting [29] (labelled ‘Golec-Biernat & Łuszczak’ here), the leading and higher twist contributions to are included simultaneously. A parametrisation similar to that in [3] is used for the diffractive quark and gluon DPDFs, but the higher twist longitudinal photon contribution is also included via the parametrisation employed in [24]. The quality of the fit to the data is similar with and without the higher twist term. However, its inclusion leads to a sizeable effect on the diffractive gluon density at large fractional momenta and the higher twist contribution dominates the resulting predictions for for at the lowest values considered here.
4 Experimental Method
4.1 H1 detector
A detailed description of the H1 detector can be found elsewhere [30] and only the components essential to the present analysis are briefly described here. The origin of the H1 coordinate system is the nominal interaction point at the centre of the detector, with the direction of the proton beam defining the positive -axis (forward direction). The polar angle () is defined with respect to this axis and the pseudorapidity is defined as . The azimuthal angle defines the particle direction in the transverse plane.
The analysis uses several of the tracking detectors of H1, relying primarily on the two concentric central jet chambers (CJC) and the central silicon tracker (CST) [31], which measure the transverse momenta of charged particles in the angular range , together with the backward silicon tracker (BST), which is positioned around the beam-pipe in the backward direction. Complementary tracking information is obtained from the drift chamber COZ, which is located in between the two cylinders of the CJC, the forward silicon tracker (FST) and the forward tracking detector (FTD). The central inner proportional chamber (CIP) [32] provides trigger information on central tracks, the FST and BST are used to improve the overall vertex reconstruction and the FTD is used to improve the hadronic final state reconstruction of low momentum particles in the forward direction.
In the backward region , a lead-scintillating fibre calorimeter (SpaCal) is used for the identification and measurement of the scattered positron, with an energy resolution for electromagnetic showers of . Importantly, it also provides a trigger down to positron energies of . The hadronic section of the SpaCal is used in the reconstruction of the hadronic final state, especially at the high values accessed in this analysis. The liquid argon (LAr) calorimeter covers the range and is also used in this analysis in the reconstruction of the hadronic final state. It has an energy resolution of for hadronic showers, as obtained from test beam measurements [33].
Several of the forward detectors of H1 are used in conjunction with the LAr to determine whether or not an event contains a large rapidity gap close to the outgoing proton direction. The forward muon detector (FMD) comprises two sets of three drift chambers, separated by a toroidal magnet, covering the range . Only the three layers closest to the interaction region are considered in this analysis. A dedicated reconstruction algorithm efficiently detects secondary particles produced through the interactions of proton dissociation products with the beam-pipe or other accelerator elements, giving the FMD an effective coverage extending to around . The Plug is a calorimeter consisting of four double layers of scintillator and lead absorber, read out by photomultipliers. It is situated at and covers the range . The final forward detector component used in the analysis is one station of the forward tagging system (FTS), consisting of scintillators situated around the beam-pipe at covering approximately .
Positrons scattered through very small polar angles can be detected with a calorimeter (ETAG) placed at downstream in the positron beam direction. The luminosity is determined from the Bethe-Heitler scattering process, which is measured using a photon calorimeter at .
4.2 Data samples
Three samples are analysed to provide data at different centre-of-mass energies in different kinematic ranges, as shown in table 1.
| range | range | Luminosity | |||||
|---|---|---|---|---|---|---|---|
| . | |||||||
| . | |||||||
| . | |||||||
In addition to these data, cross section measurements at from a previous H1 publication [3] are used to extract in the same kinematic range.
4.3 Event selection
Dedicated ‘high ’ triggers are used for the LME datasets in order to allow triggering on energy depositions as low as in the SpaCal. For in the () data, the SpaCal trigger decision is combined with information from the BST or CIP in order to reduce the rate. For lower values, corresponding to high energy depositions in the SpaCal, triggers based on SpaCal-only information are used for all three datasets. The combined efficiency of the LME high triggers is around for positron energies above , as monitored with independent triggers. The data are corrected for this inefficiency, which has a small dependence on the radial position of the scattered positron in the SpaCal, , due to the track requirement. The combination of SpaCal-only triggers used has a negligibly small inefficiency.
The event selection is based on the identification of the scattered positron as a localised energy deposition, a cluster, of more than in the SpaCal in the LME () data. Backgrounds due predominantly to photoproduction processes, where the scattered positron is lost down the beam-pipe, are reduced by requiring that the logarithmic energy-weighted cluster radius, , is smaller than cm and that the energy measured in the hadronic section of the SpaCal associated with the cluster is less than of the cluster energy. If the highest energy cluster fails to fulfill these selection criteria, the second and third highest energy clusters are considered in turn. QED Compton contributions, , are suppressed by rejecting events with two back-to-back clusters.
For the LME data, the background is further reduced by demanding a ‘linked track’ that can be extrapolated to the SpaCal cluster within a radial distance of cm. The linked track is reconstructed using a dedicated algorithm incorporating information from both the CJC and the BST [34]. Geometrical cuts are applied to keep the tracking acceptance high and track quality requirements are applied, reflecting the geometry of these detectors.
In order to further reject background, a reconstructed event vertex is required to lie within cm of the nominal interaction point for all data samples. In order to guarantee a high vertex-finding efficiency, the measurement is restricted to the kinematic range . An algorithm combining calorimeter and tracking information, which optimises precision while avoiding double-counting, is used to reconstruct the four vector of the hadronic final state (HFS) particles [35]. For all datasets, the quantity , where the sum is over the energy minus the longitudinal momentum of all final state particles including the scattered positron, is required to be greater than . This quantity should peak at twice the incident positron energy, i.e. , for fully reconstructed DIS and DDIS events alike. This completes the background rejection criteria of the inclusive event selection.
At low positron energies, the photoproduction background remains large after all cuts. Following the procedure explained in [18], this residual background is estimated from the number of events passing the full analysis selection and having a negatively charged track linked to the SpaCal cluster. The photoproduction background is expected to be approximately charge symmetric and therefore corresponds to approximately . However, a small asymmetry in its charge composition has previously been measured [18]. Thus the photoproduction estimate is , which is statistically subtracted from the sample.
Diffractive DIS events are selected as a subsample of the inclusive DIS event sample on the basis of a large rapidity gap in the forward direction. The pseudorapidity of the forward-most energy deposit above MeV in the LAr calorimeter is required to be less than . In addition, the FMD, Plug and FTS are required to have no discernible signal above their typical noise levels. The combined efficiency for rejecting proton dissociative events with is greater than . These requirements select a subsample of events where the hadronic final state is separated into two systems and by a large rapidity gap. The system , which is predominantly a single proton, escapes undetected down the beam-pipe, while the system is fully contained in the main H1 detector.
In order to maintain a high efficiency for the vertex reconstruction of the DDIS event sample, an additional fiducial cut is required to avoid cases where both the final state system and the positron are outside the acceptance of the CJC. The region where both and is removed from the analysis, after which the vertex-efficiency is high and well understood throughout the measured phase space. Finally, there must be at least one reconstructed HFS particle to define the system .
The inclusive DIS event kinematics are reconstructed using different methods depending on the range of a given dataset. For the LME data, only information from the reconstructed scattered positron is used, as this method has the best resolution at large :
| (7) |
Here, is the energy of the incident positron and and are the energy and polar angle of the scattered positron, respectively. For the data, a method with better performance at low is used [36]:
| (8) |
where and is the polar angle of the hadronic final state.
The four momentum of the final state system is reconstructed as the vector sum of all HFS particles. Its mass is reconstructed as:
| (9) |
where denotes the four vector of the HFS and . The term improves the resolution and the function is determined from simulation and corrects for detector losses. The diffractive variables are then reconstructed as:
| (10) |
4.4 Corrections to the data and simulations
Monte Carlo (MC) simulations are used to correct the data for the detector effects of acceptance, inefficiencies, and migrations between measurement intervals. The DDIS signal is modelled for using the RAPGAP [37] generator, with H1 2006 DPDF Fit B [3] as the input DPDFs. Higher order QCD radiation is modelled using initial and final state parton showers in the leading approximation [38]. Hadronisation is simulated using the Lund string model [39] as implemented in PYTHIA [40]. As RAPGAP is a leading order MC generator simulating only , the effect of has been simulated by weighting RAPGAP events by the ratio as given at NLO by H1 2006 DPDF Fit B. This is important at high in order to describe the data. At low , H1 2006 DPDF Fit B undershoots the data, as observed previously [3]. RAPGAP is therefore reweighted for by a parametrisation of the ratio of the previous data to H1 2006 DPDF Fit B. Resonant contributions to the diffractive cross section, important at low and low , are modelled using the DIFFVM [41] generator. The DIFFVM generator is also used to simulate proton dissociative events with to correct the measurements to the and ranges given in equation 5 under the assumption of proton vertex factorisation. The small non-diffractive DIS background from or is modelled using DJANGO [42], while the COMPTON program [43] is used to model the QED Compton process, important at very low .
The generated events are passed through a full GEANT [44] simulation of the H1 detector. The simulated events are subjected to the same reconstruction and analysis chain as the data. More details of the analysis can be found in [45].
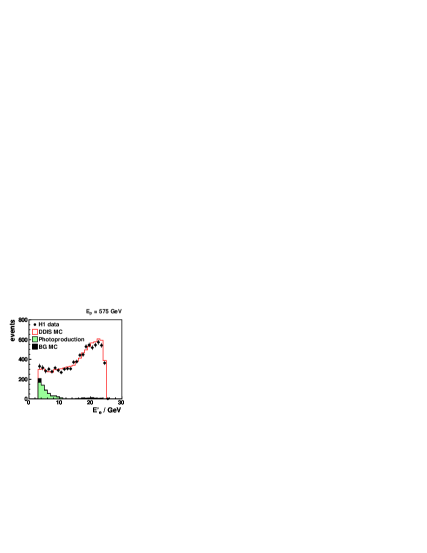
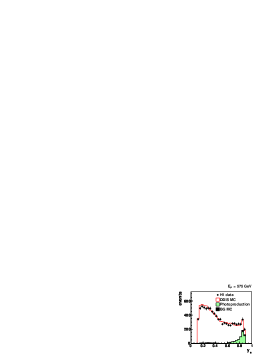
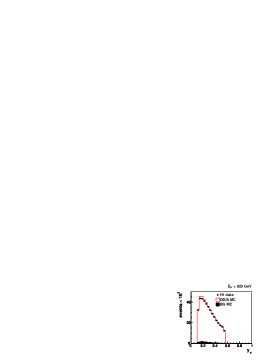
Figure 2 shows the energy distributions for positron candidates in the LME datasets. In addition to the simulation described above, the photoproduction estimate using the number of candidates with the wrong charge, and the total background expectation are also shown. The data are well described down to positron energies of .
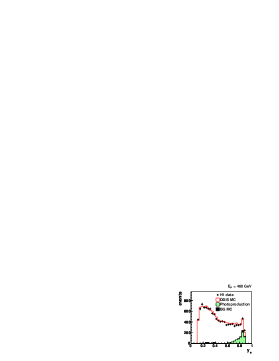
The quality of the calibration of the system , in the sensitive region at high , is illustrated in figure 3, where peaks at the expected value of and is well described by the simulation. At large , the hadronic energy measurement is strongly influenced by the hadronic energy response of the SpaCal, which has been calibrated using inclusive DIS events [45]. The influence of varying the SpaCal hadronic energy scale by is indicated in the figure.
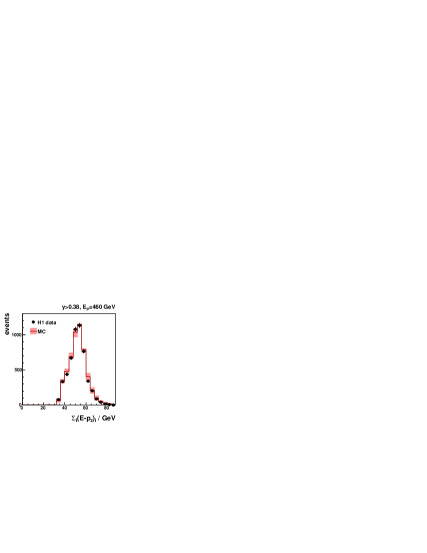
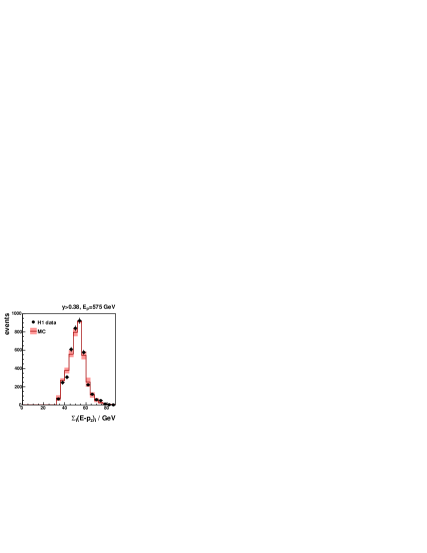
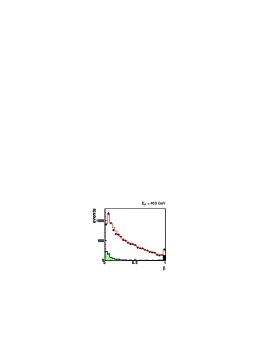
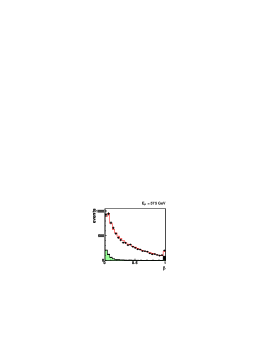
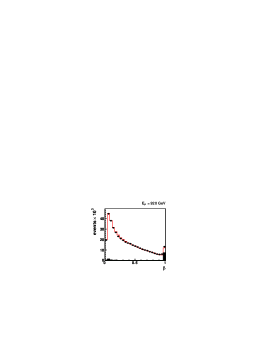
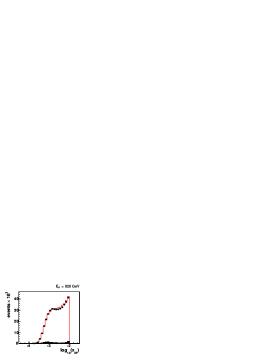
The and distributions in the data are compared with the total expectation in figure 4 for all three datasets. Again, the photoproduction estimate and the sum of all other background sources are also shown. The quality of the description is good in all cases.
4.5 Cross section extraction
The data are analysed in two ranges. For , data are available from all three datasets at and . For , only data from the and datasets are analysed. Previous measurements at [3] are used in addition in the and range of the LME data. The , and values of these published data have been adjusted to the values of the current analysis using a parameterisation of derived from H1 2006 Fit B, a procedure which results in a systematic uncertainty of at and at . The reduced cross section is extracted as a function of , and from measurements of the differential cross section according to equation 3. The and measurement intervals are large and have been optimised for the extraction of in as broad a kinematic range as possible.
The data are corrected for efficiencies and migrations between measurement intervals using the MC simulation described in section 4.4. The acceptance, as calculated from the MC model, is required to be above for all points and is much larger than this except at the lowest and . Purity and stability111 Purity is defined as the fraction of reconstructed MC events in a measurement interval which also originated in the same interval at the hadron level. Stability is the fraction of MC events in a measurement interval at the hadron level which are also reconstructed in that interval. are larger than in all bins. For the LME data, the estimate of the photoproduction background using the number of candidates with the wrong charge, , is subtracted bin-by-bin for , while below this value the background is negligible. Inclusive DIS and QED-Compton contributions are also subtracted bin-by-bin using the MC simulations described in section 4.4. The parametrisation of using H1 2006 DPDF Fit B is used to correct the data to the central , and values quoted. As , the shape of the cross section is largely unconstrained by data and varies quickly due to resonant contributions, making the correction to a single point in the phase space problematic. Thus, for , the average cross section in that interval is given.
The diffractive reduced cross section is integrated over the and ranges given in equation 5. DIFFVM is used to calculate the correction to this phase space, which varies with proton beam energy. The correction factors are , and for the , and data, respectively.
For use in forming the ratio , inclusive cross sections are measured in the same binning scheme as is used for the diffractive measurement, using the procedure described in [18]. As the statistics for the inclusive DIS sample are larger, the background subtraction is more sophisticated. The number of events passing the full analysis selection and having a signal in the ETAG photoproduction tagger and a negatively charged linked track associated to a SpaCal cluster provides another estimate of the photoproduction background. For the data, at low , the photoproduction estimate uses , while for higher the photoproduction background is estimated using the number of candidates with the wrong charge, . For the data, the estimate based on positron-tagged events is used for all .
4.6 Systematic uncertainties
A full systematic error analysis is performed, which carefully considers correlations between measurement intervals and data at different centre-of-mass energies. The sources of systematic uncertainty that have correlations between cross section measurement points at different values are as follows.
-
•
The uncertainty on the electromagnetic energy scale of the SpaCal is at the kinematic peak of , increasing linearly such that it would be at .
-
•
The possible bias in is estimated using the mean difference in polar angle between the linked track and the SpaCal cluster, which is measured to be less than mrad.
-
•
Noise is simulated in the LAr calorimeter using randomly-triggered events. The fraction of energy identified and subtracted as noise is known to a precision of .
-
•
The hadronic section of the SpaCal is calibrated to a precision of . The uncertainty on the hadronic energy scale of the LAr calorimeter is and is found to have only a small effect on the cross sections in the present analysis.
-
•
The efficiency of the cut on the logarithmic energy-weighted cluster radius, , is known to a precision of and for , and , respectively.
-
•
The charge asymmetry in the lepton candidates from photoproduction background events of is known to precision [18].
-
•
The RAPGAP MC is weighted by the ratio of in order to describe the data at high . The associated uncertainty is evaluated by replacing in the expression used for in the reweighting procedure (equation 4) by either or .
-
•
The kinematic dependences of the model used to correct the data are generally well constrained from previous measurements. The uncertainties on the , and dependences are evaluated by weighting the generator-level kinematics by , , and . The effects of weighting in and are found to have a negligible effect on the measured cross sections.
-
•
The uncertainty due to the resonant contributions modelled by DIFFVM is evaluated by calculating the change in acceptance when including this contribution in the simulation or not.
-
•
The non-diffractive DIS and QED-Compton backgrounds are modelled using MC simulations and are statistically subtracted from the data. The non-diffractive DIS background has a negligible effect in this analysis except at the highest . The QED-Compton events are only relevant for . The normalisations of these backgrounds are controlled at the level of and , respectively.
-
•
The corrections due to the finite measurement intervals (bin-centre corrections) are subject to an uncertainty, which is evaluated from the change in these corrections when this procedure is carried out using the H1 2006 DPDF Fit A and Fit B parameterisations of the reduced cross section. The uncertainty is very small except at large , where the shape of is not well constrained, and at low , corresponding to high .
Sources of experimental uncertainty which lead to systematic errors which are not correlated between data at different values are the statistical errors of the MC simulations and the following.
-
•
The vertex reconstruction efficiency of the CJC is controlled to the level of for and for .
-
•
The trigger efficiency is and measured with a precision of using independently-triggered data.
-
•
The uncertainty in the efficiency of linking a track to a SpaCal cluster is .
-
•
The uncertainty on the efficiency of the forward detector selection for rejecting proton dissociative events is [45].
The model dependent uncertainties on the factors applied in correcting the measurements to the and ranges given in equation 5 are evaluated using the method described in [3]. The resulting normalisation uncertainities are for all beam energies, dominated by the uncertainty on the ratio of proton elastic to proton dissociative cross sections. This is added in quadrature to the uncertainty of on the luminosity measurement to obtain the total normalisation uncertainty of for the (LME) data.
A full decomposition of the systematic errors on the measured cross sections is given in tables 2, 3 and 4. Correlated sources of uncertainty that are always smaller than and are never the dominant correlated source in a single bin are omitted. For the LME data, the precision of the cross section measurements is statistically limited in the region of greatest sensitivity to at high . Elsewhere in the LME data, the systematic errors are of similar size to the statistical errors. The precision of reached in the best-measured regions for the data is the highest accuracy achieved in H1 measurements of to date. The data are limited by the systematic uncertainties throughout the measured range, the dominant source of systematic uncertainty varying with the kinematics. The largest correlated uncertainty at low comes from the modelling of the LAr noise, with the vector meson simulation also playing an important role. At low (high ), where is measured, the largest sources of uncertainty are the photoproduction background subtraction, the efficiency of the cut and the model dependence arising from the treatment in the MC simulation. The uncertainty arising from imperfect knowledge of the bin-centre corrections can also be large, typically at large , low or low .
4.7 Extraction of
The separation of and follows a similar procedure to that which was used to extract their inclusive counterparts and [18]. The diffractive reduced cross section is integrated over the and ranges given in equation 5. The uncertainty on correcting an individual dataset to that range is large () but strongly correlated between datasets. The residual difference in normalisation between the three datasets after all corrections is determined from comparisons of at low to be . In order to extract optimally, the cross sections are normalised to the H1 2006 DPDF Fit B result in a range where the sensitivity to is minimal, but the statistical precision and kinematic overlap of the data is still sufficient. Data in the range , and ( and ) for the ( and ) datasets are used, yielding normalisation factors of , and , respectively. As the published data at were included in the analysis of the data used as input to the H1 2006 DPDF Fit B, they are already consistently normalised.
Following this normalisation procedure, the diffractive longitudinal structure function can be extracted directly from the slope of as a function of for each set of , and values. A linear fit is performed, taking only the statistical errors, , into account in order to calculate the statistical uncertainty on . The fit is repeated, adding the statistical and uncorrelated errors in quadrature, , to calculate the measured value of and the sum of its combined statistical and uncorrelated errors. For each correlated systematic error source, each of the cross section points is adjusted according to the positive and negative shifts222 In fits which include the published data, a more conservative approach is used whereby the data remain fixed. This results in a larger variation in the slope of as a function of with a correspondingly larger uncertainty on . and the fit is repeated using for the errors on the cross section points. The error on is taken as half of the difference between fits to the positive and negative shifted data points. All of these correlated errors are added in quadrature with to give the total error on . The normalisation uncertainty on the value of is set by the normalisation uncertainty on the cross section measurements and is therefore .
As only bin-averaged cross sections are available at the highest , is not extracted in that region.
4.8 Extraction of and the ratio
The photoabsorption ratio for diffraction, , is extracted from linear fits to the data by reparametrising equation 4 such that and become the free parameters of the fit:
| (11) |
The error on is calculated in the same way as for , detailed in section 4.7. The normalisation uncertainty cancels in this ratio.
In order to calculate the ratio of to its inclusive counterpart , the value of is extracted from the present data using a similar procedure to that used for described above. Only data with are used, where inclusive measurements are made at all beam energies in this analysis. The statistical correlations between the inclusive and diffractive measurements are neglected and the systematic errors are assumed to be dominated by the error on . Similarly to , there is no normalisation uncertainty on the ratio .
5 Results
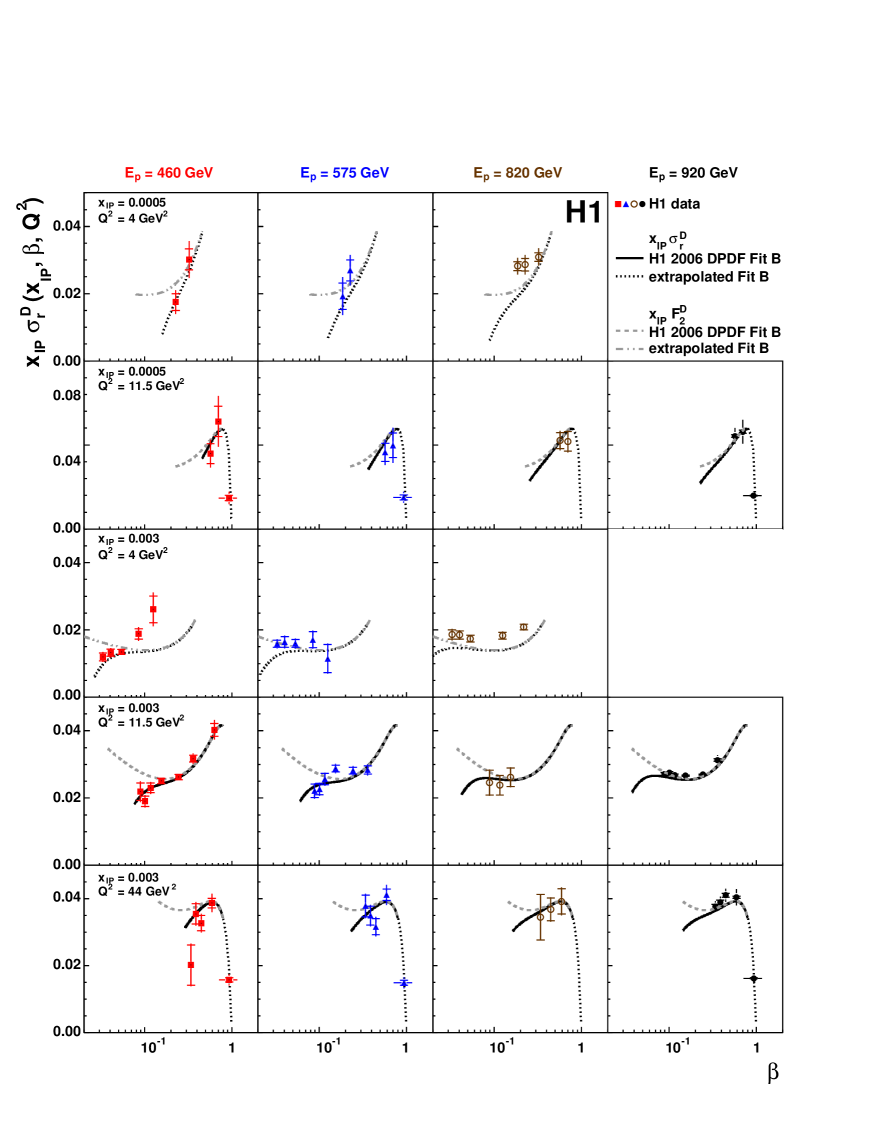
The measured diffractive reduced cross section values and their errors are given in tables 2, 3 and 4. Figure 5 shows the reduced cross section as a function of at fixed and for the LME, and datasets. Also shown is the prediction of H1 2006 DPDF Fit B, which in general describes the data well at . Deviations of the measured cross sections from the predictions at low are evident in the LME data, where the highest values are accessed, notably at and . This shows the sensitivity of the LME data to . The extrapolation to lower of H1 2006 DPDF Fit B, which only included data with , is also compared with the data. The fit is known to significantly undershoot the published data in this region [3], an observation which is reproduced for the new measurements.
The new data at , and , include the highest measurements obtained by H1 to date. They are in remarkably good agreement with the extrapolation of H1 2006 DPDF Fit B and support the hypothesis that as . There is thus no evidence in this region for a large higher twist contribution [24, 26, 27].
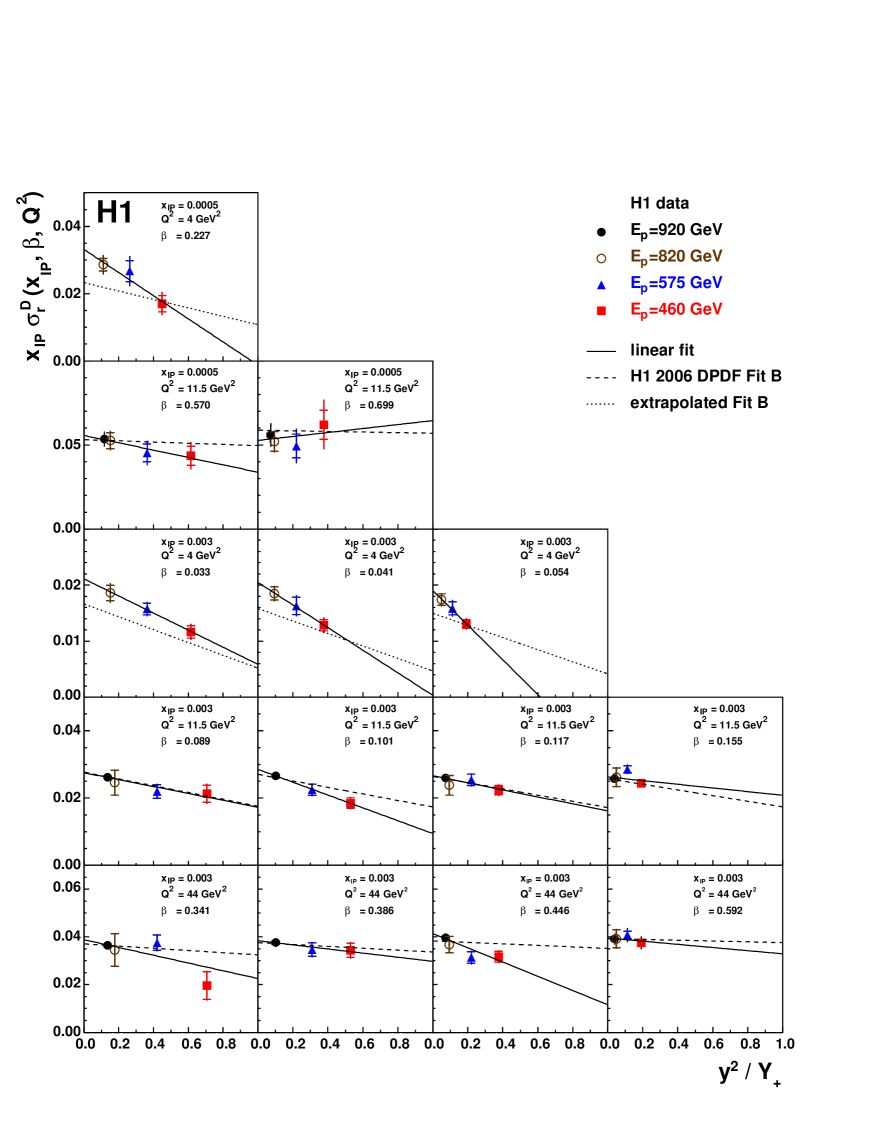
The extraction of via linear fits to the dependence of the reduced cross section at different beam energies and fixed , and is shown in figure 6. The largest lever arm in , and therefore the highest sensitivity to , is at the lowest . The data are consistent with a linear dependence of on , with a significant tendency for to decrease as increases for most , and values. The values of and their errors are given in table 5.
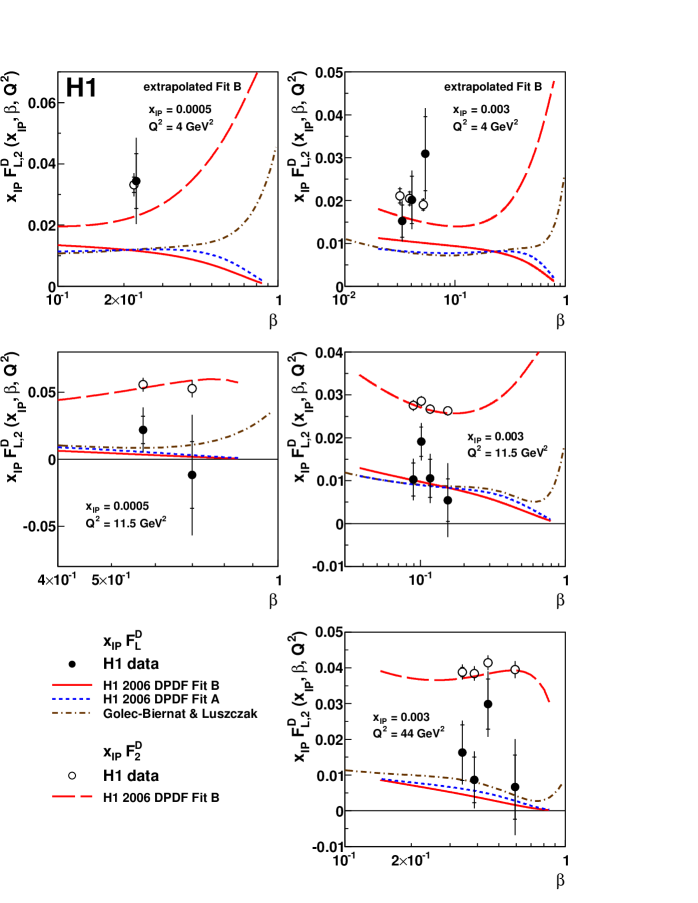
The measurements of , at fixed values of and , are shown as a function of in figure 7. Significantly non-zero measurements of are made for all values of and and five points are greater than zero by more than . The data are compared with the predictions of the H1 DPDF Fits A and B [3] and with the Golec-Biernat & Łuszczak model [29] (section 3). All three models are consistent with the data, although there is a tendency for the measurements to lie above the predictions. Although the prediction of [29] lies significantly above both Fit A and Fit B at large , the experimental precision is insufficient to distinguish between the models. The measured values of are also shown in figure 7. The measurements agree well with the predictions of H1 DPDF Fit B for . Within the uncertainties, all measurements are consistent with the hypothesis that .
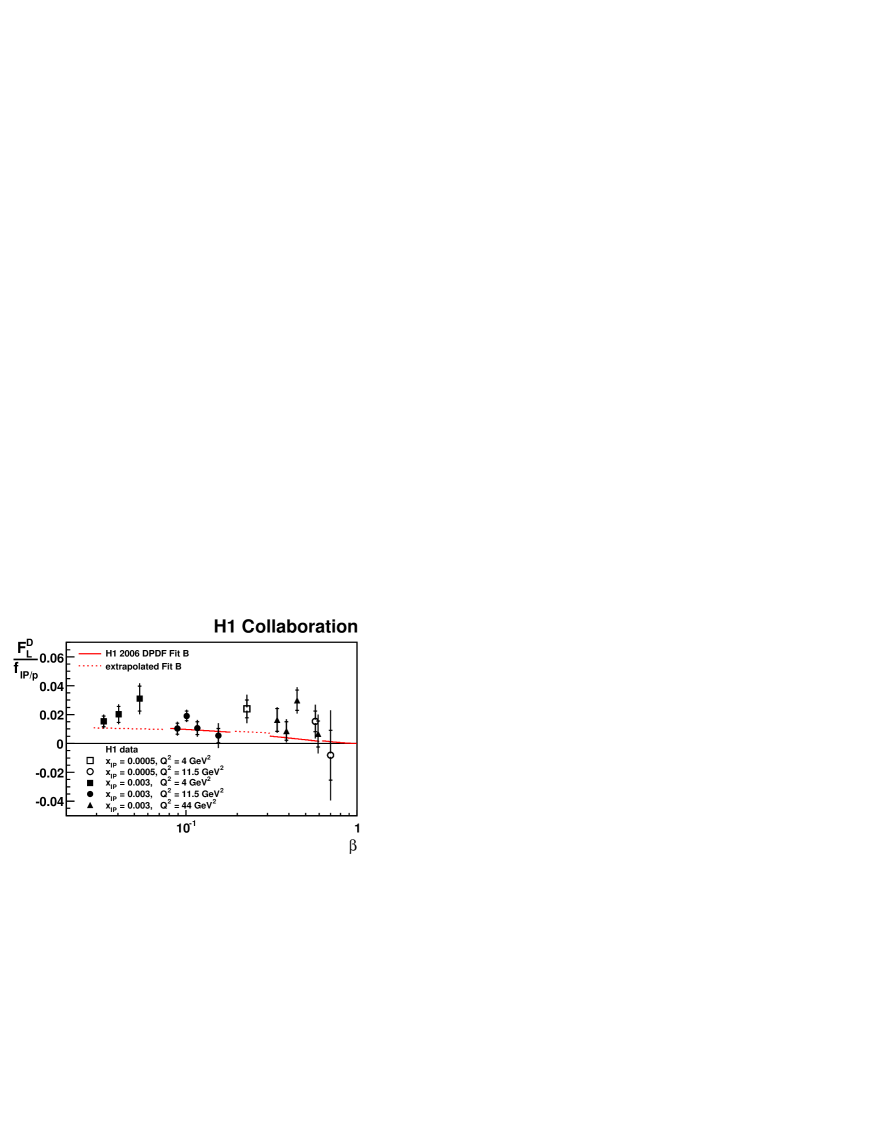
A summary of the measurements is given in figure 8, where the data points from all five and values are shown as a function of and compared with the H1 2006 DPDF Fit B prediction. In order to remove the significant dependence on , the points have been divided by a factor , taken from [3], which expresses the measured dependence of the data, assuming proton vertex factorisation. The remaining discontinuities in the prediction are due to its dependence. The data cover a large range in longitudinal fractional momentum and are compatible with the predicted slow decrease with increasing . The data have a tendency to lie above the prediction although the precision is limited. The most significantly positive measurements lie in the region , which contrasts with models of diffraction such as [24, 26], which do not include leading twist contributions from longitudinally polarised photons.
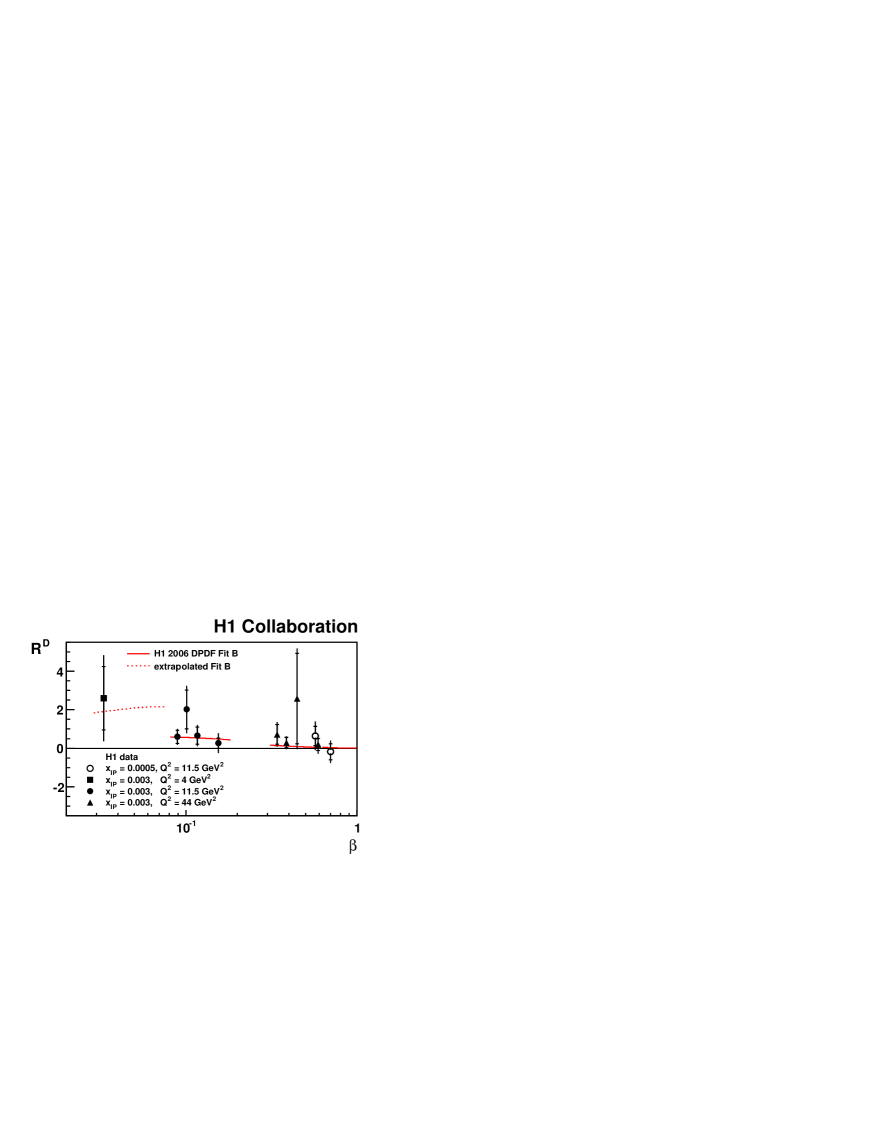
The measurement of is shown as a function of in figure 9. Data with and a relative uncertainty larger than are not shown. The data are compatible with the prediction based on H1 2006 DPDF Fit B, though they are also consistent with other models. The data at indicate that the longitudinally and transversely polarised photon cross sections are of the same order of magnitude ( and ). At , where larger values are accessed, there is a tendency for the data to lie above the prediction, which tends to zero as . There is no evidence for the steep rise in which might be expected at large if configurations similar to vector meson electroproduction were dominant in this region. The values of and their errors are given in table 6.
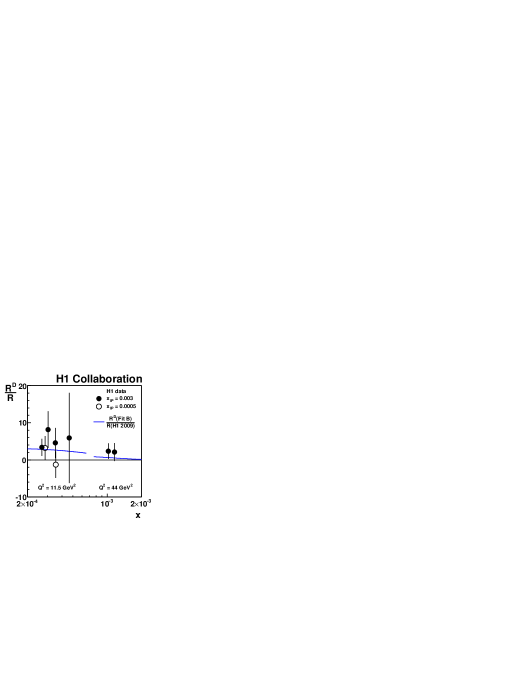
The relative importance in inclusive and diffractive scattering of the longitudinally polarised photon cross section compared with its transverse counterpart is investigated via the ratio , shown as a function of in figure 10. Only data with , where a measurement of is possible in this analysis, are used. Data with and a relative uncertainty greater than are not shown. The ratio data suggest that the longitudinally polarised photon contribution plays a larger role in the diffractive than the inclusive case. Averaged over all data, . The data are well reproduced by the ratio of predictions from H1 2006 DPDF Fit B and an H1 fit to inclusive DIS data, H1 PDF 2009 [46]. At high , corresponding to high and therefore , the prediction decreases towards zero as . The data are consistent with such a decrease with increasing within large experimental uncertainties.
6 Conclusions
First measurements of the diffractive reduced cross section at centre-of-mass energies of and are presented, together with a precise measurement at of . The reduced cross section is measured in the range of photon virtualities and of the longitudinal momentum fraction of the diffractive exchange . The reduced cross section measurements agree well with predictions derived from leading twist NLO QCD fits to previous H1 data throughout the kinematic range. The data at high and medium inelasticity are used to extract the first measurement of the longitudinal diffractive structure function . There is a tendency for the predictions to lie below the data, but the data are compatible with H1 2006 DPDF Fit A and Fit B as well as with a model which includes a higher twist contribution at high , based on a colour dipole approach. The procedure also allows a simultaneous extraction of , independently of assumptions made on , in the same kinematic range. The measurements agree well with the predictions of H1 DPDF Fit B for . Within the uncertainties, all measurements are consistent with the expectation that .
The ratio of diffractive cross sections for longitudinally to transversely polarised photons is measured in the same kinematic range as . At fixed and , this ratio is relatively flat as a function of and suggests that the cross sections for the two polarisation states of the photon are of comparable size. The ratio of to its inclusive scattering counterpart, , is extracted in the region . The data indicate that the longitudinally polarised photon cross section plays a larger role in the diffractive than in the inclusive case. The and measurements are well reproduced by the predictions based on H1 2006 DPDF Fit B and the H1 PDF 2009 inclusive PDF set.
Acknowledgements
We are grateful to the HERA machine group whose outstanding efforts have made this experiment possible. We thank the engineers and technicians for their work in constructing and maintaining the H1 detector, our funding agencies for financial support, the DESY technical staff for continual assistance and the DESY directorate for support and for the hospitality which they extend to the non DESY members of the collaboration. We also thank K. Golec-Biernat for providing us with the Golec-Biernat & Łuszczak model predictions.
References
-
[1]
M. Derrick et al. [ZEUS Collaboration],
Phys. Lett. B 315 (1993) 481;
T. Ahmed et al. [H1 Collaboration], Nucl. Phys. B 429 (1994) 477. - [2] J. Collins, Phys. Rev. D 57 (1998) 3051 [Erratum-ibid. D 61 (2000) 019902] [hep-ph/9709499].
- [3] A. Aktas et al. [H1 Collaboration], Eur. Phys. J. C 48 (2006) 715 [hep-ex/0606004].
- [4] A. Aktas et al. [H1 Collaboration], Eur. Phys. J. C 48 (2006) 749 [hep-ex/0606003].
- [5] F. Aaron et al. [H1 Collaboration], Eur. Phys. J. C 71 (2011) 1578 [arXiv:1010.1476].
- [6] S. Chekanov et al. [ZEUS Collaboration], Nucl. Phys. B 816 (2009) 1 [arXiv:0812.2003].
- [7] S. Chekanov et al. [ZEUS Collaboration], Nucl. Phys. B 831 (2010) 1 [arXiv:0911.4119].
- [8] A. Martin, M. Ryskin and G. Watt, Eur. Phys. J. C 44 (2005) 69 [hep-ph/0504132].
- [9] A. Aktas et al. [H1 Collaboration], JHEP 0710 (2007) 042 [arXiv:0708.3217].
-
[10]
A. Aktas et al. [H1 Collaboration],
Eur. Phys. J. C 50 (2007) 1 [hep-ex/0610076];
S. Chekanov et al. [ZEUS Collaboration], Nucl. Phys. B 672 (2003) 3 [hep-ex/0307068]. -
[11]
J. Blümlein and D. Robaschik,
Phys. Lett. B 517 (2001) 222
[hep-ph/0106037];
J. Blümlein, B. Geyer and D. Robaschik, Nucl. Phys. B 755 (2006) 112 [hep-ph/0605310];
J. Blümlein, D. Robaschik and B. Geyer, Eur. Phys. J. C 61 (2009) 279 [arXiv:0812.1899]. -
[12]
A. Zee, F. Wilczek and S. B. Treiman,
Phys. Rev. D 10 (1974) 2881;
G. Altarelli and G. Martinelli, Phys. Lett. B 76 (1978) 89. -
[13]
L. V. Gribov, E. M. Levin and M. G. Ryskin,
Phys. Rept. 100 (1983) 1;
A. H. Mueller, Nucl. Phys. B 335 (1990) 115;
N. N. Nikolaev and B. G. Zakharov, Z. Phys. C 49 (1991) 607. -
[14]
E. A. Kuraev, L. N. Lipatov and V. S. Fadin,
Sov. Phys. JETP 44 (1976) 443
[Zh. Eksp. Teor. Fiz. 71 (1976) 840];
E. A. Kuraev, L. N. Lipatov and V. S. Fadin, Sov. Phys. JETP 45 (1977) 199 [Zh. Eksp. Teor. Fiz. 72 (1977) 377];
I. I. Balitsky and L. N. Lipatov, Sov. J. Nucl. Phys. 28 (1978) 822 [Yad. Fiz. 28 (1978) 1597]. -
[15]
M. Ciafaloni,
Nucl. Phys. B 296 (1988) 49;
S. Catani, F. Fiorani and G. Marchesini, Phys. Lett. B 234 (1990) 339;
S. Catani, F. Fiorani and G. Marchesini, Nucl. Phys. B 336 (1990) 18;
G. Marchesini, Nucl. Phys. B 445 (1995) 49 [hep-ph/9412327]. - [16] S. Chekanov et al. [ZEUS Collaboration], Eur. Phys. J. C 38 (2004) 43 [hep-ex/0408009].
- [17] M. Diehl, Proceedings of the Blois Workshop on Elastic and Diffractive Scattering, Blois, France, May 2005, hep-ph/0509107.
- [18] F. D. Aaron et al. [H1 Collaboration], Phys. Lett. B 665 (2008) 139 [arXiv:0805.2809].
- [19] F. D. Aaron et al. [H1 Collaboration], Eur. Phys. J. C 71 (2011) 1579 [arXiv:1012.4355].
- [20] P. R. Newman, Proceedings of the ‘HERA and the LHC’ Workshop, eds. A. de Roeck, H. Jung, CERN-2005-14 (2005) 514 [hep-ex/0511047].
- [21] F. D. Aaron et al. [H1 Collaboration], Eur. Phys. J. C 63 (2009) 625 [arXiv:0904.0929].
- [22] F. D. Aaron et al. [H1 Collaboration], JHEP 1005 (2010) 032 [arXiv:0910.5831].
- [23] R. Brock et al. [CTEQ Collaboration], Rev. Mod. Phys. 67 (1995) 157.
-
[24]
K. J. Golec-Biernat and M. Wüsthoff,
Phys. Rev. D 59 (1998) 014017
[hep-ph/9807513];
K. J. Golec-Biernat and M. Wüsthoff, Phys. Rev. D 60 (1999) 114023 [hep-ph/9903358]. - [25] H. Kowalski, L. Motyka and G. Watt, Phys. Rev. D 74 (2006) 074016 [hep-ph/0606272].
- [26] J. Bartels, J. R. Ellis, H. Kowalski and M. Wüsthoff, Eur. Phys. J. C 7 (1999) 443 [hep-ph/9803497].
- [27] A. Hebecker and T. Teubner, Phys. Lett. B 498 (2001) 16 [hep-ph/0010273].
-
[28]
M. G. Ryskin,
Z. Phys. C 57 (1993) 89;
A. D. Martin, M. G. Ryskin and T. Teubner, Phys. Rev. D 62 (2000) 014022 [hep-ph/9912551]. - [29] K. J. Golec-Biernat and A. Łuszczak, Phys. Rev. D 76 (2007) 114014 [arXiv:0704.1608].
-
[30]
I. Abt et al. [H1 Collaboration],
Nucl. Instrum. Meth. A 386 (1997) 310;
I. Abt et al. [H1 Collaboration], Nucl. Instrum. Meth. A 386 (1997) 348;
R. Appuhn et al. [H1 SPACAL Group], Nucl. Instrum. Meth. A 386 (1997) 397. - [31] D. Pitzl et al., Nucl. Instr. and Meth. A454 (2000) 334 [hep-ex/0002044].
- [32] J. Becker et al., Nucl. Instrum. Meth. A 586 (2008) 190 [arXiv:physics/0701002].
-
[33]
B. Andrieu et al. [H1 Calorimeter Group],
Nucl. Instrum. Meth. A 350 (1994) 57.
B. Andrieu et al. [H1 Calorimeter Group], Nucl. Instrum. Meth. A 336 (1993) 499. - [34] S. Piec, Doctoral thesis, Humboldt-Universität zu Berlin (2009) ”Measurement of the Proton Structure Function with the H1 Detector at HERA”, [http://www-h1.desy.de/psfiles/theses/h1th-546.pdf].
- [35] M. Peez, Ph.D. thesis (in French), University of Lyon (2003), ”Search for Deviations from the Standard Model in High Transverse Energy Processes at the Electron-Proton Collider HERA”, [http://www-h1.desy.de/psfiles/theses/h1th-317.ps].
- [36] C. Adloff et al. [H1 Collaboration], Z. Phys. C 76 (1997) 613 [hep-ex/9708016].
- [37] RAPGAP 3.1: H. Jung, Comput. Phys. Commun. 86 (1995) 147.
- [38] M. Bengtsson and T. Sjöstrand, Z. Phys. C 37 (1988) 465.
- [39] B. Andersson, G. Gustafson, G. Ingelman and T. Sjöstrand, Phys. Rept. 97 (1983) 31.
- [40] T. Sjöstrand, Comput. Phys. Commun. 82 (1994) 74.
- [41] B. List, A. Mastroberardino, in A. Doyle et al. (eds.), Proceedings of the Workshop on Monte Carlo Generators for HERA Physics, DESY-PROC-1999-02 (1999) 396.
- [42] G. Schüler and H. Spiesberger, Proc. of the Workshop on Physics at HERA, eds. W. Buchmüller, G. Ingelman, Hamburg, DESY (1992) 1419.
- [43] A. Courau and P. Kessler, Phys. Rev. D 46 (1992) 117.
- [44] R. Brun et al., CERN-DD/EE-84-1 (1987).
- [45] D. Salek, Ph.D. thesis, Charles University, Prague (2010), ”Measurement of the Longitudinal Proton Structure Function in Diffraction at the H1 Experiment and Prospects for Diffraction at LHC”, [http://www-h1.desy.de/psfiles/theses/h1th-617.pdf].
- [46] F. D. Aaron et al. [H1 Collaboration], Eur. Phys. J. C 64 (2009) 561 [arXiv:0904.3513].