A view of the narrow-line region in the infrared: active galactic nuclei with resolved fine-structure lines in the Spitzer archive
Abstract
We queried the Spitzer archive for high-resolution observations with the Infrared Spectrograph of optically selected active galactic nuclei (AGN) for the purpose of identifying sources with resolved fine-structure lines that would enable studies of the narrow-line region (NLR) at mid-infrared wavelengths. By combining 298 Spitzer spectra with 6 Infrared Space Observatory spectra, we present kinematic information of the NLR for 81 z0.3 AGN. We used the [Ne V], [O IV], [Ne III], and [S IV] lines, whose fluxes correlate well with each other, to probe gas photoionized by the AGN. We found that the widths of the lines are, on average, increasing with the ionization potential of the species that emit them. No correlation of the line width with the critical density of the corresponding transition was found. The velocity dispersion of the gas, , is systematically higher than that of the stars, , in the AGN host galaxy, and it scales with the mass of the central black hole, . Further correlations between the line widths and luminosities , and between and , are suggestive of a three dimensional plane connecting log( ) to a linear combination of log() and log(). Such a plane can be understood within the context of gas motions that are driven by AGN feedback mechanisms, or virialized gas motions with a power-law dependence of the NLR radius on the AGN luminosity. The estimates obtained for 35 type 2 AGN from this plane are consistent with those obtained from the relation.
1 Introduction
Meaningful statistical tests of whether the bulk of black hole (BH) growth precedes, is parallel, or follows the peak of star-formation activity need to rely on the comparison of several observable parameters as a function of look-back time. In addition to the comparison of the star-formation rate (SFR) with the BH accretion rate (e.g., Marconi et al. 2004; Merloni et al. 2004), the comparison of the stellar mass with the BH mass, , that is already accumulated at any given redshift is also desirable. A significant impediment in performing the latter comparison comes from the fact that rapid BH growth often occurs in highly obscured environments, such as type 2 active galactic nuclei (AGN) and infrared (IR) bright galaxies. At low and at low (Seyfert-like) luminosities, , 5070% of the AGN are of type 2 (Ho et al. 1997b; Schmitt et al. 2001; Hao et al. 2005). At z1 and at bolometric luminosities that exceed 1012 , at least 1 out of every 3 AGN is thought to be of type 2 (Lacy et al. 2007; Gilli et al. 2007).
In type 2 systems, the determination of is very challenging. Direct methods of measuring , e.g., by spatially resolved sub-parsec or parsec scale kinematics of stars (Genzel et al. 1997), ionized gas (Harms et al. 1994; Macchetto et al. 1997), or water masers (Miyoshi et al. 1995), can only be applicable to very local objects. An alternative method that is successfully applied to type 1 AGN even at high (Kaspi et al. 2007) uses the kinematics and the radial extent of gas clouds that are close enough to the BH to be gravitationally influenced by it. These clouds constitute the AGN broad line region (BLR). Emission lines tracing the BLR, such as H, Mg II and C IV, have typical full width at half maxima (FWHM) exceeding 2000 km s-1. The BLR radius is determined by reverberation mapping experiments, which use the natural variability of the AGN continuum and the time-delayed response of the gas (de)excitation to compute the light travel time across the BLR (Blandford & McKee 1982; Peterson 1993; Kaspi et al. 2000). Assuming that the clouds are virialized, their distance from the BH and their velocity dispersion can be used to determine an enclosed dynamical mass and, thus, . However, the method is not applicable to type 2 AGN where the BLR is obscured.
The lines that are seen in both type 1 and type 2 AGN are those that typically originate from gas clouds at a few pc to a few hundreds of pc away from the BH (Netzer 2004; Laor 2007 and references therein). These narrow-line-region (NLR) clouds have FWHM that are typically 1000 km s-1. Using the [O III] 5007 Å line, Nelson & Whittle (1996) demonstrated that the bulk of the gas traced by [O III] has a velocity dispersion that is comparable to that of the stars in the host-galaxy bulge. Subsequently, was found to scale with the width of the [O III] emission (Nelson 2000; Shields et al. 2003; Greene & Ho 2005). A similar result was found for the [N II] line at 6583 Å by Ho (2009).
Optical NLR lines can suffer severe obscuration (Kauffmann et al. 2003). This makes IR wavelengths more reliable and often unique for investigating relations between NLR kinematics and . To optimize the use of narrow lines as gravitational potential tracers for obscured AGN, we performed a similar analysis in mid-infrared (MIR) wavelengths using Spitzer and Infrared Space Observatory (ISO) high-resolution spectra. We demonstrated that the widths of the NLR lines [Ne V] at 14.32 m and [O IV] at 25.89 m also scale with (Dasyra et al. 2008). This result could provide a means of probing NLR kinematics and weighing BH masses in obscured galaxies at high with the next generation IR telescopes.
The goal of this paper is to perform an extended study of the NLR kinematics of optically selected type 1 and type 2 AGN in the MIR using all spectra that are available in the Spitzer archive. We aim to investigate for differences in the gas kinematics as traced by various fine-structure lines, to test how the gas velocities compare with , and to further estimate the masses of local obscured AGN. For all computations, we use a CDM cosmology with =70 km s-1 Mpc-1, =0.3, and =0.7.
2 The Sample
To study the NLR gas kinematics as probed by MIR emission lines, we queried the entire Spitzer archive for high-resolution observations of AGN obtained with the Infrared Spectrograph (IRS; Houck et al. 2004). These spectra have a resolving power of 500 km s-1, sufficient for resolving features in the NLR of several local AGN (Dasyra et al. 2008). We downloaded the reserved observations catalog (ROC) after the completion of Spitzer’s cryogenic mission to ensure that all archival data that can be used for this study are included in our sample. We found 1366 astronomical observation requests (AORs) containing high-resolution IRS spectra of extragalactic sources performed in either single-target or cluster mode.
We matched all IRS targets with optical spectroscopic catalogs of AGN to identify type 1 sources with existing estimates and [O III] 5007 Å detections that are required for the comparison of NLR kinematics at various wavelengths. For this purpose, we used i) the reverberation mapping catalogs of Peterson et al. (2004), Bentz et al. (2006), Bentz et al. (2009), and Denney et al. (2010), ii) the spectroscopic subsample of the Palomar-Green (PG) QSOs (Boroson & Green 1992; Vestergaard & Peterson 2006), iii) the optical spectroscopic catalog of Marziani et al. (2003), iv) the Ho & Kim (2009) catalog of type 1 AGN, v) the Sloan digital sky survey (SDSS) data release 4 AGN catalogs of Kauffmann et al. (2003), of Greene & Ho (2005), and of Netzer & Traktenbrot (2007), and vii) the SDSS data release 7 (DR7). To identify AGN in the DR7, we used the Baldwin et al. (1981) diagnostic diagram of [O III]/Hβ versus [N II]/Hα with the AGN boundaries as updated by Kewley et al. (2006). We also examined sources that have a QSO target type, or a broad-line or AGN spectral type subclass assigned by the SDSS pipeline. These samples also include a few type 2 AGN, which we further complemented by matching all IRS targets with the Mulchaey et al. (1994), Turner et al. (1997), Bassani et al. (1999), Zakamska et al. (2003), Reyes et al. (2008), Bennert et al. (2009), and Liu et al. (2009) catalogs. A few additional optical spectra of type 2 AGN were found in Spinelli et al. (2006)
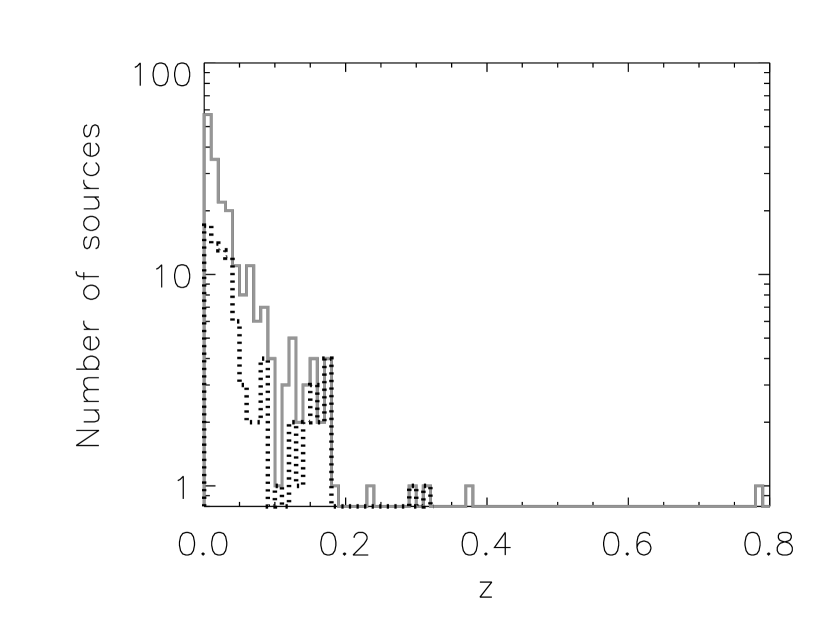
In total, we found and reduced datasets from 370 Spitzer AORs, corresponding to high-resolution spectra of 298 sources. Resolved NLR lines were determined from the inspection of the [S IV] 10.51 m, [Ne III] 15.56 m, [O IV] 25.89 m, or [Ne V] 14.32 m profiles as described in Section 3.2. To these 298 AGN, we added 6 sources with fine structure lines that were similarly resolved by ISO short wavelength spectrograph (SWS) data (Sturm et al. 2002; Dasyra et al. 2008). The redshift distribution of all 304 sources in the final sample is shown in Figure 1. The 42 type 1 AGN and the 39 type 2 AGN that have resolved MIR narrow lines are presented in Tables 1 and 2, respectively.
3 Data Reduction
3.1 Spectral Extraction
We downloaded the Spitzer S15.0 pipeline basic calibration data (BCD) files. We used both staring and mapping observations, taken on either single-source or cluster mode.
The BCD files of the long-high (LH) wavelength data of each source were processed by the IDL routine DARK SETTLE, which is posted at the Spitzer Science Center (SSC) web site, to correct for gradations of the dark current along the detector that lead to order tilting and mismatch. Using the short-high (SH) BCD files and the dark-settle corrected LH BCD files, we computed the average frame for each set of on-source observations, namely, for each each target, nod position, and module. To identify cosmic ray hits, we also computed the median frame for the same set of observations and compared it to the average frame on a pixel by pixel basis. A pixel was flagged if the difference between the median and the average frame value differed by a factor of more than three times the root-mean square (rms) noise in the median frame. For this pixel, the average value was replaced by the median value. For sources with available observations on sky111 Several programs whose scientific goals required only the use of line fluxes (but not the use of equivalent widths or continuum flux measurements) did not acquire sky observations given that the flux of a line does not depend on its underlying continuum level., we also computed the median sky frame, which we subtracted from the on-source frame.
The next step was the removal of bad and rogue (i.e., slowly varying time response) pixels. We used the individual sky frames to create a generic bad pixel mask for all sources observed in a single Spitzer campaign, which we merged with the bad pixel map available at the SSC web site for the same campaign. We then merged this generic mask with the mask of each individual (on-source and on-sky) exposure to create the mask for each science frame, nod position, and module. We proceeded to further masking of outliers, i.e., pixels that were located a couple of columns away from the edges of each spectral order, and that had a value exceeding the rms noise of the science frame. Their values were replaced with the median value of the frame, computed using only pixels in the useful detector range. A final visual inspection and manual cleaning of the science frames was performed using the IRSCLEAN routine. All rogue pixels and outliers were flagged in the mask file.
The uncertainty of the average on-source frame was calculated as the square root of the sum of the squares of all individual uncertainty files, divided by the number of exposures. When sky observations were available, we computed the sky frame uncertainty in a similar way and combined it with the on-source frame uncertainty to produce the uncertainty of the final science frame.
We used the science frame, together with its uncertainty and mask files as input to the SSC software SPICE, which produces a one-dimensional spectrum from a two-dimensional spectral image. To extract the spectra, we used the regular extraction mode, which equally weighs pixels when collapsing them along each row. We assumed a point source extraction, since the LH and SH apertures (223111 and 11347, respectively) are likely to include the bulk of the NLR emission for most sources in our sample. The end product of SPICE is the wavelength and flux calibrated spectrum for each individual order.
We merged the spectra of the various orders to a single spectrum for each nod position, clipping noisy edges (between 2-25 pixels, depending on the order). This task was performed for both the SH and the LH datasets. The SH and LH spectra were then merged to produce the full-range spectrum per nod position. The final spectrum of each object was produced by averaging the one-dimensional, full-range spectra of the two nod positions. Special care was taken not to merge sky-subtracted and non-sky-subtracted datasets for sources with observations from different programs. At the wavelengths of key atomic/molecular lines, only nod positions without bad pixels were used, when possible. For all other pixels with a bad pixel flag in one nod position, we only kept the value of the second nod position when the two values differed by more than the local rms noise value.
3.2 Line Fitting
As in Dasyra et al. (2008)222All previously presented data were reanalyzed to account for changes in the Spitzer pipeline, and for enhancements in our bad-pixel identification routines., we fitted all lines and their underlying continua using Gaussian and second-order polynomial functions, respectively. Gaussian fitting was preferred over direct FWHM computations which, given the resolution of IRS, can only be reliably performed for few high-velocity systems (e.g., Spoon & Holt 2009). Gaussian fitting also suits best the studies of cloud kinematics on virial, regular, or symmetric motions, instead of clouds that are entrained by asymmetric outflows (Greene & Ho 2005).
To claim a line detection, we required that its signal-to-noise ratio (S/N) was greater than 3. To measure line widths, however, we only used lines with S/N5 to avoid studying profiles of barely detected lines. We considered resolved all lines with , where is the measured velocity dispersion, is the instrumental resolution at a given wavelength divided by 2.35, and is the error of . The average resolution value in the 12.018.0 m range, which comprises all neon lines for the low galaxies, is 50766 km s-1. The 25.034.2 m range, which comprises most of the O IV emission, has an average resolution of 50363 km s-1. The error of , , encapsulates both measurement and instrumental uncertainties. It was computed as , where is the standard deviation of the different velocity dispersion values that were obtained for each line when using different polynomial functions to describe its underlying continuum. Intrinsic velocity dispersions, , were computed as , converted to restframe, and presented in Tables 1 and 2 for key fine-structure lines in all sources.
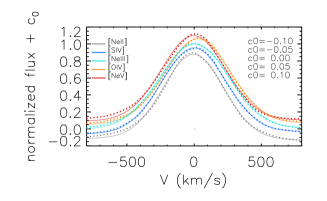
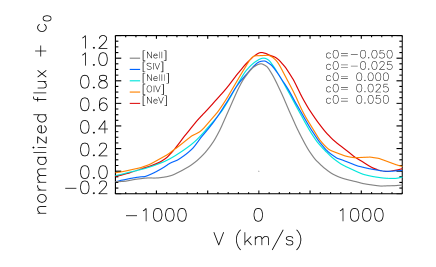
To assess possible systematic errors in the wavelength calibration, we normalized and stacked the line profiles of 29 sources with detected but unresolved emission lines of [Ne II], [S IV], [Ne III], [O IV], and [Ne V] (Figure 2). The stacking of unresolved lines in different- sources permitted for a finer sampling of the instrumental resolution curve than that determined by the detector pixel size. We only used sources at 0.02 to study systematic effects within a few pixels from the restframe wavelength of each line. This cutoff translates to 25 pixels at the center of the SH array range, 14.7 µm. We found that line peak offsets due to such systematics are typically limited to 50 km s-1.
4 Results
4.1 Identifying NLR Tracers in the MIR
Of the 304 AGN in our sample, 300 had spectral coverage at 10.51 m, and 143 showed [S IV] emission. Similarly, 226 sources had spectral coverage at 25.89 m, and 135 had [O IV] detections. Thus, the typical line detection rate was of order 50%.
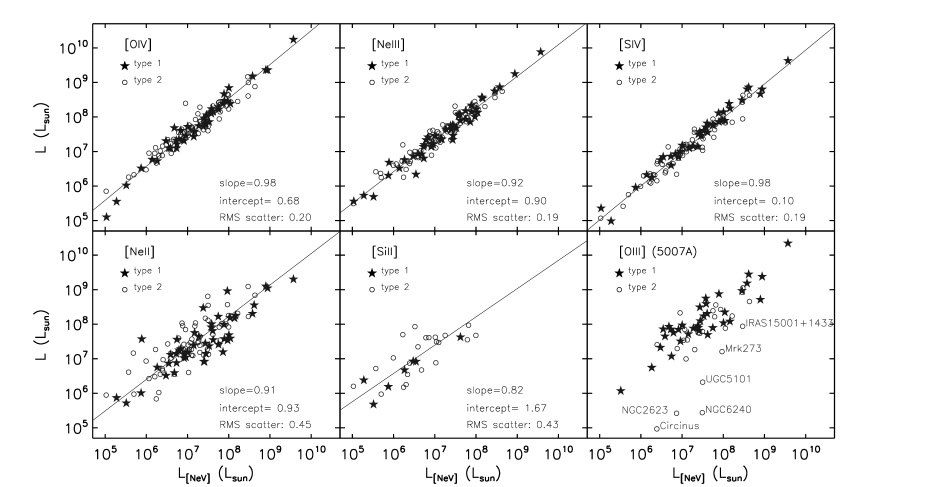
We plotted the luminosities of the most frequently observed MIR lines against that of [Ne V] to identify fine-structure lines that can be reliably used as tracers of the gas that is photoionized by the AGN (Figure 3). Given that photons of at least 97.12 eV are required to ionize Ne IV to Ne V, its ionization source must be far-ultraviolet or soft X-ray radiation from the AGN. We find that the [Ne V] luminosity is on a tight correlation of 0.2 dex scatter with the [O IV] and [S IV] luminosities (Figure 3; Pereira-Santaella et al. 2010), and we further confirm that the [Ne V] and [Ne III] luminosities trace each other well (Gorjian et al. 2007). Therefore, the Ne V, O IV, Ne III, and S IV ions are most likely to be primarily excited by the same mechanism. However, the scatter between the luminosities of [Ne V] and [Ne II] or [Si II] is approximately twice as high, of 0.40.5 dex. Ne II and Si II have low ionization potentials (21.56 and 8.15 eV, respectively), thus, a non-negligible part of their line emission could be tracing star-forming regions in the AGN host galaxy.
The excellent, almost one-to-one correlation over several orders of magnitude in luminosity that is seen between the [Ne V] 14.32 m and [S IV] 10.51 m lines does not include any extinction correction. This result indicates that the bulk of the [S IV] emission is not strongly affected by the silicate absorption feature centered at 9.7 m, which is seen in several of our targets with moderate or high optical depths, i.e. 0.5. Thus, the geometric distribution of the silicates is likely to be more compact than the size of the NLR (see also Soifer et al. 2002; Tristram et al. 2007; Schweitzer et al. 2008). While obscuration effects do not significantly affect the relative fluxes of MIR lines, the [O III] 5007 Å emission can suffer from strong extinction primarily in type 2 AGN (Figure 3).
![[Uncaptioned image]](/html/1107.3397/assets/x5.png)
Figure 4 continued.
![[Uncaptioned image]](/html/1107.3397/assets/x7.png)
Figure 5 continued.
4.2 Line Profiles: Velocity Dispersion of Different Ionized Gas Components
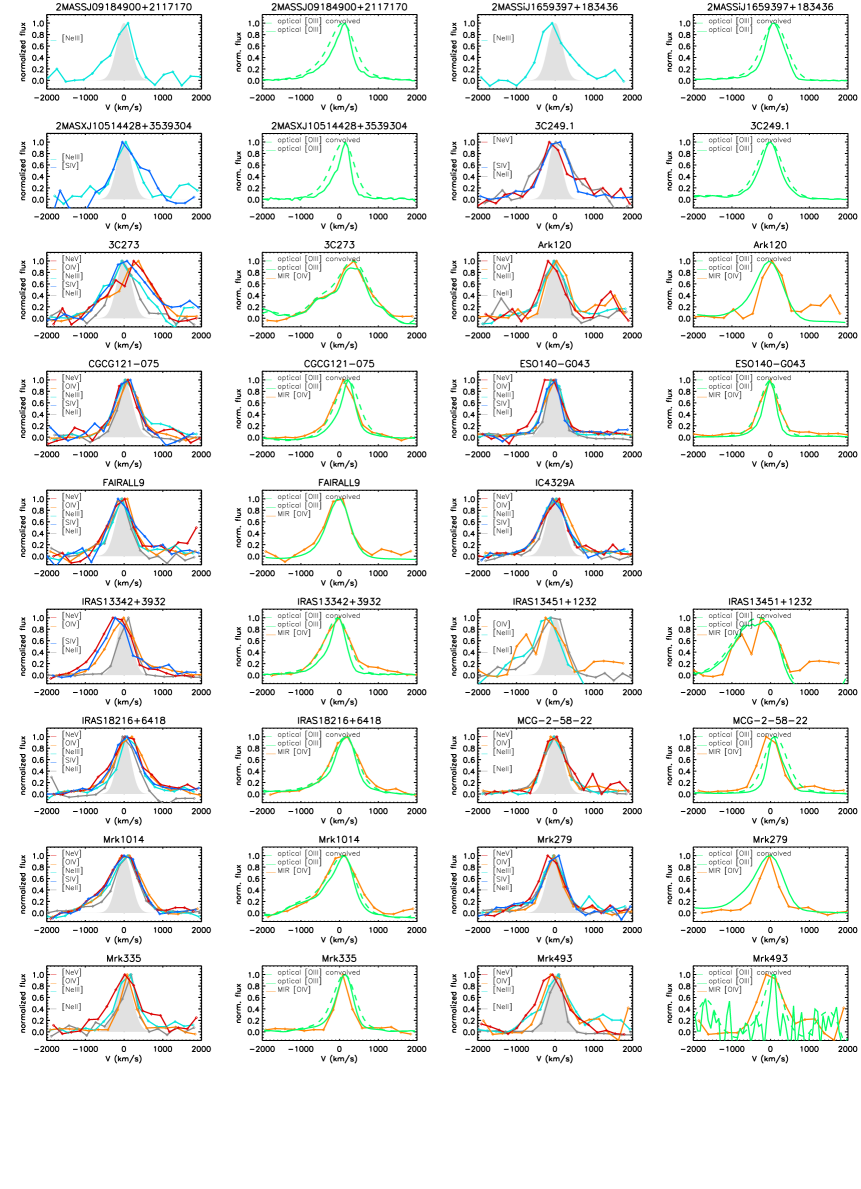
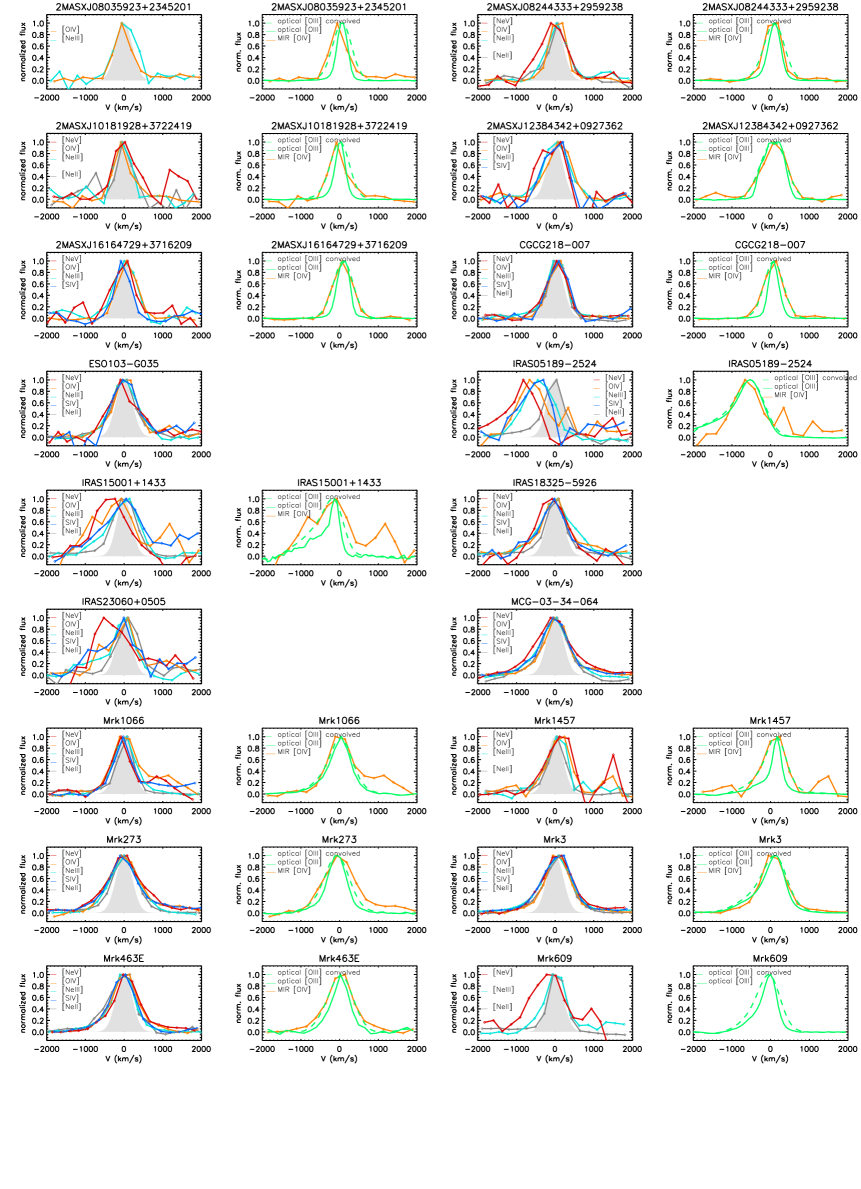
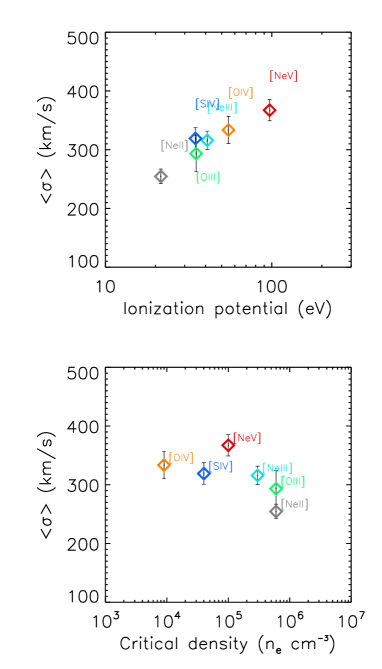
Our query for sources with resolved [S IV], [Ne III], [O IV], or [Ne V] lines resulted in 81 AGN with kinematic information of the NLR gas in the MIR (Figures 4 and 5). The different fine-structure lines that were used as primary tracers of clouds photoionized by the AGN often led to different measurements (Figures 4 and 5). Differences in the ionization potential of the various ionic species can play a major role in determining the observed line profiles, alongside with differences in the critical density for collisional de-excitation of the various transitions, and with light extinction by dust particles. We find the [Ne V] line to be often broader than lines from ions of lower ionization potential (e.g., Mrk590; Figures 4 and 5; Tables 3 and 4). A significant increase in the average velocity dispersion with increasing ionization potential is shown in Figures 6 and 7, as found for 16 sources with resolved profiles in all [Ne II], [O III], [S IV], [Ne III], [O IV], and [Ne V] lines. This result provides evidence for a stratification of the NLR clouds, i.e., for ions of high ionization being located nearer to the BH than ions of low ionization potential (Filippenko & Halpern 1984; Oliva et al. 1994; Ho 2009).
Radially dependent line widths will also be produced if the NLR has a gas density gradient increasing with proximity to the BH (Filippenko & Halpern 1984; Ferguson et al. 1997), which is not connected to a mean ionization level gradient. The line widths will be affected as the line fluxes from transitions of low critical density for collisional de-excitation, c, will be preferentially suppressed at dense environments. We observe no trend of with c (Figure 6), suggesting that the typical NLR gas densities are below c for the MIR transitions that we examined. The lack of dependence of the average on c demonstrates the power of MIR lines in probing the NLR kinematics. One counter example to this statistical finding could be MCG-03-34-064. Because all of its neon lines have higher velocity dispersions than [O IV] and [S IV], its NLR density could be of order 104 hydrogen atoms per cubic centimeter.
Dust either mixed or outside the NLR gas clouds can lead to different extinction of lines at different (Groves et al. 2004; Winter et al. 2010). Because MIR lines are less affected by obscuration than optical lines, they could be probing clouds that are nearer to the BH, where obscuration is often higher. In this case, their widths could be broader than those of optical lines, in particular in type 2 AGN. Mrk273, NGC2623, and IRAS15001+1433 do have larger [O IV] than [O III] widths and low [O III]/ [O IV] flux ratios (see Figure 3), but their [O III] and [S IV] or [Ne III] widths are in good agreement with each other. The comparable ionization potentials of O III, S IV, and Ne III, i.e., 35.12, 34.79, and 40.96 eV respectively, ascribe again any profile differences to ionization effects. We conclude that obscuration is not a common driver of differences in the profiles of optical and IR lines. The nuclear obscuration could be high enough to hide blue wings, associated with outflows moving away from the observer, even in IR wavelengths.
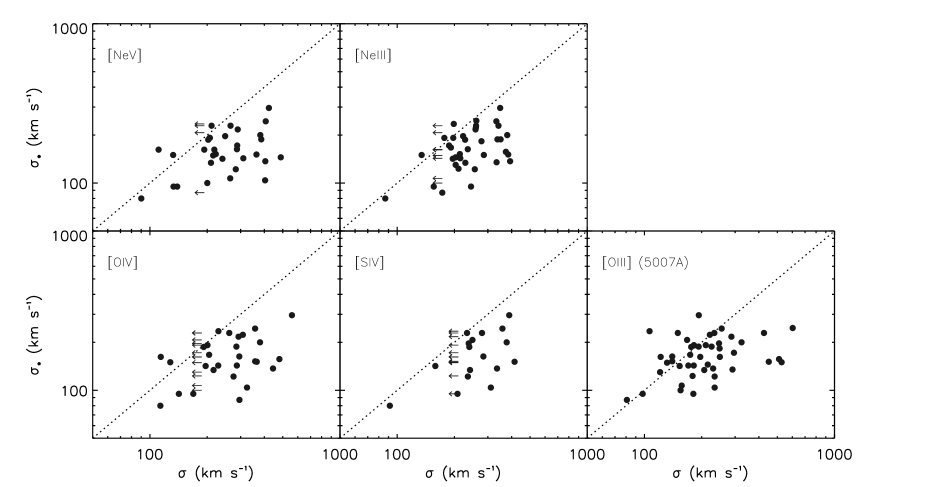
A simple comparison of the NLR gas velocity dispersion to that of the stars in the host galaxy shows that is not identical to (Figure 8). The gas velocity dispersion systematically exceeds that of the stars, with a large scatter between the two quantities. The average velocity dispersion excess is in the range 50-100 km s-1 for all lines. The excess could be intrinsically higher, given that the optical observations had a slit width that was often an order of magnitude narrower than the IRS slit width. The origin of this excess could be related to either gas clouds that are accelerated by AGN-feedback mechanisms (Ho 2009), or to virialized gas clouds with a more compact spatial distribution than that of the stars, when probed by emission lines from ions of ionization potential eV. High spatial resolution MIR spectroscopy of 8 local AGN indicated that the [S IV] emission is unresolved at a scale of 100 pc (Hönig et al. 2008), while NIR integral-field-unit data of Circinus showed that most of the [Si VI] and [Ca VIII] emission is unresolved at 4 pc (Müller Sánchez et al. 2006). This velocity dispersion excess is seen even for the [O III] 5007 Å line, which is resolved for all systems in our sample. Greene & Ho (2005) had also reported such an excess in a large flux-limited sample of AGN observed with SDSS.
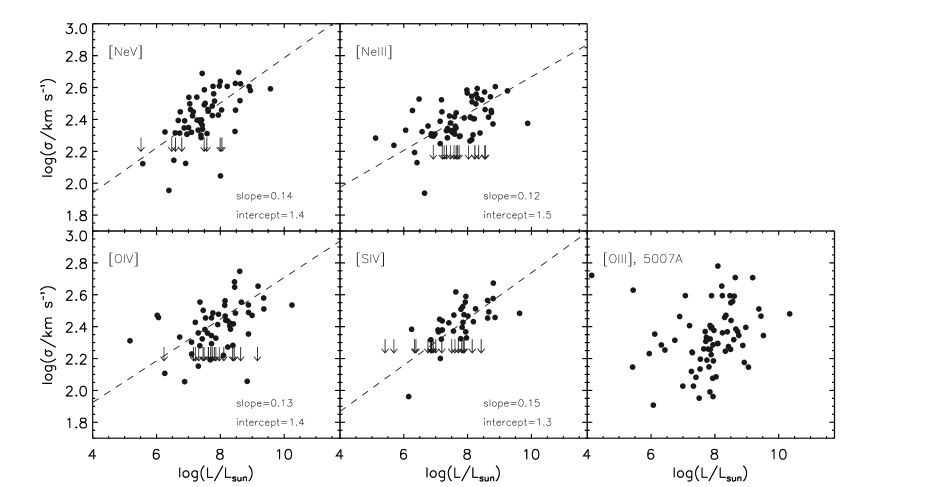
Another trend known from optical NLR studies is that the widths of the lines increase with their own luminosities (Phillips et al., 1983; Whittle, 1985, 1992b) We reproduce this result for the MIR fine-structure lines that we examined in Figure 9. The velocity dispersion correlates roughly as 0.15 based on, e.g., the [Ne V] measurements. A higher dependence of on is plausible when taking into account the upper limits of . An exact determination of this slope will require the use of a flux-limited sample of AGN in the local universe.
4.3 Line Profiles: Shifts and Asymmetries
Changes in the profile moments of different lines can also be seen when the emission originates from gas out of dynamical equilibrium. Several of the 81 sources in our sample show signatures of outflowing (or inflowing) gas motions, such as an offset from systemic velocity. This offset often depends on the ionization potential of each ionic species. With increasing ionization potential, the lines trace clouds that are nearer to the BH, and therefore more susceptible to outflows. We identified 6 sources in which the offset between the peak of the lowest ionization line available and the highest ionization line available exceeds Nyquist sampling of the resolution element, 250 km s-1. Namely, these are the type 1 AGN 3C273, IRAS13342+3932, and the type 2 AGN IRAS05189-2524, IRAS15001+1433, IRAS23060+0505, and Mrk609 (see also Spoon et al. 2009; Spoon & Holt 2009). Line shifts below Nyquist sampling of the instrumental resolution, yet above the wavelength calibration uncertainty (50 km s-1), could also be theoretically observed. They could be considered real if they systematically increased as a function of the ionization potential of the ionic species. Only one source333Other sources, such as NGC2623, NGC7469, Arp148, and PG1211+143, could also have outflows of ionized gas, which need to be proven with spectroscopy of higher resolution than that of IRS. The blue wings of [Ne V] and [O IV] in NGC6240 are also redshifted with respect to [Ne II] and [Ne III], but their overall line shifts are hard to determine as these lines are blended with [Cl II] and [Fe II] (see also Armus et al. 2006). satisfies this criterion, Mrk1457. Its [Ne V] and [Ne II] lines are offset by 100 km s-1.
Asymmetric wings are found in 1/5th of the sources with resolved profiles. We consider such wings to be reliable only when they are detected in two or more lines. Similar [O III] 5007 Å and [Ne III] or [Ne V] wings are observed, for example, in PG1351+640, PG1411+442, and PG1440+356. Likewise, an agreement of the [O III] and [O IV] 25.89 m line profiles is found for 3C273, IRAS13451+1232, IRAS15001+1433, Mrk1014, NGC4235, and NGC7674. Specifically, IRAS13451+1232 is a merging system with two nuclei separated by 5 kpc (e.g., Axon et al. 2000; Dasyra et al. 2006a). The velocity of the secondary [O IV] peak , at -1000 km s-1, is comparable to the velocities of the outflowing [O I] and [O III] gas components that are seen in optical spectroscopy and that are associated with the nucleus responsible for the radio-jet emission (Holt et al. 2003).
5 Discussion
5.1 A Three Dimensional Plane connecting , and the and of the NLR?
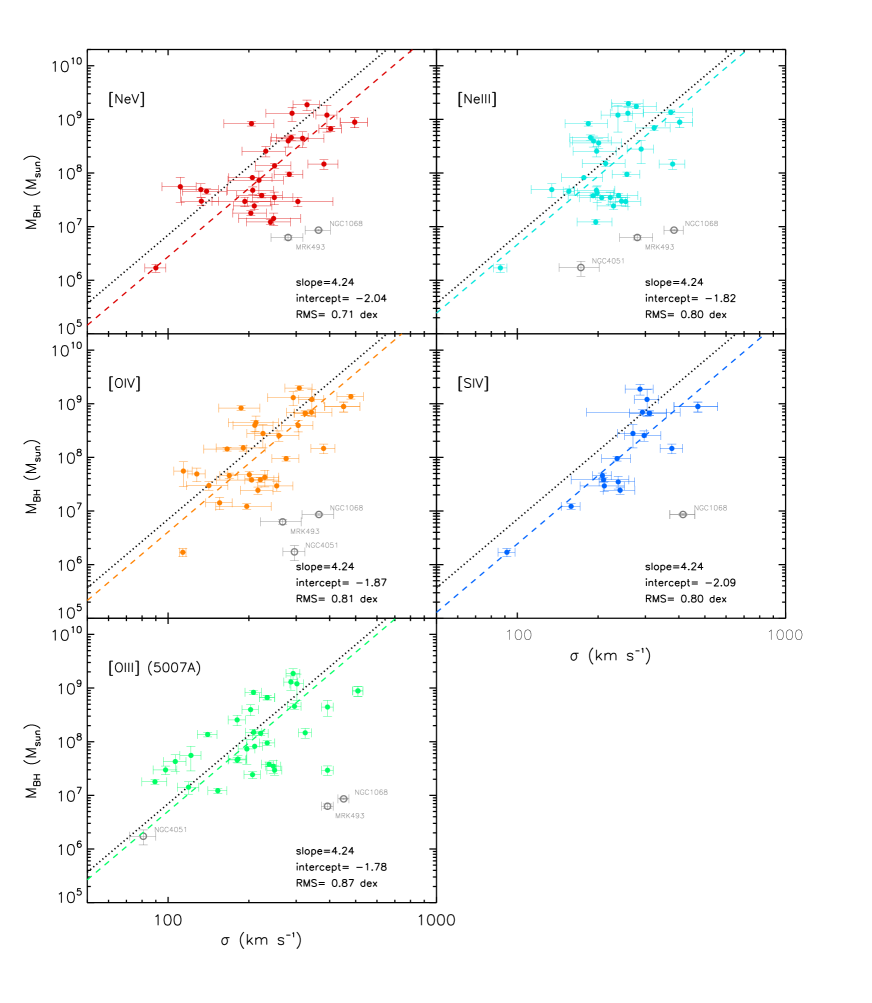
By performing a similar profile analysis of the [Ne V] and [O IV] lines, restricted only to AGN with direct measurements from reverberation experiments (Peterson et al. 2004), we previously demonstrated that the NLR velocity dispersion correlates with the mass of its central BH (Dasyra et al. 2008). We now further populate this relation using data from the full Spitzer archive, complementing them with ISO SWS data to cover the parameter space 200 km s-1. The values for this expanded sample include single-epoch optical spectroscopic estimates for type 1 AGN, as well as direct measurements for a few type 2 AGN (see Section 2; Tables 3 and 4).
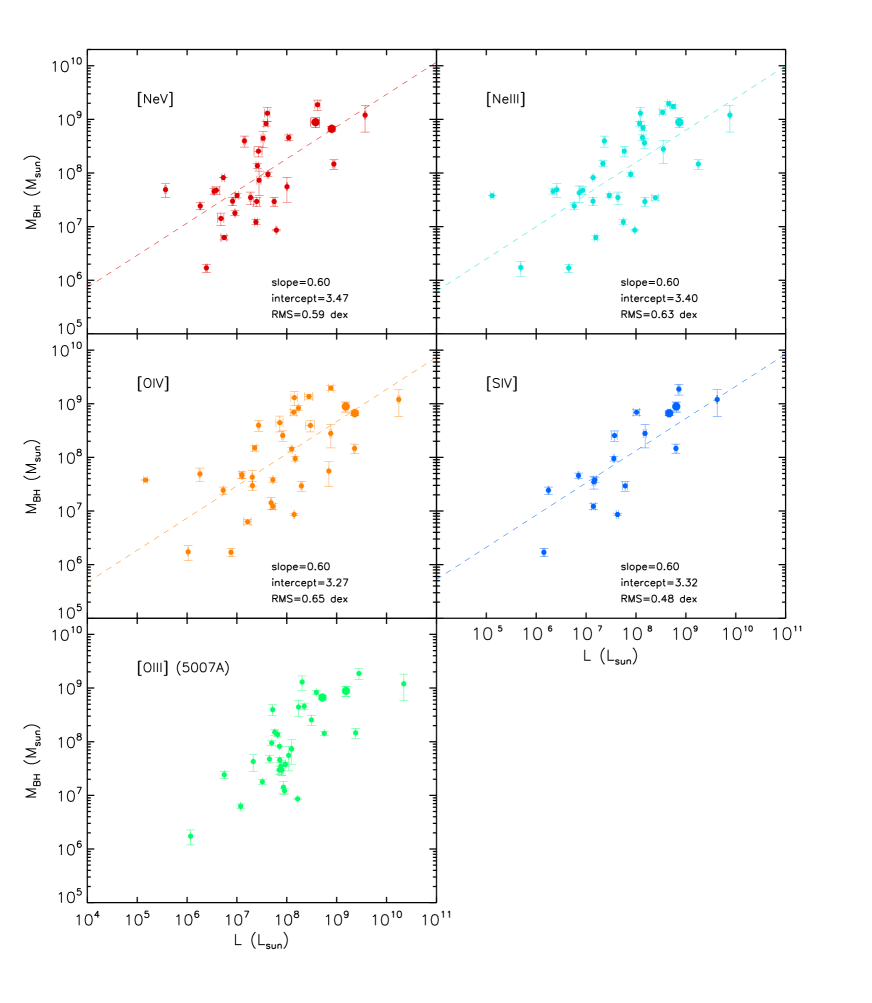
The fit to these data (Figure 10) was performed with the IDL routine MPFITFUN. Given the sparsity of data at the low end, we opted for a linear fit of fixed slope in logarithic space. The slope was set to 4.24, which is identical to that of the stellar relation (Ferrarese & Merritt 2000; Gebhardt et al. 2000) as recently revisited by Gültekin et al. (2009). While the rms scatter was computed using all available datapoints, the best-fit solution was computed using only Spitzer observations of sources with 107 or ISO observations, as in Dasyra et al. (2008). The reason why we excluded Spitzer datasets for 107 is that they would introduce a bias toward high intercept values: the resolution of IRS is insufficient to resolve lines on the left-hand side of the relation below this threshold. This excludes the type 2 AGN NGC1068, and the narrow-line Seyfert 1s (NLS1s) Mrk493, and NGC4051 that have high values for their BH masses. The existence of such outliers nonetheless suggests that could fail as a proxy of , as it is also known for the BLR gas (e.g., Vestergaard & Peterson 2006). On the other hand, such sources are not outliers in the relation connecting to the luminosity of the NLR lines (Figure 11).
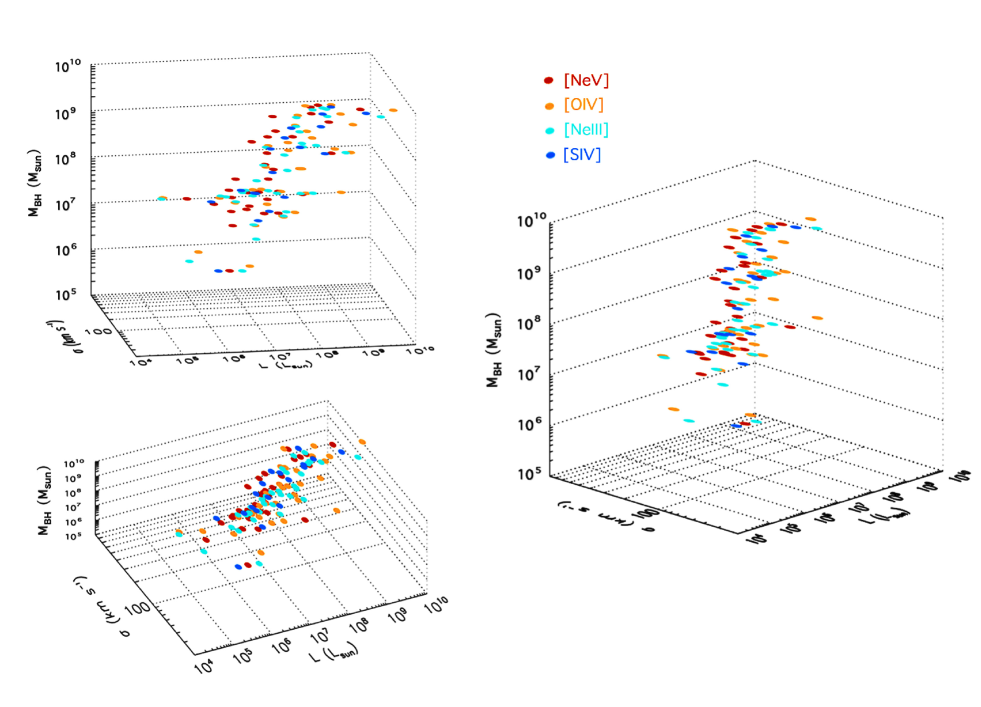
The multiple relations between and , and , and and could be suggestive of a plane connecting these three parameters (Figure 12), which we fit using the equation
| (1) |
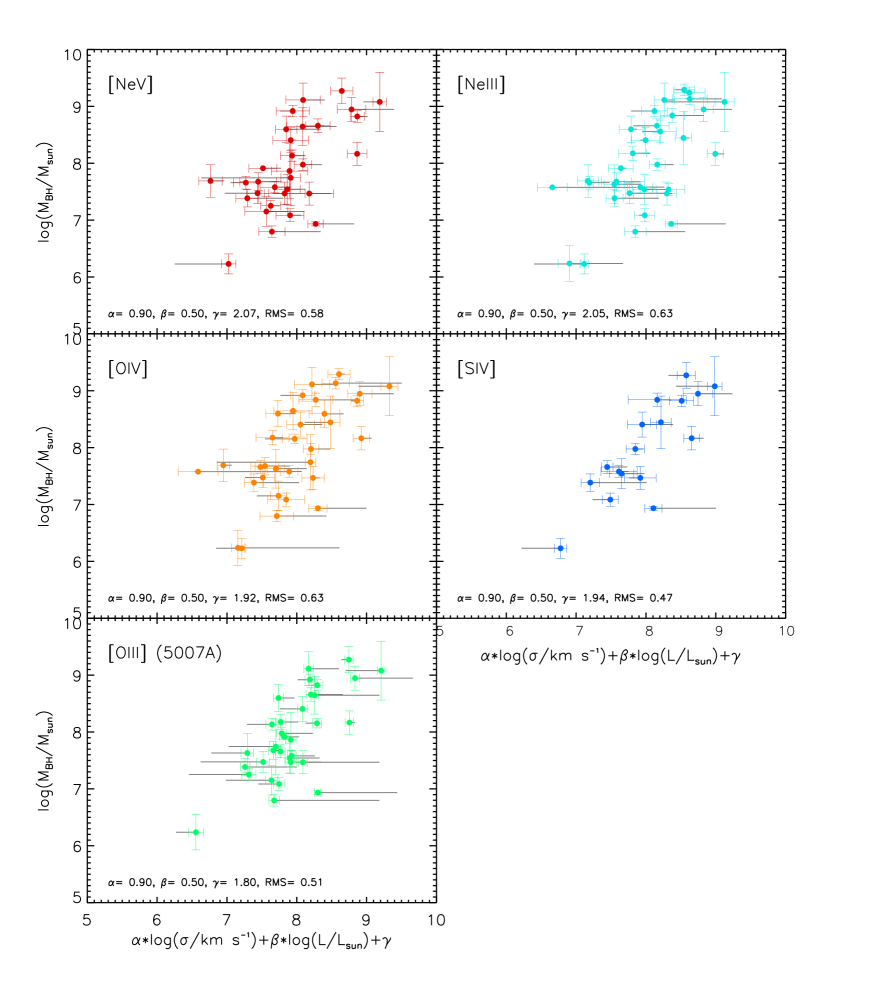
where ,, and are constants. We find that the best-fit-solution coefficients correspond to =0.9 and =0.5, when averaged over all MIR lines. Given the and ∼7 proportionality shown in Figure 9, this result roughly reproduces the relation. In Figure 13, we present the plane equation for each line, when fixing the log() and log() slopes to their average values for simplicity444 We have adapted this approach throughout all fitting procedures in this work (see also Figures 10 and 11) to facilitate comparisons of the rms scatter among the various relations, and to avoid biases related to the small galaxy sample that is used for their creation and that varies from line to line.. We find that the use of a plane equation minimizes the scatter of the NLR-based estimates from their actual values. The improvement primarily originates from the correction of the relation outliers at its low- and high- end.
5.2 The Origin of the Scaling Relations between the NLR Gas Properties and
The physical interpretation of the suggested plane linking the NLR line luminosity, velocity dispersion and the BH mass, varies depending upon the assumed kinematics and distribution of the gas clouds. A plane equation can be meaningful for clouds on accelerated motions powered directly by the AGN, via radiation pressure (Murayama & Taniguchi 1998) acting mostly upon dust particles due to their high opacity (Dopita et al. 2002), magnetic fields related to jets (Whittle 1992c), and AGN-related winds. The winds can lead to either asymmetric outflows, identified in 7% of the systems in this sample, or to symmetric outflows that can be related to the AGN accretion disk (Crenshaw et al. 2003; Ho 2009). In this scenario, the measured gas velocity would be related to the fraction of the energy generated by the AGN that is deposited into the NLR gas. The luminosity would be a probe of the AGN accretion rate, since the luminosities of MIR NLR lines are known to be correlated with the optical, X-ray, and bolometric AGN luminosities (Schweitzer et al. 2006; Dasyra et al. 2008; Meléndez et al. 2008; Rigby et al. 2009; R. Mor et al. in preparation). A plane connecting , , and would then suggest that the kinetic energy of the interstellar medium (ISM), as measured from the MIR lines, is directly related to the amount of material that is accreted onto the BH for a given value. An analogous idea was introduced by Merloni et al. (2003), who found a correlation between the mass of an accreting BH with its X-ray and radio luminosities.
Instead of responding to AGN feedback mechanisms, the gas clouds could be in virial motions that are dictated by the enclosed mass at the NLR radius . For a geometric factor converting this total mass to the BH mass, the virial equation can be written as
| (2) |
where is the gravitational constant. In this model, the NLR radius depends on the AGN luminosity alongside with the stellar mass and distribution in the AGN host galaxy. Equation (2) will take the form of Equation (1) if scales with the AGN luminosity as a power law of , as found for the [O III] 5007 Å line (Bennert et al. 2002; Schmitt et al. 2003). The hardness of the ionizing radiation together with the ionization fraction, the covering factor, and the density distribution of the clouds can also determine how far the AGN radiation reaches, illuminates, and photoionizes gas clouds. For example, the observed increase of with can be driven either by a tendency for more massive BHs to reside in larger galaxies (Ho 2009), or by the ionization state of the NLR. Lines from ions of high ionization potential are thought to be tracing matter-bound clouds that are partially ionized (Murayama & Taniguchi 1998; Wilson et al. 1997). In the case of partially ionized clouds, an increase of the AGN luminosity can lead to an overall expansion of the NLR, while most of the ionization can still occur for clouds at small radii. The exact relation between , , and will depend on the gas density distribution, which is encapsulated in the scaling factor . The coefficients of the best-fit plane solution, =0.9 and =0.5, suggest that is dropping with , corresponding to a lower scaling factor for denser gas within a fixed radius. If however, the scaling factor was constant, would be equal to 2, and the best-fit plane solution would correspond to =0.4. Such a solution could also be plausible. It would increase the rms scatter by a small amount, i.e., by only 0.010.02 dex for the MIR lines and by 0.07 dex for [O III].
If the cloud kinematics cannot be approximated by either feedback-driven motions or by virial motions, Equation 1 might not provide a good means of estimating . For cloud kinematics that are described by a combination of virial and accelerated motions, e.g., in a virialized NLR where radiation pressure is significant, is proportional to , where is a constant that depends on the column density and level of ionization of the clouds (Marconi et al. 2008; but see also Netzer & Marziani 2010). Further investigation of the optimal description of from narrow line properties will be tested on large, flux-limited samples of AGN with multiwavelength datasets. This will be the focus of a forthcoming paper using SDSS data.
5.3 Black Hole Mass Estimates in Obscured AGN
Given that we see no significant difference in the NLR properties of type 1 and type 2 AGN at a given or (see also Pereira-Santaella et al. 2010), we applied the relations presented earlier in this work to type 2 AGN for which such an analysis is presently possible from Spitzer data. Only four of these sources have other, direct measurements (Table 2). The comparison between the estimates from the stellar ∗ relation, the relation for the NLR gas, and the best-fit linear combination of log() and log() are presented in Table 5. For either computation based on the NLR gas, the result is averaged over all available MIR lines. We find that the median ratio of as estimated from the plane equation over as estimated from the stellar velocity dispersion is 1.8. On the other hand, the median ratio of as estimated from the NLR gas velocity dispersion over as estimated from the stellar velocity dispersion is much higher, 6.5. The difference seen when folding a luminosity dependence on the computation of is largest for the IR-bright galaxies IRAS05189-2524, IRAS15001+1433, and Mrk609, which have gas motions that are predominantly out of dynamical equilibrium.
6 Conclusions
We queried the full Spitzer archive for high-resolution IRS spectra of type 1 AGN with BLR-based estimates from optical spectroscopy, and type 2 AGN. We analyzed the spectra of 298 objects, which we combined with ISO spectra of 6 more AGN, aiming to study the fundamental properties of the NLR in the IR, and to calibrate its fine-structure-line widths and luminosities to the mass of the central black hole. We found the following.
-
•
All of the [Ne V], [O IV], [Ne III], and [S IV] line luminosities are well correlated with each other (with an rms scatter of 0.2 dex). Given the high ionization potential of Ne IV to Ne V, their emission is attributed to (further) photoionization of ions by the AGN. Thus, all of these lines can be used to study the NLR kinematics.
-
•
The bulk of the silicates responsible for the 9.7 m absorption feature is likely to be located in a region smaller than the NLR. Otherwise, the luminosity of [S IV] at 10.51 m would not correlate equally well with that of all other IR narrow lines without an extinction correction in obscured AGN.
-
•
Of the 304 sources in our sample, 81 had at least one [Ne V], [O IV], [Ne III], or [S IV] narrow line that was resolved. We find that, on average, the line widths increase with increasing ionization potential of the species that emit them in the range 2297eV. Different fine-structure lines probe different (locations within the) clouds, with high-ionization-potential ions being preferentially found nearer to the BH.
-
•
No trend was observed between the line width and critical density for these transitions, indicating that the average density of the NLR gas is typically below 104 hydrogen atoms per cubic centimeter.
-
•
The velocity dispersions of all MIR lines that we examined, as well as that of the [O III] 5007 Å line, are systematically above the velocity dispersion of the stars in the AGN host galaxies. Moreover, the line widths increase with their own luminosities, as known from optical wavelengths.
-
•
The mass of the central BH correlates with the velocity dispersion and with the luminosity of the NLR lines. We speculate that these results could be suggestive of a three-dimensional plane, connecting log( ) to a linear combination of log() and log(). Such a plane equation could be meaningful for a virial distribution in which the NLR radius has a power-law dependence on the AGN luminosity, or for AGN-feedback driven motions.
-
•
Given that we find no significant differences in the NLR kinematic properties of type 1 and type 2 AGN, we used the NLR gas properties as seen in the MIR to estimate the BH masses residing in 35 local obscured AGN.
References
- Armus et al. (2006) Armus, L., et al. 2006, ApJ, 640, 204
- Axon et al. (2000) Axon, D. J., Capetti, A., Fanti, R., Morganti, R., Robinson, A., & Spencer, R. 2000, AJ, 120, 2284
- Baldwin et al. (1981) Baldwin, J., Philips, M., & Terlevich, R., 1981, PASP, 93, 5
- Bassani et al. (1999) Bassani, L., Dadina, M., Maiolino, R., Salvati, M., Risaliti, G., della Ceca, R., Matt, G., & Zamorani, G. 1999, ApJS, 121, 473
- Bennert et al. (2002) Bennert, N., Falcke, H., Schulz, H., Wilson, A. S., & Wills, B. J. 2002, ApJ, 574, L105
- Bennert et al. (2009) Bennert, N., Barvainis, R., Henkel, C., & Antonucci, R. 2009, ApJ, 695, 276
- Bentz et al. (2006) Bentz, M. C., et al. 2006, ApJ, 651, 775
- Bentz et al. (2009) Bentz, M. C., et al 2009, ApJ, 705, 199
- Blandford & McKee (1982) Blandford, R. D. & McKee, C. F. 1982, ApJ, 255, 419
- Boroson & Green (1992) Boroson, T. A., & Green, R. F. 1992, ApJS, 80, 109
- Cappellari et al. (2009) Cappellari, M., Neumayer, N., Reunanen, J., van der Werf, P. P., de Zeeuw, P. T., & Rix, H.-W. 2009, MNRAS, 394, 660
- Crenshaw et al. (2003) Crenshaw, D. M., Kraemer, S. B., & George, I. M. 2003, ARA&A, 41, 117
- Dasyra et al. (2006a) Dasyra, K. M., Tacconi, L. J., Davies, R.I., Lutz, D., Genzel, R., Burkert, A., Veilleux, S. & Sanders, D. 2006, ApJ 638, 745
- Dasyra et al. (2006b) Dasyra, K. M., et al. 2006, ApJ, 651, 835
- Dasyra et al. (2007) Dasyra, K. M., et al. 2007, ApJ, 657, 102
- Dasyra et al. (2008) Dasyra, K. M., et al. 2008, 674, L9
- Denney et al. (2010) Denney, K. D., et al. 2010 ApJ, 721, 715
- Dopita et al. (2002) Dopita, M. A., Groves, B. A., Sutherland, R. S., Binette, L., Cecil, G. 2002, ApJ, 572, 753
- Falcon-Barroso et al. (2006) Falcon-Barroso, J., et al., 2006, MNRAS, 369, 529
- Ferguson et al. (1997) Ferguson J. W., Korista, K. T., Baldwin, J. A., & Ferland, G. J. 1997, ApJ 487, 122
- Ferrarese & Merritt (2000) Ferrarese, L., & Merritt, D. 2000, ApJ, 539, L9
- Filippenko & Halpern (1984) Filippenko A. V., & Halpern, J. P. 1984, ApJ, 285, 458
- Gebhardt et al. (2000) Gebhardt, K. et al. 2000, ApJ, 539, L13
- Genzel et al. (1997) Genzel, R., Eckart, A., Ott, T., & Eisenhauer, F. 1997, MNRAS, 291, 219
- Gilli et al. (2007) Gilli, R., Comastri, A., & Hasinger, G. 2007, A&A, 463, 79
- Greene & Ho (2005) Greene, J. E., & Ho L. C. 2005, ApJ, 627, 721
- Greenhill et al. (2003) Greenhill, L. J., et al. 2003, ApJ, 590, 162
- Groves et al. (2004) Groves B. A., Dopita, M. A., & Sutherland, R. S. 2004, ApJS, 153, 9
- Gorjian et al. (2007) Gorjian, V., Cleary, K., Werner, M. W., & Lawrence, C. R. , 2007, ApJ, 655, L73
- Gültekin et al. (2009) Gültekin, K., et al. 2009, ApJ, 698, 198
- Hao et al. (2005) Hao, L., et al. 2005, AJ, 129, 1795
- Harms et al. (1994) Harms, R. J., et al. 1994, ApJ, 435, L35
- Heckman et al. (1983) Heckman, T. M., van Breugel, W. J. M., Miley, G. K., & Butcher, H. R. 1983, AJ, 88, 1077
- Herrnstein et al. (2005) Herrnstein, J. R., Moran, J. M., Greenhill, L. J., & Trotter, A. S. 2005, ApJ, 629, 719
- Hinz & Rieke (2006) Hinz, J. L., & Rieke, G. H., 2006, ApJ, 646, 872
- Ho et al. (1997a) Ho, L. C., Filippenko, A. V., & Sargent, W. L. W. 1997, ApJS, 112, 315
- Ho et al. (1997b) Ho, L. C., Filippenko, A. V., & Sargent, W. L. W. 1997, ApJ, 487, 568
- Ho (2007) Ho, L. C. 2007, ApJ, 668, 94
- Ho (2009) Ho, L. C. 2009, ApJ, 699, 638
- Ho & Kim (2009) Ho, L. C. & Kim, M. 2009, ApJS, 184, 398
- Holt et al. (2003) Holt, J., Tadhunter, C. N., & Morganti, R. 2003, MNRAS, 342, 227
- Hönig et al. (2008) Hönig, S. F., Smette, A., Beckert, T., Horst, H., Duschl, W., Gandhi, P., Kishimoto, M., & Weigelt, G. 2008, A&A, 485, L21
- Houck et al. (2004) Houck, J., et al. 2004, ApJS, 154, 18
- Kauffmann et al. (2003) Kauffmann, G., et al. 2003, MNRAS, 346, 1055
- Kaspi et al. (2000) Kaspi, S., Smith, P. S., Netzer, H., Maoz, D., Jannuzi, B. T., Giveon, U. 2000, ApJ, 533, 631
- Kaspi et al. (2007) Kaspi, S., Brandt, W. N., Maoz, D., Netzer, H., Schneider, D. P., & Shemmer, O. 2007, ApJ, 659, 997
- Kewley et al. (2006) Kewley, L. J., Groves, B., Kauffmann, G., & Heckman, T. 2006, MNRAS1 372, 961
- Kim et al. (2008) Kim, M., Ho, L. C., Peng, C. Y., Barth, A. J., Im, M., Martini, P., & Nelson, C. H. 2008, ApJ, 687, 767
- Lacy et al. (2007) Lacy, M., et al. 2007, AJ, 133, 186
- Laor (2007) Laor, A. 2007, ASPC, 373, 384
- Liu et al. (2009) Liu, X., Zakamska, N. L., Greene, J. E., Strauss, M. A., Krolik, J. H., & Heckman, T. M. 2009, ApJ, 702, 1098
- Lodato & Bertin (2003) Lodato, G., & Bertin, G. 2003, A&A, 398, 517
- Macchetto et al. (1997) Macchetto, F., Marconi, A., Axon, D. J., Capetti, A., Sparks, W. B., & Crane, P. 1997, ApJ, 489, 579
- Marconi et al. (2004) Marconi, A., Risaliti, G., Gilli, R., Hunt, L. K., Maiolino, R., & Salvati, M. 2004, MNRAS, 351, 169
- Marconi et al. (2008) Marconi, A., Axon, D. J., Maiolino, R., Nagao, T., Pastorini, G., Pietrini, P., Robinson, A., & Torricelli, G. 2008, ApJ, 678, 693
- Marziani et al. (2003) Marziani, P., Sulentic, J. W., Zamanov, R., Calvani, M., Dultzin-Hacyan, D., Bachev, R., & Zwitter, T. 2003, ApJS, 145, 199
- Meléndez et al. (2008) Meléndez, M., et al. 2008, ApJ, 682, 94
- Merloni et al. (2003) Merloni, A., Heinz, S., & di Matteo, T. 2003, MNRAS, 345, 1057
- Merloni et al. (2004) Merloni, A., Rudnick, G., & di Matteo, T. 2004, MNRAS, 354, L37
- Miyoshi et al. (1995) Miyoshi, M., Moran, J., Herrnstein, J., Greenhill, L., Nakai, N., Diamond, P., & Inoue, M. 1995, Nature, 373, 127
- Mulchaey et al. (1994) Mulchaey, J. S., Koratkar, A., Ward, M. J., Wilson, A. S., Whittle, M., Antonucci, R. R. J., Kinney, A. L., & Hurt, T. 1994, ApJ, 436, 586
- Müller Sánchez et al. (2006) Müller Sánchez, F., Davies, R. I., Eisenhauer, F., Tacconi, L. J., Genzel, R., & Sternberg, A. 2006, A&A, 454, 481
- Murayama & Taniguchi (1998) Murayama, T., Taniguchi, Y., & Iwasawa, K. 1998, AJ, 115, 460
- Murayama & Taniguchi (1998) Murayama, T. & Taniguchi, Y. 1998, ApJ, 497, L9
- Nelson & Whittle (1996) Nelson, C. H., & Whittle, M. 1996, ApJ, 465, 96
- Nelson (2000) Nelson, C. H. 2000, ApJ, 554, L91
- Nelson et al. (2004) Nelson, C., Green, R. F., Bower, G., Gebhardt, K., & Weistrop, D. 2004, ApJ, 615, 652
- Netzer (2004) Netzer, H. 2004, IAUS, 222, 389
- Netzer & Traktenbrot (2007) Netzer, H., & Trakhtenbrot, B. 2007, ApJ, 654, 754
- Netzer & Marziani (2010) Netzer, H., & Marziani, P. 2010, ApJ, 724, 318
- Neumayer et al. (2007) Neumayer, N., Cappellari, M., Reunanen, J., Rix, H.-W., van der Werf, P. P., de Zeeuw, P. T., & Davies, R. I. 2007, ApJ, 671, 1329
- Oliva et al. (1994) Oliva, E., Salvati, M., Moorwood, A. F. M., & Marconi, A. 1994, A&A, 288, 457
- Onken et al. (2004) Onken, C. A., Ferrarese, L., Merritt, D., Peterson, B. M., Pogge, R. W, Vestergaard, M., & Wandel, A. 2004, ApJ 615, 645
- Pahre (1999) Pahre, M. A. 1999, ApJS, 124, 127
- Pereira-Santaella et al. (2010) Pereira-Santaella, M., Diamond-Stanic, A. M., Alonso-Herrero, A., & Rieke, G. H. 2010, ApJ, 725, 2270
- Peterson (1993) Peterson, B. M. 1993, PASP, 105, 247
- Peterson et al. (2004) Peterson, B. M., et al. 2004, ApJ, 613, 682
- Phillips et al. (1983) Phillips, M. M., Charles, P. A., & Baldwin, J. A. 1983, ApJ, 266, 485
- Reyes et al. (2008) Reyes, R., et al. 2008, AJ, 136, 2373
- Rigby et al. (2009) Rigby, J. R., Diamond-Stanic, A. M., & Aniano, G. 2009, ApJ, 700, 1878
- Shields et al. (2003) Shields, G. A., Gebhardt, K., Salviander, S., Wills, B. J., Xie, B., Brotherton, M. S., Yuan, J., & Dietrich, M. 2003, ApJ, 583, 124
- Schmitt et al. (2001) Schmitt, H. R., Antonucci, R. R. J., Ulvestad, J. S., Kinney, A. L., Clarke, C. J., & Pringle, J. E. 2001, ApJ, 555, 663
- Schmitt et al. (2003) Schmitt, H. R., Donley, J. L., Antonucci, R. R. J., Hutchings, J. B., & Kinney, A. L. 2003, ApJS, 148, 32
- Schweitzer et al. (2006) Schweitzer, M., et al. 2006, ApJ, 649, 79
- Schweitzer et al. (2008) Schweitzer, M., et al. 2008, ApJ, 679, 101
- Soifer et al. (2002) Soifer, B. T., Neugebauer, G., Matthews, K., Egami, E., & Weinberger, A. J. 2002, AJ,124, 2980
- Spinelli et al. (2006) Spinelli, P. F., Storchi-Bergmann, T., Brandt, C. H., & Calzetti, D. 2006, ApJS, 166, 498
- Spoon et al. (2009) Spoon, H. W. W., Armus, L., Marshall, J. A., Bernard-Salas, J., Farrah, D., Charmandaris, V., & Kent, B. R. 2009, ApJ, 693, 1223
- Spoon & Holt (2009) Spoon, H. W. W., & Holt, J. 2009, ApJ, 702, L42
- Sturm et al. (2002) Sturm, E., Lutz, D., Verma, A., Netzer, H., Sternberg, A., Moorwood, A., Oliva, E., & Genzel, R. 2002, A&A, 393, 821
- Tacconi et al. (2002) Tacconi, L. J., Genzel, R., Lutz, D., Rigopoulou, D., Baker, A. J., Iserlohe, C., & Tecza, M. 2002, ApJ, 580, 73
- Tecza et al. (2000) Tecza, M., Genzel, R., Tacconi, L. J., Anders, S., Tacconi-Garman, L. E., & Thatte, N. 2000, ApJ, 537, 178
- Tristram et al. (2007) Tristram, K. R. W., et al. 2007, A&A, 474, 837
- Turner et al. (1997) Turner, T. J., George, I. M., Nandra, K., & Mushotzky, R. F. 1997, ApJS, 113, 23
- Veilleux et al. (1995) Veilleux, S., Kim, D.-C., Sanders, D. B., Mazzarella, J. M.;, &Soifer, B. T. 1995, ApJS, 98, 171
- Veilleux et al. (1999) Veilleux, S., Kim, D.-C., & Sanders, D. B. 1999, ApJ, 522, 113
- Vestergaard & Peterson (2006) Vestergaard, M., & Peterson, B. M. 2006, ApJ, 641, 689
- Whittle (1985) Whittle, M. 1985, MNRAS, 213, 1
- Whittle (1992a) Whittle, M. 1992(a), ApJ, 79, 49
- Whittle (1992b) Whittle, M. 1992(b), ApJ, 387, 109
- Whittle (1992c) Whittle, M. 1992(c), ApJ, 387, 121
- Wilson et al. (1997) Wilson, A. S., Binette, L., & Storchi-Bergmann, T. 1997, ApJ, 482, L131
- Winter et al. (2010) Winter, L. M., Lewis, K. T., Koss, M. Veilleux, S., Keeney, B., & Mushotzky, R. F.. 2010, ApJ, 710, 503
- Zakamska et al. (2003) Zakamska, N., et al. 2003, AJ, 126, 2125
| Galaxy | log(L[OIII]/(ergs s-1)) | (5007 Å) | |||
|---|---|---|---|---|---|
| (-) | (-) | ( ) | (-) | (km s-1) | (km s-1) |
| (1) | (2) | (3) | (4) | (5) | (6) |
| 2MASSJ09184900+2117170 | 0.1490 | 3.45 0.35 | 42.09 | 274 | |
| 2MASSiJ1659397+183436 | 0.1709 | 174.28 17.43 | 42.55 | 249 | 183 10 |
| 2MASXJ10514428+3539304 | 0.1588 | 41.67 | 197 | ||
| 3C249.1 | 0.3110 | 187.10 42.20 | 43.03 | 292 | |
| 3C273 | 0.1583 | 88.60 18.70 | 42.77 | 510 | |
| Ark120 | 0.0328 | 15.00 1.90 | 41.34 | 209 | |
| CGCG121-075 | 0.0323 | 3.81 0.38 | 41.56 | 238 | |
| ESO140-G043 | 0.0142 | 1.79 0.18 | 41.09 | 89 | |
| FAIRALL9 | 0.0465 | 25.50 5.60 | 42.08 | 181 | |
| IC4329A | 0.0160 | 9.47 0.95 | 41.28 | 234 | 122 13 |
| IRAS13342+3932 | 0.1793 | 66.61 6.66 | 42.30 | 234 | 104 14 |
| IRAS13451+1232 | 0.1217 | 135.96 13.60 | 42.22 | 511 | 157 39 |
| IRAS18216+6418 | 0.2970 | 120.00 62.20 | 43.93 | 302 | |
| MCG-2-58-22 | 0.0469 | 83.13 8.31 | 42.18 | 208 | |
| Mrk1014 | 0.1631 | 14.66 3.01 | 42.96 | 324 | 200 60 |
| Mrk279 | 0.0305 | 3.49 0.92 | 41.47 | 247 | 197 12 |
| Mrk335 | 0.0258 | 1.42 0.37 | 41.52 | 119 | |
| Mrk493 | 0.0313 | 0.63 0.06 | 40.66 | 393 | |
| Mrk590 | 0.0264 | 4.75 0.74 | 41.24 | 182 | 192 10 |
| Mrk704 | 0.0295 | 13.64 1.36 | 41.40 | 140 | |
| Mrk705 | 0.0290 | 39.63 9.18 | 41.30 | 203 | |
| NGC3227 | 0.0039 | 2.43 0.37 | 40.33 | 206 | 134 6 |
| NGC3516 | 0.0088 | 4.27 1.46 | 40.91 | 106 | 235 |
| NGC4051 | 0.0023 | 0.17 0.05 | 39.66 | 81 | 87 5 |
| NGC4235 | 0.0080 | 39.53 | 170 | 143 34 | |
| NGC5548 | 0.0172 | 8.20 0.00 | 41.44 | 210 | 192 15 |
| NGC7469 | 0.0165 | 1.22 0.14 | 41.54 | 153 | 142 3 |
| PG0026+129 | 0.1455 | 39.30 9.60 | 42.46 | 191 | |
| PG0804+761 | 0.1010 | 69.30 8.30 | 42.06 | 393 | |
| PG1119+120 | 0.0502 | 2.95 0.59 | 41.49 | 249 | 162 28 |
| PG1229+204 | 0.0630 | 7.32 3.52 | 41.68 | 197 | 162 32 |
| PG1351+640 | 0.0882 | 36.30 7.26 | 42.19 | 390 | |
| PG1411+442 | 0.0896 | 44.30 14.60 | 41.82 | 393 | |
| PG1426+015 | 0.0866 | 129.80 38.50 | 41.89 | 287 | 217 15 |
| PG1440+356 | 0.0790 | 2.94 0.59 | 41.48 | 393 | |
| PG1613+658 | 0.1295 | 27.90 12.90 | 42.08 | 354 | |
| PG2130+099 | 0.0630 | 45.70 5.50 | 41.93 | 296 | 172 46 |
| PG2349-014 | 0.1742 | 196.00 19.60 | 43.11 | 221 | 223 36 |
| 3C120∗ | 0.0330 | 5.55 2.70 | 41.62 | 122 | 162 24 |
| Mrk509∗ | 0.0344 | 14.30 1.20 | 42.33 | 221 | |
| NGC3783∗ | 0.0097 | 2.98 0.54 | 41.43 | 98 | 95 10 |
| NGC4151∗ | 0.0033 | 4.57 0.52 | 41.44 | 181 | 95 7 |
Note. — (∗) sources with MIR fine-structure lines resolved only by ISO.
Col. (3): When possible, measurements are taken from reverberation mapping experiments (Peterson et al. 2004; Bentz et al. 2006; Bentz et al. 2009; Denney et al. 2010). Otherwise, they are taken from single-epoch spectroscopy (Vestergaard & Peterson 2006; Kim et al. 2008) or computed from single-epoch spectroscopy (Marziani et al. 2003; Netzer & Traktenbrot 2007; Ho & Kim 2009; SDSS archival spectra) as in Vestergaard & Peterson (2006).
2MASXJ10514428+3539304 has weak, broad detection but no detection.
Col. (4): Data from Whittle (1992a), Marziani et al. (2003), Ho & Kim (2009), SDSS DR7, as well as our own measurements from the spectra presented in Boroson & Green (1992), performed as in Netzer & Traktenbrot (2007). The luminosities are not corrected for extinction.
Col.(5): values are taken from Whittle (1992a), Ho & Kim (2009), or measured from SDSS spectra.
Col. (6): Host galaxy velocity dispersion measurements are taken from Nelson et al. (2004), Onken et al. (2004), Dasyra et al. (2006a; 2006b; 2007), Ho (2007), and the 7th data release of SDSS. When more than one measurements were available, their average value was used. IRAS13451+1232 is a merger (Dasyra et al. 2006a). The velocity dispersion presented here corresponds to the combined value for both nuclei.
| Galaxy | log(L[OIII]/(ergs s-1)) | (5007 Å) | |||
|---|---|---|---|---|---|
| (-) | (-) | ( ) | (-) | (km s-1) | (km s-1) |
| (1) | (2) | (3) | (4) | (5) | (6) |
| 2MASXJ08035923+2345201 | 0.0297 | 40.99 | 121 | 130 5 | |
| 2MASXJ08244333+2959238 | 0.0254 | 41.13 | 157 | 107 5 | |
| 2MASXJ10181928+3722419 | 0.0497 | 41.33 | 155 | 100 6 | |
| 2MASXJ12384342+0927362 | 0.0829 | 41.97 | 233 | 229 10 | |
| 2MASXJ16164729+3716209 | 0.1518 | 42.51 | 150 | 229 9 | |
| CGCG218-007 | 0.0273 | 40.85 | 131 | 149 5 | |
| ESO103-G035 | 0.0133 | ||||
| IRAS05189-2524 | 0.0430 | 41.82 | 230 | 137 16 | |
| IRAS15001+1433 | 0.1623 | 41.52 | 193 | 296 19 | |
| IRAS18325-5926 | 0.0202 | ||||
| IRAS23060+0505 | 0.1730 | 42.24 | 243 | ||
| MCG-03-34-064 | 0.0165 | ||||
| Mrk1066 | 0.0120 | 40.88 | 172 | ||
| Mrk1457 | 0.0486 | 41.38 | 182 | 143 6 | |
| Mrk273 | 0.0378 | 40.79 | 255 | 244 18 | |
| Mrk3 | 0.0135 | 42.14 | 362 | ||
| Mrk463E | 0.0510 | 42.64 | 140 | 163 8 | |
| Mrk609 | 0.0345 | 41.32 | 215 | 145 4 | |
| Mrk622 | 0.0232 | 40.48 | 291 | 135 5 | |
| NGC1068 | 0.0038 | 0.86 0.03 | 41.80 | 451 | 151 7 |
| NGC1275 | 0.0174 | 41.68 | 601 | 246 | |
| NGC2622 | 0.0286 | 41.43 | 255 | ||
| NGC2623 | 0.0185 | 39.01 | 140 | 152 9 | |
| NGC2639∗ | 0.0111 | 39.70 | 226 | 188 | |
| NGC3079∗ | 0.0037 | 37.72 | 527 | 150 | |
| NGC4258 | 0.0018 | 3.78 0.01 | 40.87 | 174 | 167 |
| NGC4507 | 0.0118 | 41.53 | 91 | ||
| NGC5256 | 0.0279 | 41.91 | 176 | 187 8 | |
| NGC5506 | 0.0062 | 40.58 | 106 | ||
| NGC5728 | 0.0094 | 41.12 | 136 | ||
| NGC5929 | 0.0083 | 40.02 | 179 | 123 3 | |
| NGC6240 | 0.0245 | 39.02 | 426 | 229 43 | |
| NGC7172 | 0.0087 | ||||
| NGC7674 | 0.0290 | 42.01 | 189 | ||
| SBS1133+572 | 0.0516 | 41.47 | 168 | 207 7 | |
| UGC02608 | 0.0233 | ||||
| UGC5101 | 0.0394 | 39.91 | 193 | 188 6 | |
| Centaurus A∗∗ | 0.0018 | 4.90 1.40 | 150 7 | ||
| Circinus∗∗ | 0.0014 | 0.17 0.03 | 38.55 | 80 |
Note. — (∗) sources with shallow optical spectra, or spectra obtained under non photometric conditions.
(∗∗) sources with MIR fine-structure lines resolved only by ISO.
Col. (3): measurements taken from Lodato & Bertin (2003), Greenhill et al. (2003), Herrnstein et al. (2005), and Neumayer et al. (2007). When more than one measurements were available, we used the value with the lower uncertainty.
Col.(4): The luminosities are computed from Whittle (1992a), Oliva et al. (1994), Veilleux et al. (1995; 1999), Ho et al. (1997a), Marziani et al. (2003) or measured from SDSS spectra. They are not corrected for extinction.
Col.(5): values taken from Heckman et al. (1983), Whittle (1992a), Veilleux et al. (1999), or measured from SDSS spectra.
Col. (6): Host galaxy velocity dispersions are compiled from Pahre (1999), Tecza et al. (2000), Tacconi et al. (2002), Dasyra et al. (2006b), Falcon-Barroso et al. (2006), Hinz & Rieke (2006), Müller Sánchez et al. (2006), Ho (2007), Cappellari et al. (2009), Gültekin et al. (2009), and from the 7th data release of SDSS.
| Galaxy | f | f | f | f | f | |||||
|---|---|---|---|---|---|---|---|---|---|---|
| (-) | (10-18 W m-2) | (10-18 W m-2) | (10-18 W m-2) | (10-18 W m-2) | (10-18 W m-2) | (km s-1) | (km s-1) | (km s-1) | (km s-1) | (km s-1) |
| 2MASSJ09184900+2117170 | 3.61 | 10.86 | 15.65 2.39 | 25.07 | 206 35 | |||||
| 2MASSiJ1659397+183436 | 10.67 | 10.16 | 26.79 2.95 | 10.15 | 277 52 | |||||
| 2MASXJ10514428+3539304 | 6.21 | 9.97 1.98 | 19.45 2.11 | 5.20 | 325 48 | |||||
| 3C249.1 | 4.37 0.40 | 8.85 0.43 | 5.05 0.59 | 370 65 | 286 33 | 329 36 | ||||
| 3C273 | 11.42 1.67 | 36.04 3.33 | 41.58 2.61 | 85.45 6.42 | 21.20 4.21 | 230 39 | 470 87 | 402 47 | 450 67 | 495 57 |
| Ark120 | 28.97 2.53 | 13.56 | 35.23 2.71 | 36.84 3.70 | 10.04 1.61 | 202 32 | 213 38 | 190 39 | ||
| CGCG121-075 | 24.88 1.44 | 24.39 2.00 | 47.28 1.96 | 85.25 1.86 | 16.36 1.25 | 209 50 | 238 42 | 220 27 | 223 43 | |
| ESO140-G043 | 96.32 2.92 | 87.41 2.95 | 139.5 2.2 | 247.6 4.9 | 79.10 2.19 | 203 29 | ||||
| FAIRALL9 | 21.50 1.85 | 28.59 3.86 | 44.80 3.44 | 63.73 3.68 | 20.79 3.77 | 296 45 | 197 36 | 258 48 | 231 42 | |
| IC4329A | 241.5 6.2 | 245.7 9.5 | 535.0 6.8 | 1009 14 | 286.1 8.4 | 227 32 | 235 29 | 256 30 | 275 31 | 282 34 |
| IRAS13342+3932 | 53.68 1.11 | 19.74 1.27 | 28.42 | 98.54 1.72 | 33.98 0.98 | 310 48 | 324 29 | 403 38 | ||
| IRAS13451+1232 | 45.66 1.82 | 5.59 | 70.31 | 27.87 5.24 | 7.86 | 311 37 | 479 54 | |||
| IRAS18216+6418 | 27.52 2.06 | 58.26 1.23 | 104.5 3.5 | 240.1 12.3 | 50.79 1.69 | 214 34 | 304 31 | 237 31 | 343 36 | 390 34 |
| MCG-2-58-22 | 74.71 1.86 | 33.31 | 87.08 3.79 | 126.3 3.6 | 28.26 2.63 | 183 33 | 187 32 | 204 43 | ||
| Mrk1014 | 58.26 1.42 | 33.20 1.67 | 93.20 2.96 | 119.9 5.8 | 46.01 2.39 | 253 37 | 376 36 | 379 41 | 379 39 | 380 48 |
| Mrk279 | 81.42 2.88 | 26.48 2.04 | 80.35 3.97 | 102.8 3.6 | 34.80 2.19 | 215 34 | 237 36 | 222 35 | 248 42 | |
| Mrk335 | 10.54 0.90 | 25.80 | 22.56 1.75 | 130.0 3.7 | 12.88 1.86 | 155 17 | 247 64 | |||
| Mrk493 | 62.69 1.31 | 23.47 | 27.09 1.53 | 28.42 4.76 | 9.59 1.27 | 280 39 | 267 46 | 280 38 | ||
| Mrk590 | 32.81 2.12 | 16.58 | 21.14 2.54 | 31.04 3.06 | 9.57 1.64 | 197 33 | 200 33 | 206 40 | ||
| Mrk704 | 10.05 | 61.44 | 50.82 | 151.67 | 51.08 3.04 | 249 37 | ||||
| Mrk705 | 52.30 1.90 | 23.26 | 49.59 2.11 | 57.82 2.19 | 30.18 1.66 | 192 31 | 210 35 | 280 39 | ||
| NGC3227 | 708.7 25.2 | 220.9 5.5 | 725.8 6.2 | 668.0 17.6 | 231.2 7.5 | 241 32 | 228 30 | 216 29 | 209 34 | |
| NGC3516 | 74.01 2.29 | 128.9 4.4 | 164.4 2.9 | 458.4 5.5 | 67.57 2.18 | 198 30 | 229 28 | |||
| NGC4051 | 172.6 4.9 | 47.59 | 162.0 2.9 | 347.6 7.1 | 107.7 3.9 | 172 29 | 295 27 | |||
| NGC4235 | 34.85 1.62 | 6.03 | 33.29 1.77 | 33.60 3.04 | 5.28 | 214 34 | 286 43 | |||
| NGC5548 | 83.08 3.32 | 42.90 2.55 | 81.76 2.77 | 124.7 8.6 | 31.50 2.16 | 177 30 | 206 38 | |||
| NGC7469 | 1915 27 | 90.00 7.88 | 357.9 7.5 | 340.0 38.0 | 154.4 10.0 | 158 12 | 196 29 | 196 45 | 240 44 | |
| PG0026+129 | 2.56 0.33 | 4.94 0.43 | 7.72 | 20.16 4.01 | 5.07 | 305 40 | ||||
| PG0804+761 | 4.44 | 15.53 2.28 | 20.89 1.70 | 20.74 2.87 | 11.13 | 292 111 | 323 47 | 342 66 | ||
| PG1119+120 | 4.00 | 20.63 2.55 | 28.41 2.01 | 60.00 2.37 | 16.16 2.33 | 193 47 | ||||
| PG1229+204 | 5.84 0.59 | 20.90 | 12.05 1.37 | 26.74 3.55 | 11.48 1.13 | 218 50 | ||||
| PG1351+640 | 21.92 0.99 | 10.26 | 29.39 1.73 | 12.38 | 3.83 | 200 43 | ||||
| PG1411+442 | 4.54 0.79 | 7.79 1.00 | 9.24 0.62 | 13.99 2.31 | 6.49 0.58 | 212 45 | 316 63 | |||
| PG1426+015 | 13.46 1.08 | 13.67 2.28 | 25.55 1.09 | 29.51 4.38 | 8.47 1.09 | 226 38 | 258 36 | 292 57 | 289 57 | |
| PG1440+356 | 42.72 0.96 | 15.55 1.70 | 38.57 1.26 | 50.22 2.37 | 14.26 0.86 | 193 34 | 211 39 | 253 35 | 253 38 | 304 107 |
| PG1613+658 | 37.66 1.23 | 13.25 1.01 | 30.90 1.02 | 66.49 3.15 | 7.92 | 226 30 | 269 33 | 289 33 | 225 29 | |
| PG2130+099 | 16.14 1.22 | 32.54 1.53 | 55.73 2.88 | 100.8 3.7 | 45.16 3.01 | 187 30 | 287 45 | |||
| PG2349-014 | 15.95 0.71 | 6.36 | 20.51 1.01 | 34.73 3.82 | 6.83 | 273 48 | 259 34 | 308 35 | ||
| 3C120 | 78.86 3.72 | 225.7 3.3 | 271.6 3.7 | 1129 7 | 163.8 2.7 | 114 8 | 111 16 | |||
| Mrk509 | 118.0 4.1 | 73.19 3.92 | 153.0 3.4 | 180.0 5.1 | 54.04 2.63 | 173 35 | 165 30 | |||
| NGC3783 | 197.0 3.3 | 128.8 5.1 | 255.9 5.0 | 380.0 8.5 | 152.0 5.2 | 244 12 | 141 24 | 133 21 | ||
| NGC4151 | 1180 12 | 1130 22 | 350.0 13.9 | 2030 33 | 560.0 11.0 | 207 16 | 155 7 | 169 12 | 139 25 |
Note. — No data for the line fluxes indicate no spectral coverage at the observed-frame wavelengths of these lines. No data for the velocity dispersion of detected lines indicate that their signal to noise ratio was between 3 and 5, or that their profiles were unresolved.
| Galaxy | f | f | f | f | f | |||||
|---|---|---|---|---|---|---|---|---|---|---|
| (-) | (10-18 W m-2) | (10-18 W m-2) | (10-18 W m-2) | (10-18 W m-2) | (10-18 W m-2) | (km s-1) | (km s-1) | (km s-1) | (km s-1) | (km s-1) |
| 2MASXJ08035923+2345201 | 6.39 | 5.50 | 18.78 2.08 | 28.45 1.59 | 4.75 | 203 42 | ||||
| 2MASXJ08244333+2959238 | 33.17 2.04 | 20.88 | 49.47 3.44 | 83.64 2.13 | 36.14 2.78 | 207 39 | 264 30 | |||
| 2MASXJ10181928+3722419 | 8.67 1.53 | 6.35 | 14.69 1.87 | 28.81 1.60 | 16.59 2.80 | 200 32 | ||||
| 2MASXJ12384342+0927362 | 8.33 | 20.09 2.25 | 27.85 2.15 | 58.83 2.38 | 12.94 2.35 | 232 42 | 260 42 | 261 36 | 265 73 | |
| 2MASXJ16164729+3716209 | 5.34 | 16.53 1.49 | 22.55 2.52 | 90.14 2.28 | 17.88 2.23 | 211 37 | ||||
| CGCG218-007 | 102.6 3.1 | 35.72 2.64 | 86.07 2.69 | 166.7 2.3 | 46.59 1.98 | 215 33 | ||||
| ESO103-G035 | 294.0 7.6 | 115.1 10.1 | 414.0 9.4 | 311.7 13.9 | 172.9 10.5 | 223 37 | 232 34 | 276 31 | 240 35 | 346 52 |
| IRAS05189-2524 | 191.8 8.9 | 65.30 6.26 | 186.1 7.1 | 261.2 37.2 | 152.6 12.0 | 253 42 | 335 55 | 392 41 | 444 63 | 404 43 |
| IRAS15001+1433 | 66.48 1.36 | 4.74 0.82 | 27.97 0.69 | 21.78 3.21 | 15.89 1.97 | 247 34 | 388 36 | 348 38 | 558 96 | 422 81 |
| IRAS18325-5926 | 367.9 7.8 | 114.9 8.2 | 436.0 5.3 | 390.7 12.2 | 262.6 9.6 | 181 31 | 265 39 | 367 32 | 300 34 | 404 64 |
| IRAS23060+0505 | 32.26 2.40 | 19.65 2.34 | 25.61 2.10 | 35.31 5.45 | 20.12 2.69 | 278 59 | 366 127 | 285 62 | 343 57 | 419 62 |
| MCG-03-34-064 | 514.9 8.2 | 476.1 8.3 | 1150 13 | 1053 22 | 615.6 8.2 | 344 34 | 298 33 | 361 28 | 273 30 | 435 36 |
| Mrk1066 | 1094 21 | 102.0 7.4 | 469.1 7.6 | 418.1 22.1 | 92.38 8.31 | 216 32 | 284 41 | 246 48 | ||
| Mrk1457 | 91.99 2.39 | 14.09 | 38.13 4.09 | 28.10 2.54 | 22.09 3.04 | 228 43 | 310 60 | |||
| Mrk273 | 444.9 7.9 | 101.7 2.3 | 338.1 2.5 | 550.1 17.8 | 112.3 3.7 | 252 30 | 357 34 | 332 30 | 357 38 | 406 32 |
| Mrk3 | 979.8 10.2 | 592.7 6.2 | 1749 11 | 1964 24 | 632.5 7.5 | 276 29 | 322 29 | 314 29 | 263 28 | 327 31 |
| Mrk463E | 108.2 3.5 | 275.0 5.4 | 404.6 7.3 | 641.8 11.3 | 193.9 4.7 | 308 35 | 284 30 | 235 29 | 295 29 | 287 31 |
| Mrk609 | 213.5 6.2 | 22.18 | 56.71 2.53 | 82.43 25.69 | 38.69 4.28 | 202 36 | 488 60 | |||
| Mrk622 | 97.29 13.80 | 8.61 | 49.29 2.82 | 37.42 | 38.06 | 333 34 | ||||
| NGC1068 | 4988 183 | 6199 336 | 13781 246 | 20406 473 | 8974 221 | 359 52 | 414 44 | 383 31 | 364 48 | 363 39 |
| NGC1275 | 461.5 8.0 | 16.26 | 223.7 5.6 | 84.37 | 11.65 | 299 31 | 260 31 | |||
| NGC2622 | 62.02 2.63 | 18.46 | 80.41 2.93 | 89.29 3.58 | 24.73 2.08 | 213 33 | 289 39 | |||
| NGC2623 | 550.1 9.7 | 11.20 1.36 | 147.2 1.7 | 117.4 18.2 | 37.55 2.97 | 213 31 | 357 52 | 222 39 | ||
| NGC2639 | 86.23 2.66 | 6.90 | 48.88 1.95 | 23.82 | 7.51 | 346 43 | 336 49 | |||
| NGC3079 | 1310 60 | 14.61 | 238.3 3.3 | 94.19 | 38.79 | 198 33 | 285 29 | |||
| NGC4258 | 123.5 7.3 | 15.61 | 70.61 5.61 | 79.40 8.03 | 13.67 | 193 42 | 191 36 | 204 53 | ||
| NGC4507 | 307.8 6.9 | 93.08 6.84 | 287.8 6.3 | 354.1 11.6 | 125.7 6.4 | 220 35 | 318 42 | 345 81 | ||
| NGC5256 | 160.6 3.1 | 27.06 1.56 | 94.40 1.45 | 569.8 10.3 | 20.54 1.37 | 227 29 | 239 37 | 227 30 | 191 28 | 202 40 |
| NGC5506 | 850.6 14.3 | 735.4 15.6 | 1537 11 | 2262 40 | 568.0 10.6 | 239 33 | 207 28 | 208 32 | ||
| NGC5728 | 366.2 7.7 | 317.2 8.2 | 536.5 6.7 | 1155 12 | 217.1 3.4 | 272 41 | 263 29 | 306 30 | 314 32 | |
| NGC5929 | 104.8 2.2 | 12.41 1.98 | 95.07 1.40 | 43.67 6.18 | 6.09 | 210 28 | ||||
| NGC6240 | 1872 29 | 38.7 2.9 | 599.9 4.2 | 374.0 35.9 | 90.24 9.02 | 362 37 | 279 52 | 341 29 | ||
| NGC7172 | 334.6 8.1 | 55.74 4.43 | 168.1 4.0 | 384.4 5.3 | 90.23 3.49 | 256 30 | 204 30 | |||
| NGC7674 | 215.7 5.2 | 152.6 5.9 | 346.0 6.5 | 442.9 12.1 | 184.4 7.0 | 267 34 | 253 32 | 242 32 | 267 39 | |
| SBS1133+572 | 108.3 2.9 | 42.01 3.62 | 105.3 3.8 | 168.7 2.8 | 69.89 2.87 | 248 40 | ||||
| UGC02608 | 566.5 9.4 | 292.8 9.5 | 706.3 6.1 | 1378 17 | 312.9 5.1 | 213 31 | ||||
| UGC5101 | 379.7 9.0 | 7.34 | 146.2 2.1 | 57.18 9.66 | 34.19 3.73 | 254 40 | 350 34 | 285 41 | 385 40 | |
| Centaurus A | 2210 45 | 140.0 9.6 | 1400 12 | 980.0 42.2 | 200.0 8.5 | 220 31 | 134 21 | 127 9 | 132 21 | |
| Circinus | 4536 145 | 1270 58 | 4000 90 | 6793 420 | 2180 101 | 91 6 | 86 4 | 113 3 | 90 8 |
Note. — Same as in Table 3
| Galaxy | ( ) | ( ) | (plane equation) |
|---|---|---|---|
| (-) | (107 ) | (107 ) | (107 ) |
| 2MASXJ08035923+2345201 | 2.1 | 9.3 | 4.4 |
| 2MASXJ08244333+2959238 | 0.9 | 17 | 7.5 |
| 2MASXJ10181928+3722419 | 0.7 | 5.3 | 7.3 |
| 2MASXJ12384342+0927362 | 23 | 19 | 16 |
| 2MASXJ16164729+3716209 | 23 | 6.6 | 22 |
| CGCG218-007 | 3.8 | 7.2 | 7.3 |
| ESO103-G035 | 29 | 8.4 | |
| IRAS05189-2524 | 2.7 | 132 | 29 |
| IRAS15001+1433 | 70 | 225 | 41 |
| IRAS18325-5926 | 70 | 17 | |
| IRAS23060+0505 | 75 | 45 | |
| MCG-03-34-064 | 76 | 22 | |
| Mrk1066 | 20 | 7.9 | |
| Mrk1457 | 3.2 | 24 | 10 |
| Mrk273 | 31 | 82 | 28 |
| Mrk3 | 40 | 19 | |
| Mrk463E | 5.5 | 26 | 36 |
| Mrk609 | 3.4 | 120 | 14 |
| Mrk622 | 2.5 | 76 | 9.0 |
| NGC1275 | 32 | 27 | 11 |
| NGC2622 | 18 | 8.2 | |
| NGC2623 | 4.1 | 37 | 7.5 |
| NGC2639 | 10 | 80 | 4.7 |
| NGC3079 | 3.9 | 40 | 3.0 |
| NGC4507 | 41 | 8.4 | |
| NGC5256 | 9.9 | 9.2 | 8.1 |
| NGC5506 | 8.8 | 6.0 | |
| NGC5728 | 32 | 8.7 | |
| NGC5929 | 1.7 | 11 | 3.0 |
| NGC6240 | 23 | 51 | 17 |
| NGC7172 | 9.5 | 4.0 | |
| NGC7674 | 19 | 16 | |
| SBS1133+572 | 15 | 12 | 11 |
| UGC02608 | 6.0 | 11 | |
| UGC5101 | 10 | 71 | 17 |
Note. — The second column corresponds to the result of the stellar relation. The third column presents the estimate using the relation for the NLR, as found in Figure 10. The fourth column uses the plane equation presented in Figure 12. For the NLR gas-based estimates, we present the average value using all resolved lines. Formal, statistical uncertainties are of a factor of 0.5 dex. For individual sources the uncertainty can be higher, typically within an order of magnitude.