Electronic Trap States in Methanofullerenes
Abstract
The trap states in three fullerene derivatives, namely PC61BM ([6,6]-phenyl C61 butyric acid methyl ester), bisPC61BM (bis[6,6]-phenyl C61 butyric acid methyl ester) and PC71BM ([6,6]-phenyl C71 butyric acid methyl ester), are investigated by thermally stimulated current measurements (TSC). Thereby, the lower limit of the trap densities for all studied methanofullerenes exhibits values in the order of m-3 with the highest trap density in bisPC61BM and the lowest in PC61BM. Fractional TSC measurements on PC61BM reveal a broad trap distribution instead of discrete trap levels with activation energies ranging from 15 meV to 270 meV and the maximum at about 75 meV. The activation energies of the most prominent traps in the other two fullerene derivatives are significantly higher, being at 96 meV and 223 meV for PC71BM and 184 meV for bisPC61BM, respectively. The influence of these findings on the performance of organic solar cells is discussed.
This is the pre-peer reviewed version of the following article: J.SCHAFFERHANS, C. DEIBEL, AND V. DYAKONOV. ELECTRONIC TRAP STATES IN METHANOFULLERENES. ADVANCED ENERGY MATERIALS, 1:655, 2011 which has been published in final form at
[Advanced Energy Materials 1, 655 (2011)].
I Introduction
Methanofullerenes are the most commonly used electron acceptors in organic bulk heterojunction solar cells Deibel and Dyakonov (2010). The first use of fullerene and its derivatives in organic photovoltaics (OPV) was introduced in Yu et al. (1995); Sariciftci et al. (1992). Since that, the methanofullerenes became the main type of acceptors in OPV. Also in the current record organic solar cell with efficiency of 8.3 % Green et al. (2011) a methanofullerene is used as acceptor. The advantages of methanofullerenes are that they can be easily processed from solution, possess high electron affinities and form segregated phases in blends with common donor polymers. Furthermore the used methanofullerenes yield good electron mobilities. For example, space–charge limited current mobilities for electrons of 210-3 cm2/Vs in PC61BM diode structures are reported Mihailetchi et al. (2003).
To further enhance the power conversion efficiencies of organic solar cells, a recent approach is to use multiple adduct fullerene derivatives Lenes et al. (2008); He et al. (2010), such as bisPC61BM. Multiple side chains on the fullerene cage lead to an increase of the lowest unoccupied molecular orbital resulting in a raise of the open circuit voltage.
Despite the importance of methanofullerenes, little attention was paid to thin films of the pure materials except the mobility measurements in n-type Singh et al. (2005); Wöbkenberg et al. (2008) or ambipolar Anthopoulos et al. (2004, 2005) transistors and methanofullerene diodes Mihailetchi et al. (2003); Lenes et al. (2008).
Recently, quantum chemical and voltammetric studies have been performed for PC61BM and its higher fullerene adducts Frost et al. (2010), revealing a variety of HOMO and LUMO energies for the adducts with multiple side chains, due to the different isomers they consist of.
Lenes et al. Lenes et al. (2009) investigated electron–only devices based on fullerene derivatives and a variety of their bisadducts blended with poly(3-hexylthiophene) by current–voltage measurements. The lower currents of the devices with bisadducts were attributed to shallow trapping. This conclusion was supported by device simulations introducing a distribution of traps, which enabled to fit the current–voltage curves.
Although, trap states can have a significant influence on the performance of organic solar cells, as they can act as recombination centers, lower the mobility and disturb the internal field distribution, direct identification of the trap states in methanofullerene films has not been performed so far.
In this paper we investigate the trap states in three commonly used fullerene derivatives, namely PC61BM, PC71BM and bisPC61BM, by thermally stimulated current measurements.
II Results and Discussion
II.1 Experimental Results
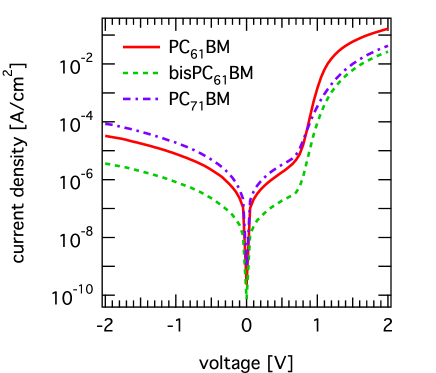
The current–voltage characteristics of the investigated samples are shown in Fig. 1. The device currents in forward bias of bisPC61BM and PC71BM are lower compared to PC61BM, with the lowest current for bisPC61BM.
The TSC spectrum of the PC61BM sample is shown in Fig. 2 (black line). In this experiment, the current is measured upon warming up the device (see Experimental part). TSC behavior is observed between 18 K and 160 K with the maximum at about 55 K. No additional TSC peak can be detected at higher temperatures up to room temperature. Already at 18 K a small current of about 0.5 pA can be measured, indicating a release of trapped charge carriers. In addition to the maximum of the TSC spectrum at 55 K, small shoulders can be seen on the low temperature side (at about 25 K) as well as on the high temperature side (at about 90 K). The shape of the TSC spectrum indicates a trap distribution instead of discrete trap levels. A lower limit of the trap density nt can be obtained by integrating the TSC spectrum over the time, according to the inequality Kadashchuk et al. (2005):
| (1) |
with the elementary charge and the sample volume . The inequality (1) is justified by the fact that the estimated trap density is only a lower limit of the actual one. Incomplete trap filling, partial detrapping of charges during thermalization and recombination of the detrapped charge carriers of opposite signs are reasons therefor. According to inequality (1), the lower limit of the trap density of PC61BM yields 1.7 m-3.
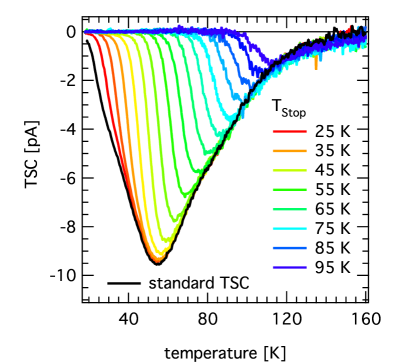
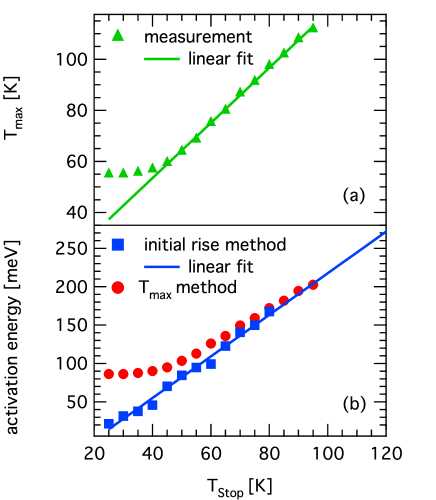
To get further information about the trap distribution we applied fractional TSC measurements, the so called – method Schmechel and von Seggern (2004); von Malm et al. (2002). The illumination and thermalization of the sample was performed under the same conditions as for the standard TSC measurement, but instead of ramping the whole temperature range, the sample was only heated to a certain temperature (prerelease). Afterwards, the sample was cooled down to (18 K) and without further trap filling the whole TSC scan was performed (main run). This procedure was repeated for different , ranging from 25 K to 120 K in steps of 5 K. Then, a standard TSC spectrum was recorded again, to ensure that no degradation of the sample during the measurements occurred. This TSC spectrum (not shown) is identical to the initial measurement. Therefore, a degradation of the sample during the – cycles can be excluded. The main runs of the fractional TSC for different are shown in Fig. 2. The shoulder at low temperatures becomes less pronounced for increasing due to emptying of the shallower traps during the prerelease and disappears for 35 K. The height and position of the main peak is unaffected by the prerelease up to 40 K. For higher the peak maximum of the TSC decreases and shifts to higher temperatures. The maximum position of the TSC () is plotted vs in Fig. 3a (triangles), showing a linear dependence for 40 K of slope 1. A discrete trap level, in contrast, would result in a constant maximum temperature, since only the number of trapped charges changes with but not the activation energy; therefore the TSC peak would remain at the same position. On the other hand, a series of trap levels, with well separated TSC peaks, would result in a staircase in the – plot, with a flat region for each trap level. The closer are the trap levels and the more the TSC peaks overlap, the smoother becomes the staircase. A linear dependence of on , as seen in Fig. 3a, is due to closely overlapping or a quasi-continuous distribution of TSC peaks McKeever (1980, 1985) and reflects a quasi-continuous distribution of trap states in PC61BM. With increasing the shallower traps get emptied and the influence of the deeper trap states on the TSC peak becomes stronger, resulting in a shift of the maximum to higher temperatures.
The activation energies can be estimated from the exponential initial rise Garlick and Gibson (1948) of the fractional TSC measurements for each from:
| (2) |
where is the thermally stimulated current in the initial rise, the Boltzmann constant and the temperature. Hence, the activation energies for 80 K were determined from the Arrhenius plot, whereas the signal-to-noise ratio was too low for the cycles with above 80 K. The advantage of the initial rise method is that it can be applied without further knowledge of the kinetics of the TSC (i.e., if there is slow or fast retrapping of the charge carriers) Nicholas and Woods (1964). The obtained activation energies are shown in Fig. 3b (squares). They show a good linear dependence on , therefore, we linearly extrapolated the activation energies to estimate them in the range of 80 K.
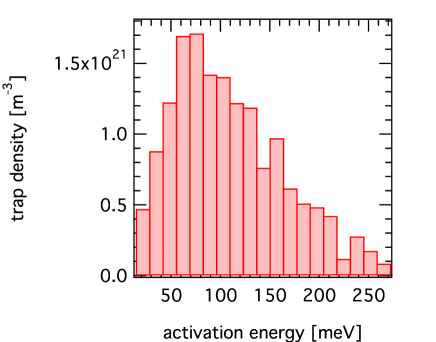
Applying inequality (1) to fractional TSC measurements, the trap densities for each interval can be estimated. These can be related to the activation energies extracted from the initial rise, as shown in Fig. 4, yielding a reconstruction of the density of occupied states (DOOS) Schmechel and von Seggern (2004). The histogram displays a broad trap distribution ranging from 15 meV to 270 meV with the maximum at about 75 meV.
The activation energy of the most prominent trap can also be approximately calculated using Fang et al. (1990):
| (3) |
Here, is the heating rate used in the TSC measurements. This method (in the following called Tmax method) has also been used to estimate the activation energies of trap states in poly(3-hexylthiophene) (P3HT):PC61BM solar cells Kawano and Adachi (2009) and C60 field effect transistors Matsushima et al. (2007). The advantage of this method is that no time consuming fractional measurements are needed. However, it only gives an approximation of the dominating trap states, since otherwise distinct TSC maxima are needed. Nevertheless, to compare the trap states of different materials the information about the activation energies of the most prominent traps can be sufficient. Since the Tmax method is based on some assumptions and simplifications (e.g. retrapping of charge carriers is neglected) Nicholas and Woods (1964); Fang et al. (1990), we first compare the activation energies of PC61BM estimated by Equation (3) with the results of the initial rise method (Equation (2)). As can be seen from Fig. 3b, the activation energy obtained with the Tmax method (circles) remains nearly constant for 40 K. This constant value of about 86 meV is caused by the fact that at low the temperature of the TSC peak maximum does not change, since the dominant traps are not affected by the prerelease, as already mentioned above. Hence, the activation energies obtained by the Tmax method are overestimated with respect to those from the initial rise method (squares), as the latter are dominated by the shallowest occupied traps. For 40 K, the activation energy obtained from the Tmax method rises due to the emptying of the prominent traps and the enhanced contribution of the remaining deeper traps. The difference between both methods diminishes.
By applying Equation (3) to a standard (non-fractional) TSC scan one gets the activation energy of the most prominent traps. Therefore, the value of 86 meV (Fig. 3b) has to be compared to the energy distribution maximum shown in Fig. 4. We may conclude, the Tmax method is a good approximation to gain the activation energy of the dominant trap states in methanofullerenes.
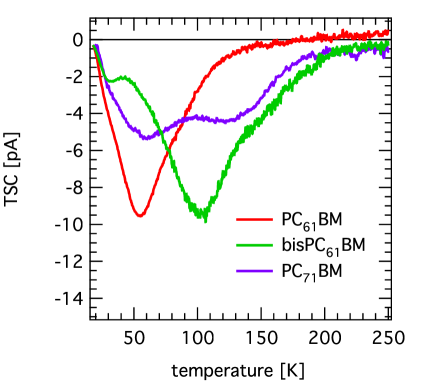
In addition to the investigations of PC61BM we performed TSC measurements on bisPC61BM and PC71BM. The spectra are shown in Fig. 5, with PC61BM for comparison. Both, bisPC61BM and PC71BM, yield an even broader TSC spectrum than PC61BM, implying a broader trap distribution and higher activation energies. For bisPC61BM two distinct maxima can be seen in the TSC spectrum, one at about 32 K and the dominant one at about 103 K, as well as a shoulder at about 160 K, indicating at least three different trap levels. PC71BM yields two maxima with almost the same height at about 60 K and 120 K.
To give an estimation of the activation energies of the traps in bisPC61BM and PC71BM, we used the Tmax method according to Equation (3). The resulting activation energies of the distinct traps (the shoulder of bisPC61BM is neglected), the corresponding temperatures of the TSC maxima, as well as the lower limits of the total trap densities are summarized in Table 1.
| sample | trap density [m-3] | [K] | [meV] |
|---|---|---|---|
| PC61BM | 1.7 | 54.9 | 86 |
| bisPC61BM | 2.3 | 32.4 | 45 |
| 103 | 184 | ||
| PC71BM | 2.0 | 60.1 | 96 |
| 121.4 | 223 |
II.2 Discussion
As summarized in Table 1, bisPC61BM exhibits a trap density 2.3m-3 which is about 35 % higher than the value obtained for PC61BM. Also the trap density of PC71BM is higher than the one for PC61BM. However, we emphasize that the estimated trap densities are only lower limits.
Furthermore, the three fullerene derivatives feature very different TSC spectra (Fig. 5). BisPC61BM yields a much broader TSC spectrum than PC61BM. The small TSC peak of bisPC61BM at about 32 K with corresponding activation energy of the traps of 45 meV is in good agreement with the low temperature shoulder of PC61BM; it has therefore probably the same origin. However, the most prominent trap in bisPC61BM exhibits an activation energy of about 184 meV which is considerably higher than the activation energy of the dominant trap in PC61BM of about 86 meV. The shoulder on the high temperature side of the bisPC61BM TSC peak indicates the presence of a significant amount of even deeper traps. The high activation energies might originate from the mixture of isomers in bisPC61BM. The lowest unoccupied molecular orbital energies for the different isomers range from -3.71 eV to -3.54 eV Frost et al. (2010), introducing a higher energetic disorder—where the lowest lying states may act as traps. Furthermore, due to the additional side chains a close packing of the buckyballs is inhibited, which may result in a higher spatial disorder, also introducing additional traps.
PC71BM yields two distinct peaks in the TSC spectrum. The one at lower temperatures with an activation energy of about 95 meV is quite similar to the main trap of PC61BM. The second one yields high trap activation energies of about 223 meV. Similar to bisPC61BM, PC71BM also consists of multiple isomers (one major and two minor isomers) Brabec et al. (2008) which might be the origin of the deep traps. Furthermore, the PC71BM batch has a lower purity grade (99 %) compared to PC61BM (99.5 %) and therefore a higher impurity concentration which can lead to a higher trap density. Another explanation for the higher trap density and the deeper traps compared to PC61BM might be a higher disorder in PC71BM films, due to the spatial anisotropy of C70.
The shapes of the TSC spectra (the shoulders in addition to the main peak) of the three investigated methanofullerenes indicate that the trap distribution of each of the fullerene derivatives consists of at least three peaks. This is affirmed by the fractional TSC measurements on PC61BM yielding a quasi-continuous trap distribution between 15 meV and 270 meV. The TSC peaks of PC71BM and bisPC61BM are even broader compared to PC61BM, which is in agreement with the reported higher energetic disorder of bisPC61BM Lenes et al. (2009); Frost et al. (2010).
The higher trap densities and activation energies in bisPC61BM and PC71BM compared to PC61BM are consistent with the observed lower currents in forward bias of these devices (Fig. 1). In the case of bisPC61BM this has also been observed before Lenes et al. (2009) and was attributed to trapping. However direct measurements of the traps were missing so far.
Due to the high trap densities in the investigated methanofullerenes in the order of m-3, which is in the range of charge carrier densities of operating solar cells Shuttle et al. (2008a); Rauh et al. (2011), a strong influence on the solar cell performance can be expected. Although, bisPC61BM has successfully been used in P3HT:fullerene photovoltaic devices, a reduced photocurrent was observed compared to solar cells using PC61BM as acceptor Lenes et al. (2008, 2009); Faist et al. (2011). Thereby, the reduced photocurrent is not due to a lower free polaron generation yield (as might be assumed because of the lower electron affinity of bisPC61BM compared to PC61BM). Even a higher charge photogeneration efficiency in the P3HT:bisPC61BM blend was demonstrated by transient absorption spectroscopy Faist et al. (2011). Instead, the loss in short circuit current was attributed to the significantly lower (about one order of magnitude) electron mobility in bisPC61BM compared to PC61BM Faist et al. (2011); Lenes et al. (2008). This increases the recombination probability during charge extraction and therefore reduces the photocurrent. The lower mobility of bisPC61BM is in agreement with our measurements, showing a higher trap density and deeper trap states in bisPC61BM compared to PC61BM. Furthermore, a slower decay of transient absorption intensity was observed in the blends with bisPC61BM Faist et al. (2011). This was attributed to trapping and detrapping events resulting in a delay in the bimolecular recombination of charges. Our measurements reveal the presence of deeper trap states in bisPC61BM, leading to a slower release of trapped charges, which is in agreement with the reported reduced recombination dynamics.
Protracted charge carrier decay dynamics, with a charge carrier density dependence larger than order of two, are often reported in organic solar cells Shuttle et al. (2008b); Foertig et al. (2009) and are attributed to trapping of charges. Due to the high trap densities in the methanofullerenes, which are even higher than the reported trap density of pristine P3HT Schafferhans et al. (2008), the recombination dynamics should be also significantly influenced by the acceptor, not only by the donor polymer. Because of the higher trap densities and deeper traps in bisPC61BM and PC71BM we expect even stronger dependences of the charge carrier decay on the charge carrier density in blends with bisPC61BM and PC71BM than in those with PC61BM.
III Conclusions
We investigated the trap states in PC61BM, PC71BM and bisPC61BM by thermally stimulated current measurements. The lower limit of the trap densities for each of the three methanofullerenes yields values in the order of m-3 with the highest trap density for bisPC61BM of m-3. The activation energies of the most prominent traps in PC71BM are 96 meV and 223 meV and 184 meV for bisPC61BM. Both reveal significantly deeper traps than PC61BM, with an activation energy for the dominant trap of about 86 meV. These findings are consistent with the observed lower device currents in forward bias of the PC71BM and bisPC61BM diodes. Additional fractional TSC measurements on PC61BM revealed a broad trap distribution instead of discrete trap levels with activation energies ranging from 15 meV to 270 meV.
IV Experimental Section
The fullerene derivatives PC61BM ([6,6]-phenyl C61 butyric acid methyl ester) (purity 99.5 %), bisPC61BM (bis[6,6]-phenyl C61 butyric acid methyl ester) (purity 99.5 %) and PC71BM ([6,6]-phenyl C71 butyric acid methyl ester) (purity 99 %) in planar diode structures were used, prepared as follows. Structured indium tin oxide (ITO)/glass substrates were cleaned successively in soap water, acetone and isopropanol for at least 10 min in an ultrasonic bath. Afterwards, poly(3,4-ethylenedioxythiophene):(polystyrenesulfonate) (PEDOT:PSS) was spin coated on the substrates to serve as anode (thickness about 40 nm). After transferring the samples into a nitrogen filled glovebox a heating step of 130 ∘C for 10 min was applied. The fullerene derivatives were spin coated from chloroform solution (PC61BM: 30 mg/ml 600 rpm, bisPC61BM and PC71BM: 20 mg/ml 800 rpm). The layer thicknesses were about 200 nm as measured with a profilometer. LiF (1 nm)/Al (120 nm) top contacts were evaporated thermally (base pressure during evaporation mbar). The effective areas of the devices were about 9 mm2. Fullerene derivatives were purchased from Solenne and used without further purification. PEDOT:PSS was purchased from H. C. Starck (CLEVIOS P VP Al 4083).
Initial current–voltage (IV) characteristics were measured in the nitrogen glovebox. Thermally stimulated current (TSC) measurements were performed in a closed cycle cryostat with Helium as contact gas. Via an integrated lock, the samples were transferred from the glovebox to the cryostat, avoiding potential degradation of the samples due to air exposure. Trap filling was achieved by illumination of the samples at 18 K for five minutes using a 10 W high power white light emitting diode (Seoul). After a dwell time of five minutes the temperature was increased with a constant heating rate of 6.9 K/min up to 300 K. The TSC signals were detected by a Sub-Femtoamp Remote Source Meter (Keithley 6430) without applying an external field, implying that the detrapped charge carriers were extracted from the samples only due to the built-in voltage. Further details of the TSC measurements are described elsewhere Schafferhans et al. (2008, 2010).
Acknowledgements
The current work is supported by the Bundesministerium für Bildung und Forschung in the framework of the OPV Stability Project (Contract No. 03SF0334F). J.S. thanks the Elitenetzwerk Bayern for funding. C.D. gratefully acknowledges the support of the Bavarian Academy of Sciences and Humanities. V.D.’s work at the ZAE Bayern is financed by the Bavarian Ministry of Economic Affairs, Infrastructure, Transport and Technology and by the Deutsche Forschungsgemeinschaft within the INST 93/557-1 project.
References
- Deibel and Dyakonov (2010) C. Deibel and V. Dyakonov. Polymer-fullerene bulk heterojunction solar cells. Rep. Prog. Phys., 73:096401, 2010.
- Yu et al. (1995) G. Yu, J. Gao, J. C. Hummelen, F. Wudl, and A. J. Heeger. Polymer photovoltaic cells: Enhanced efficiencies via a network of internal doner-acceptor heterojunctions. Science, 270:1789, 1995.
- Sariciftci et al. (1992) N. S. Sariciftci, L. Smilowitz, A. J. Heeger, and F. Wudl. Photoinduced electron transfer from a conducting polymer to buckminsterfullerene. Science, 258:1474, 1992.
- Green et al. (2011) M. A. Green, K. Emery, Y. Hishikawa, and W. Warta. Solar cell efficiency tables (version 37). Prog. Photovolt: Res. Appl., 19:84, 2011.
- Mihailetchi et al. (2003) V. D. Mihailetchi, J. K. J. van Duren, P. W. M. Blom, J. C. Hummelen, R. A. J. Janssen, J. M. Kroon, M. T. Rispens, W. J. H. Verhees, and M. M. Wienk. Electron transport in a methanofullerene. Adv. Funct. Mater., 13:43, 2003.
- Lenes et al. (2008) M. Lenes, G.-J. A. H. Wetzelaer, F. B. Kooistra, S. C. Veenstra, J. C. Hummelen, and P. W. M. Blom. Fullerene bisaducts for enhanced open-circuit voltages and efficiencies in polymer solar cells. Adv. Funct. Mater., 20:2116, 2008.
- He et al. (2010) Y. He, H.-Y. Chen, J. Hou, and Y. Li. Indene–C60 bisadduct: A new acceptor for high-performance polymer solar cells. J. Am. Chem. Soc., 132:1377, 2010.
- Singh et al. (2005) Th. B. Singh, N. Marjanovic, P. Stadler, M. Auinger, G. J. Matt, S. Günes, and N. S. Sariciftci. Fabrication and characterization of solution-processed methanofullerene-based organic field-effect transistors. J. Appl. Phys., 97:083714, 2005.
- Wöbkenberg et al. (2008) P. H. Wöbkenberg, D. D. C. Bradley, D. Kronholm, J. C. Hummelen, D. M. de Leeuw, M. Cölle, and T. D. Anthopoulos. High mobility n-channel organic field-effect transistors based on soluble C60 and C70 fullerene derivatives. Synth. Met., 158:468, 2008.
- Anthopoulos et al. (2004) T. D. Anthopoulos, D. M. de Leeuw, E. Cantatore, S. Setayesh, E. J. Meijer, C. Tanase, J. C. Hummelen, and P. W. M. Blom. Organic complementary-like inverters employing methanofullerene-based ambipolar field-effect transistors. Appl. Phys. Lett., 85:4205, 2004.
- Anthopoulos et al. (2005) T. D. Anthopoulos, D. M. de Leeuw, E. Cantatore, P. van ’t Hof, J. Alma, and J. C. Hummelen. Solution processible organic transistors and circuits based on a C70 methanofullerene. J. Appl. Phys., 98:054503, 2005.
- Frost et al. (2010) J. M. Frost, M. A. Faist, and J. Nelson. Energetic disorder in higher fullerene adducts: A quantum chemical and voltammetric study. Adv. Mater., 22:4881, 2010.
- Lenes et al. (2009) M. Lenes, S. W. Shelton, A. B. Sieval, D. F. Kronholm, J. C. Hummelen, and P. W.M. Blom. Electron trapping in higher adduct fullerene-based solar cells. Adv. Funct. Mater., 19:3002, 2009.
- Kadashchuk et al. (2005) A. Kadashchuk, R. Schmechel, H. von Seggern, U. Scherf, and A. Vakhnin. Charge-carrier trapping in polyfluorene-type conjugated polymers. J. Appl. Phys., 98:024101, 2005.
- Schmechel and von Seggern (2004) R. Schmechel and H. von Seggern. Electronic traps in organic transport layers. Phys. Stat. Sol. A, 201:1215, 2004.
- von Malm et al. (2002) N. von Malm, J. Steiger, H. Heil, R. Schmechel, and H. von Seggern. Electronic traps and percolation paths in electroluminescent polymers. J. Appl. Phys., 92:7564, 2002.
- McKeever (1980) S. W. S. McKeever. On the analysis of complex thermoluminescence glow-curves: Resolution into individual peaks. Phys. Stat. Sol. A, 62:331, 1980.
- McKeever (1985) S. W. S. McKeever. Thermoluminescence of solids. Cambridge University Press, 1985.
- Garlick and Gibson (1948) G. F. J. Garlick and A. F. Gibson. The electron trap mechanism of luminescence in sulphide and silicate phosphors. Proc. Phys. Soc., 60:574, 1948.
- Nicholas and Woods (1964) K. H. Nicholas and J. Woods. The evaluation of electron trapping parameters from conductivity glow curves in cadmium sulphide. Brit. J. Appl. Phys., 15:783, 1964.
- Fang et al. (1990) Z. Fang, L. Shan, T. E. Schlesinger, and A. G. Milnes. Study of defects in LEC-grown undoped Si-GaAs by thermally stimulated current spectroscopy. Material Science and Engineering, B5:397, 1990.
- Kawano and Adachi (2009) K. Kawano and C. Adachi. Evaluating carrier accumulation in degraded bulk heterojunction organic solar cells by a thermally stimulated current technique. Adv. Funct. Mater., 19:3934, 2009.
- Matsushima et al. (2007) T. Matsushima, M. Yahiro, and C. Adachi. Estimation of electron traps in carbon-60 field-effect transistors by a thermally stimulated current technique. Appl. Phys. Lett., 91:103505, 2007.
- Brabec et al. (2008) C. Brabec, V. Dyakonov, and U. Scherf, editors. Organic Photovoltaics. Wiley-VCH, 2008.
- Shuttle et al. (2008a) C. G. Shuttle, A. Maurano, R. Hamilton, B. O’Regan, J. C. de Mello, and J. R. Durrant. Charge extraction analysis of charge carrier densities in a polythiophene/fullerene solar cell: Analysis of the origin of the device dark current. Appl. Phys. Lett., 93:183501, 2008a.
- Rauh et al. (2011) D. Rauh, A. Wagenpfahl, C. Deibel, and V. Dyakonov. Relation of open circuit voltage to charge carrier density in organic bulk heterojunction solar cells. Appl. Phys. Lett., 98:133301, 2011.
- Faist et al. (2011) M. A. Faist, P. E. Keivanidis, S. Foster, P. H. Wöbkenberg, T. D. Anthopoulos, D. D. C. Bradley, J. R. Durrant, and J. Nelson. Effect of multiple adduct fullerenes on charge generation and transport in photovoltaic blends with poly(3-hexylthiophene-2,5-diyl). Journal of Polymer Science: Part B: Polymer Physics, 49:45, 2011.
- Shuttle et al. (2008b) C. G. Shuttle, B. O’Regan, A. M. Ballantyne, J. Nelson, D. D. C. Bradley, J. de Mello, and J. R. Durrant. Experimental determination of the rate law for charge carrier decay in a polythiophene:fullerne solar cell. Appl. Phys. Lett., 92:093311, 2008b.
- Foertig et al. (2009) A. Foertig, A. Baumann, D. Rauh, V. Dyakonov, and C. Deibel. Charge carrier concentration and temperature dependent recombination in polymer-fullerene solar cells. Appl. Phys. Lett., 95:052104, 2009.
- Schafferhans et al. (2008) J. Schafferhans, A. Baumann, C. Deibel, and V. Dyakonov. Trap distribution and the impact of oxygen-induced traps on the charge transport in poly(3-hexylthiophene). Appl. Phys. Lett., 93:093303, 2008.
- Schafferhans et al. (2010) J. Schafferhans, A. Baumann, A. Wagenpfahl, C. Deibel, and V. Dyakonov. Oxygen doping of P3HT:PCBM blends: Influence on trap states, charge carrier mobility and solar cell performance. Organic Electronics, 11:1693, 2010.