Reconstructions in human history by mapping dental markers in living Eurasian populations
Abstract
On the base of advantages in gene geography and anthropophenetics the phenogeographical method for anthropological research is initiated and experienced using dental data. Statistical and cartographical analyses are provided for 498 living Eurasian populations. Mapping principal components supplied evidence for the phene pool structure in Eurasian populations and for reconstructions of our species history on the continent. The longitudinal variability seems to be the most important regularity revealed by principal components analysis (PCA) and mapping proving the division of the whole area into western and eastern main provinces. So, the most ancient scenario in the history of Eurasian populations was developing from two perspective different groups: western group related to ancient populations of West Asia and the eastern one rooted by ancestry in South and/or East Asia. In spite of the enormous territory and the revealed divergence the populations of the continent have undergone wide scale and intensive time-space interaction. Many details in the revealed landscapes could be backgrounded to different historical events. The most amazing results are obtained for proving migrations and assimilation as two essential phenomena in Eurasian history: the wide spread of the western combination through the whole continent till the Pacific coastline and the envision of the movement of the paradox combinations of eastern and western markers from South or Central Asia to the east and to the west. Taking into account that no additional eastern combinations in the total variation in Asian groups have been found but mixed or western markers’ sets and that eastern dental characteristics are traced in Asia since Homo erectus, the assumption is made in favour of the hetero-level assimilation in the Eastern province and of net-like evolution of our species.
keywords:
Dental markers , PCA , mapping , Eurasia1 Introduction
This study shoots out from two inspiring sources: progress in genetic reconstructions of our species history and experience in accumulating and analysis rich dental data on living and fossil human populations. The innovation is in combining both advantages to provide new knowledge on Eurasian ancestry. Principles of anthropophenetics determine the basic approach to the research and allow using methods of population genetics. Phenes (discrete irreducible morphological traits) yield to genes in number and in marking precision but win in extent of genome covering. Dental traits provide the best possibility to examine directly time records in populations. Mapping applications can detect many different patterns hidden in numerous tabled data; each pattern seems to have a certain historical content. Computer maps provide both analysis and visualization of the enormous volume of data accumulated in dental anthropology. The study is the first experience of this sort.
2 Material and methods
The study involves data from 498 samples, 50257 individuals in total, drawn from living populations in Eurasia and Africa.
The material was taken from a great number of publications, the major its part is presented in two generalizing books by Zoubov (1973, 1989); the other part is our own recent data on populations of the Caucasus (86 samples), the Far East (3 samples) and on the Russians (27 samples) (Kashibadze, 2006).
To process this rich information the universal system of analysis, visualization and mapping of dental data Eurasia has been developed by the authors. All dental data on living and fossil Eurasian populations available to this moment are managed by the MySQL relational database. Data refer to 830 populations, 32 dental traits, no less than 120 dental phenes as several grades or discrete variations of a trait, and 12 historical periods from the Palaeolithic to the present.
All the data operations including statistics and visualization are implemented as routines written in Python. In several cases C modules are used to improve the performance. The basic statistics are executed using the principal component analysis (PCA) method with the help of PCA Module algorithms (http://folk.uio.no/henninri/pca_module/). Mapping of separate dental markers frequencies and PC scores is accomplished via the Matplotlib Basemap Toolkit (http://matplotlib.sourceforge.net/basemap/doc/html/).
The whole system is managed through web interface built within Django framework (http://www.djangoproject.com/) allowing to handle the database, to generate dynamic graphics and to save it in vector or bitmap formats.
The study program is common in the Russian Federation and includes 32 non-metric dental traits (Zoubov, 1968, 1973; Zoubov & Khaldeeva, 1989). But the real situation is that only few markers are usually presented in published tables of frequencies, so we had to find reasonable balance between number of populations and number of markers involved into PCA. Thus the numbers are 498 and 8 respectively.
In total, 143 phenogeographical maps have been created, but in the present short paper only 4 of them, i.e. mapping scores of the four PCs, are overviewed and discussed.
The maps were constructed by interpolating the PC score distribution with the Gaussian as a weight function. We have adopted the following parameters for constructing maps in the case of living populations: the averaging window , the weight function range and the total number of grid knots 50,400. Small black points indicate the location of the populations under investigation. Only aboriginal groups are investigated.
3 Results and discussion
Conclusions derived from maps interpretation are often ultimately compiled on the basis of how authors envisage their data fit with established genetic, archaeological or linguistic theories. We try to make such conclusion in the most independent way and on the basis of experience in dental anthropology and anthropophenetics. Only this approach can provide really new knowledge.
The PCA results are presented in table 1.
| Dental phenes | 1st PC | 2nd PC | 3rd PC | 4th PC |
|---|---|---|---|---|
| Variability | 53 % | 13 % | 9 % | 7 % |
| Shoveling : | 0.40 | 0.01 | 0.23 | 0.11 |
| 4-cusped | 0.25 | 0.62 | 0.55 | 0.28 |
| 6-cusped | 0.39 | 0.19 | 0.02 | 0.03 |
| 4-cusped | 0.41 | 0.24 | 0.00 | 0.05 |
| Distal trigonid crest on | 0.33 | 0.37 | 0.13 | 0.76 |
| Deflecting wrinkle on | 0.39 | 0.08 | 0.32 | 0.48 |
| Confluence furrows 2 med and II on | 0.36 | 0.28 | 0.13 | 0.03 |
| Carabelli cusp | 0.24 | 0.55 | 0.72 | 0.31 |
The weight of a certain trait is defined as loadings for a corresponding normalized -transformed (arcsine-transformed) frequency in the linear combination specifying the component. PCA was applied to the among-group dental variability.
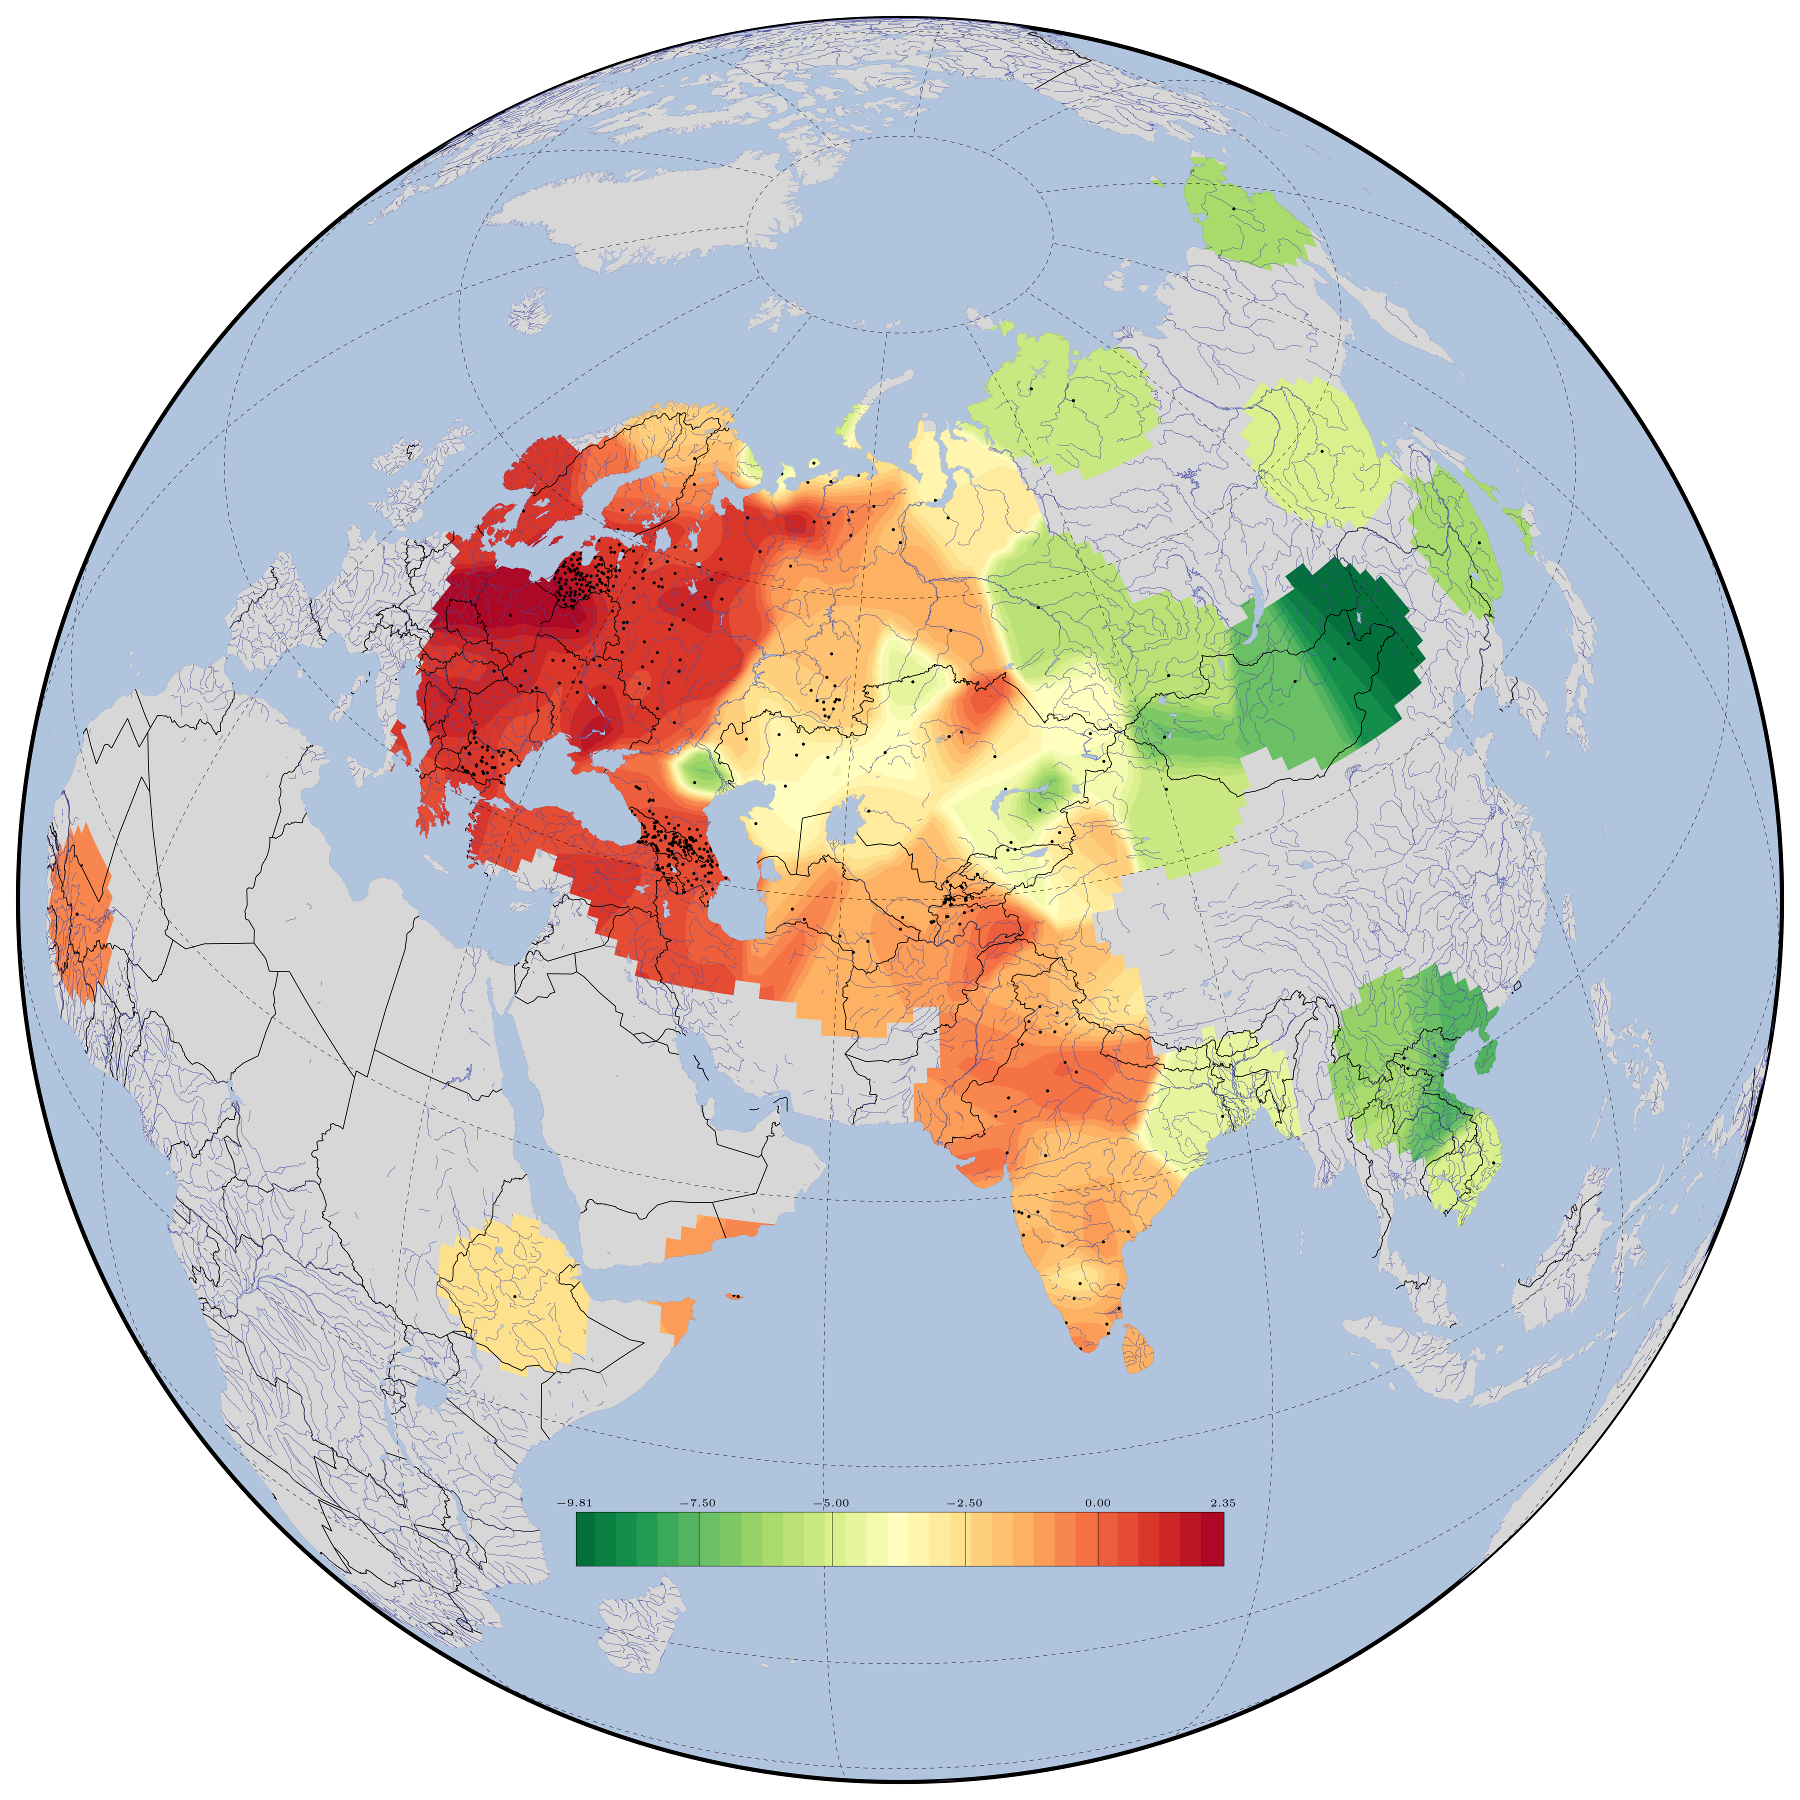
The longitudinal variability of phene pool in Eurasian populations seems to be the most important regularity revealed by mapping and PCA (fig. 1). The geographical factor provides the main contribution to the revealed diversity. The 1st PC explains 53 % of the total phenetic variation. All populations under investigation are divided into two main provinces: the western area with high PC1 scores and the eastern one with low scores.
Several scenarios of different time series could determine this pattern. The larger is the space embracing populations that share similar frequencies, the deeper is the time in their divergence. So, we can suggest the most ancient scenario in the history of Eurasian populations was developing from two perspective different groups.
Africa presented by populations from Ethiopia (Shinkarenko et al., 1984) and the Republic of Mali (Keita, 1977) joins the western province.
The map shows clines of evident phene flows from Near East north-eastward to Siberia. It could be backgrounded to intensive post-Neolithic expansion or to any earlier events. It’s the matter for further research. Another flow can be easily traced from east to west along the steppe belt of the continent. It is explained by the latest (early medieval) expansion from Inner Asia evoking oscillatory migratory waves in population settled along the steppe belt, thus comprising a complicated system in populational interaction. The Kalmyks in the south of East Europe is the western final point in this expansion.
The contact zone between the provinces occupies the Urals, West Siberia, Middle Asia and India.
Regarding the split in two main provinces it should be noted that this phenomenon in Eurasia can be traced since Homo erectus. Indeed, archaic western forms show a low grade of shoveling and poor differentiation in odontoglyphical patterns on molars versus extremely developed shoveling and richness in odontoglyphics in the eastern province (Zoubov & Khaldeeva, 1989, pp. 196–197). Chronology and dynamics in different morphological systems’ evolution seem to be rather independent, while dental characteristics demonstrate much antiquity in phylogeny and provide a direct bridge from the present to the far past inaccessible for cranial traits, as our recent research on ancient and living Caucasian populations showed (Kashibadze, 2006). It is worth to mention that both western and eastern forms of Homo erectus had five-cusped and six-cusped lower molars (Zoubov & Khaldeeva, 1989), their gracilization is a peculiar characteristic of Homo sapiens, still eastern living populations keep higher frequencies in five-six-cusped lower molars. It is difficult to ignore these most important data provoking an assumption of the replacement in hominines in the west of the continent and of the hetero-level assimilation in the Eastern province.
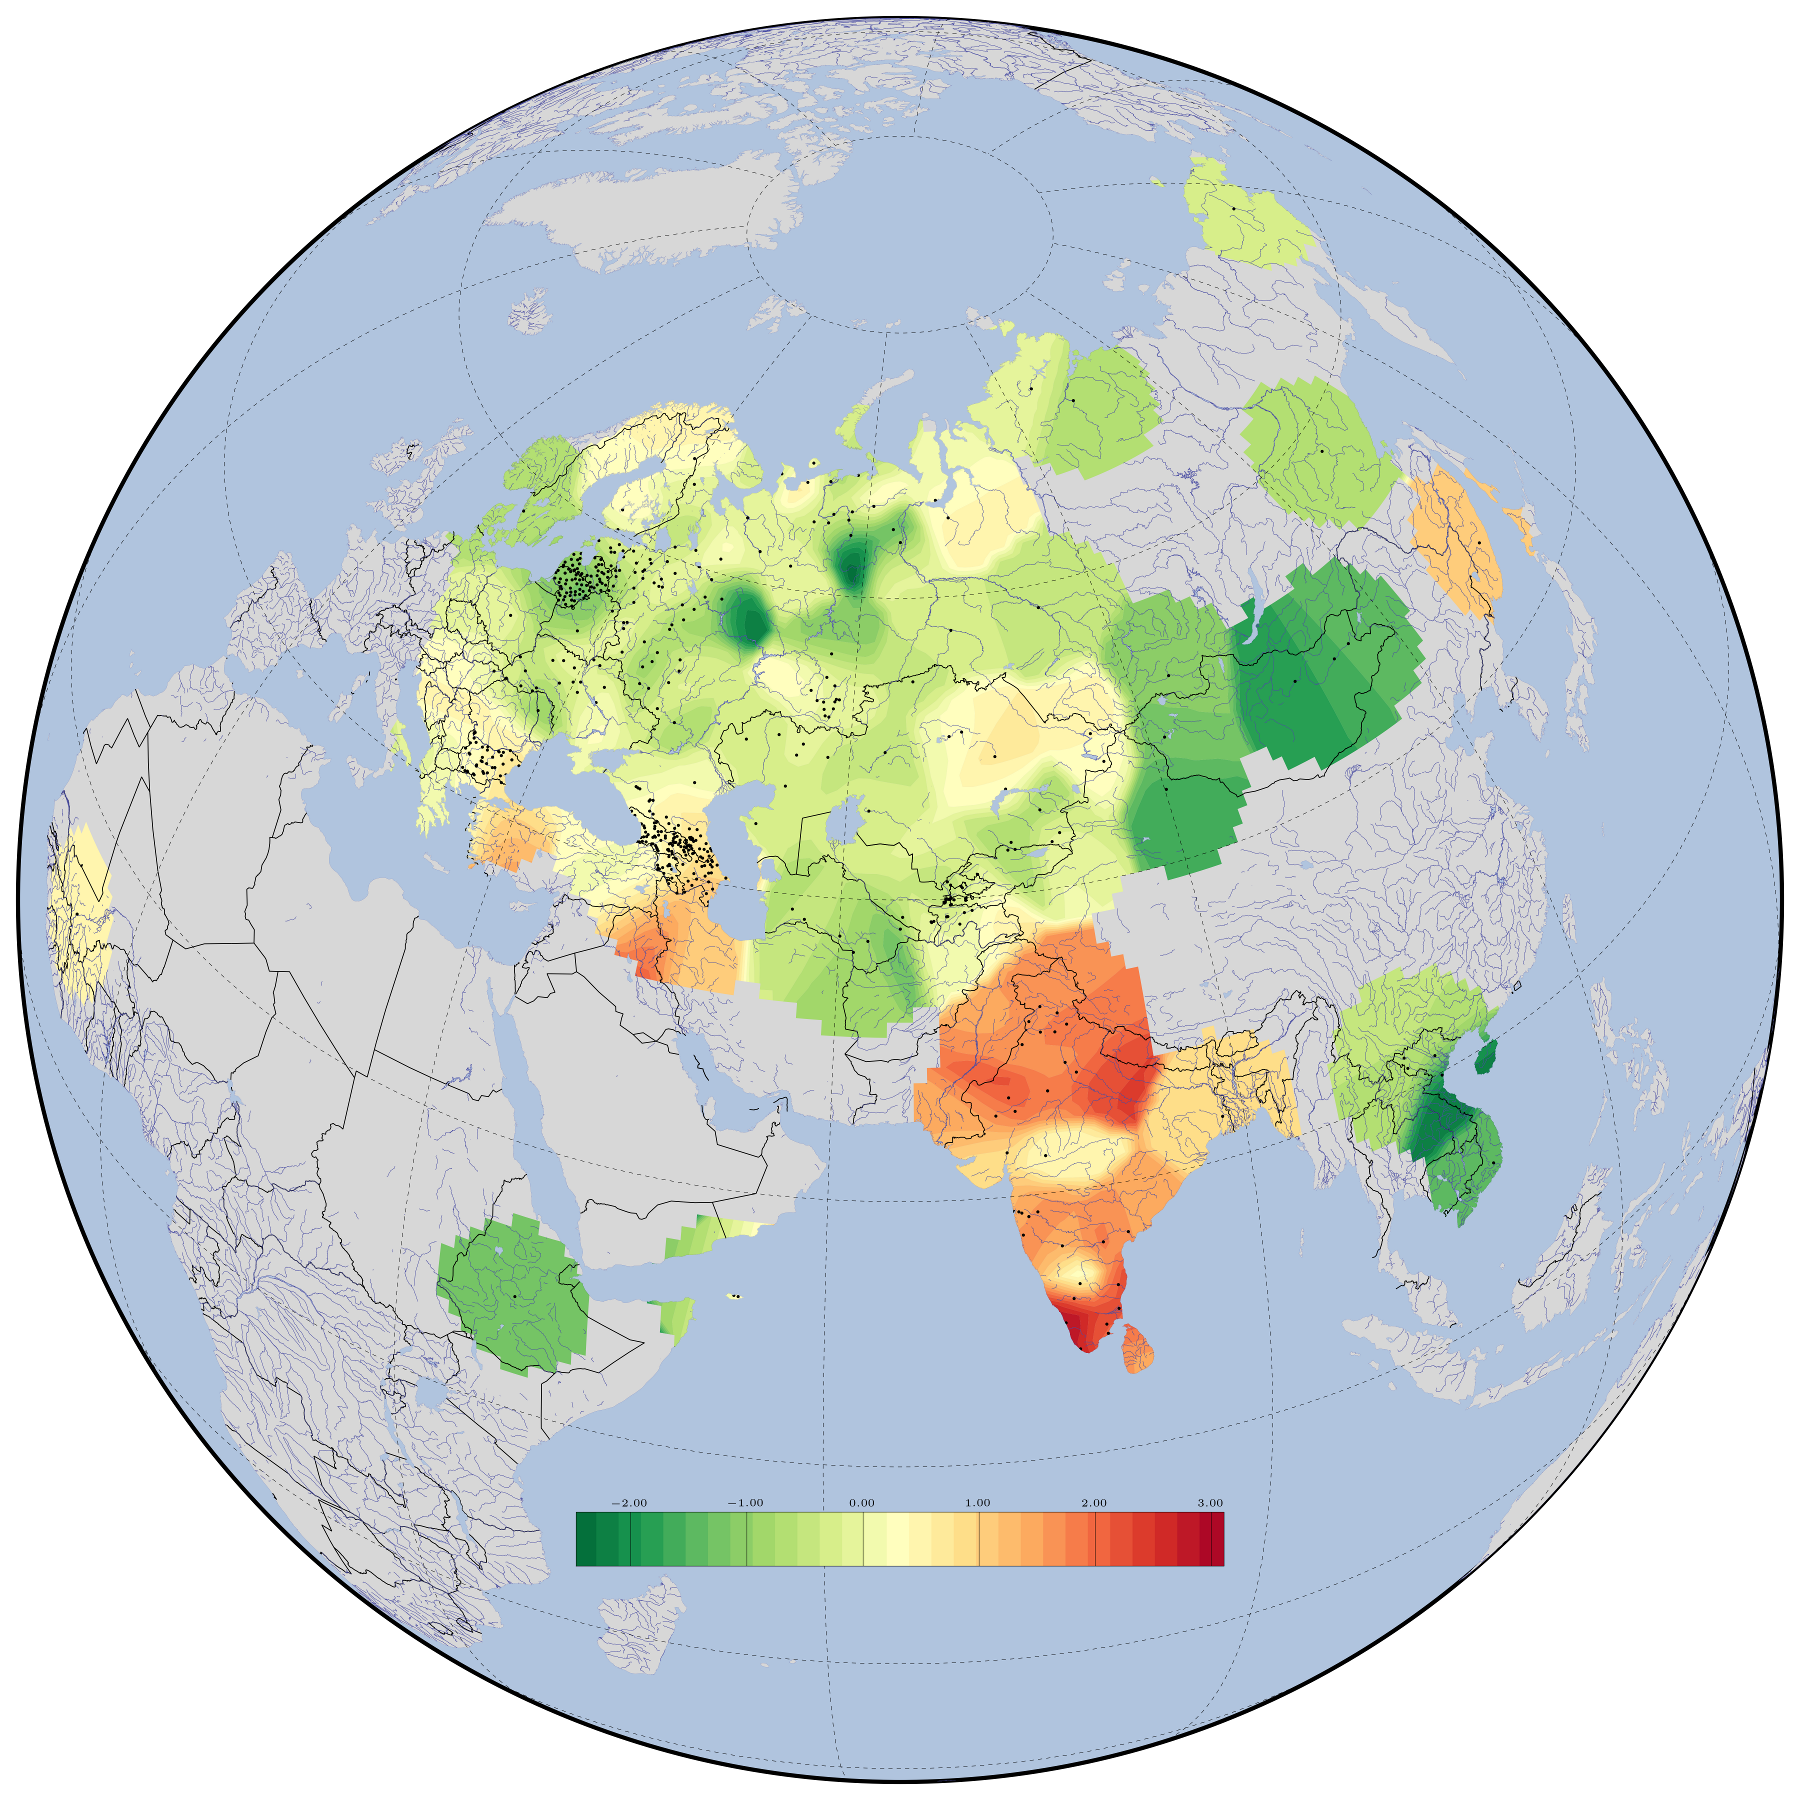
The 2nd PC explains 13 % of the total phenetic variation (fig. 2). The map shows more the latitudinal variability of phene pool in Eurasian populations. The scores of the PC are high in Dravidian and Munda groups of India, in other Indian and some Far East populations as well as in many populations in the south of West Asia and in the north of Europe and Siberia. In fact, the 2nd PC presents the paradox combination of eastern (the distal trigonid crest on the first lower molar) and western markers (four-cusped lower molars, precisely the first one). In our previous study on the Caucasian populations we suggested both southern and northern gracile subsets in West Eurasia had developed from one ancestral eastern group (Kashibadze, 2006). The pattern on the map supports this assumption. For the first time we find the traces of the initial group in the east province. We can envisage the movement of this ancient group from South Asia to the east and to the west, subsequent splitting the west flow into northern and southern subsets, probably as a result of populating postglacial continental space.
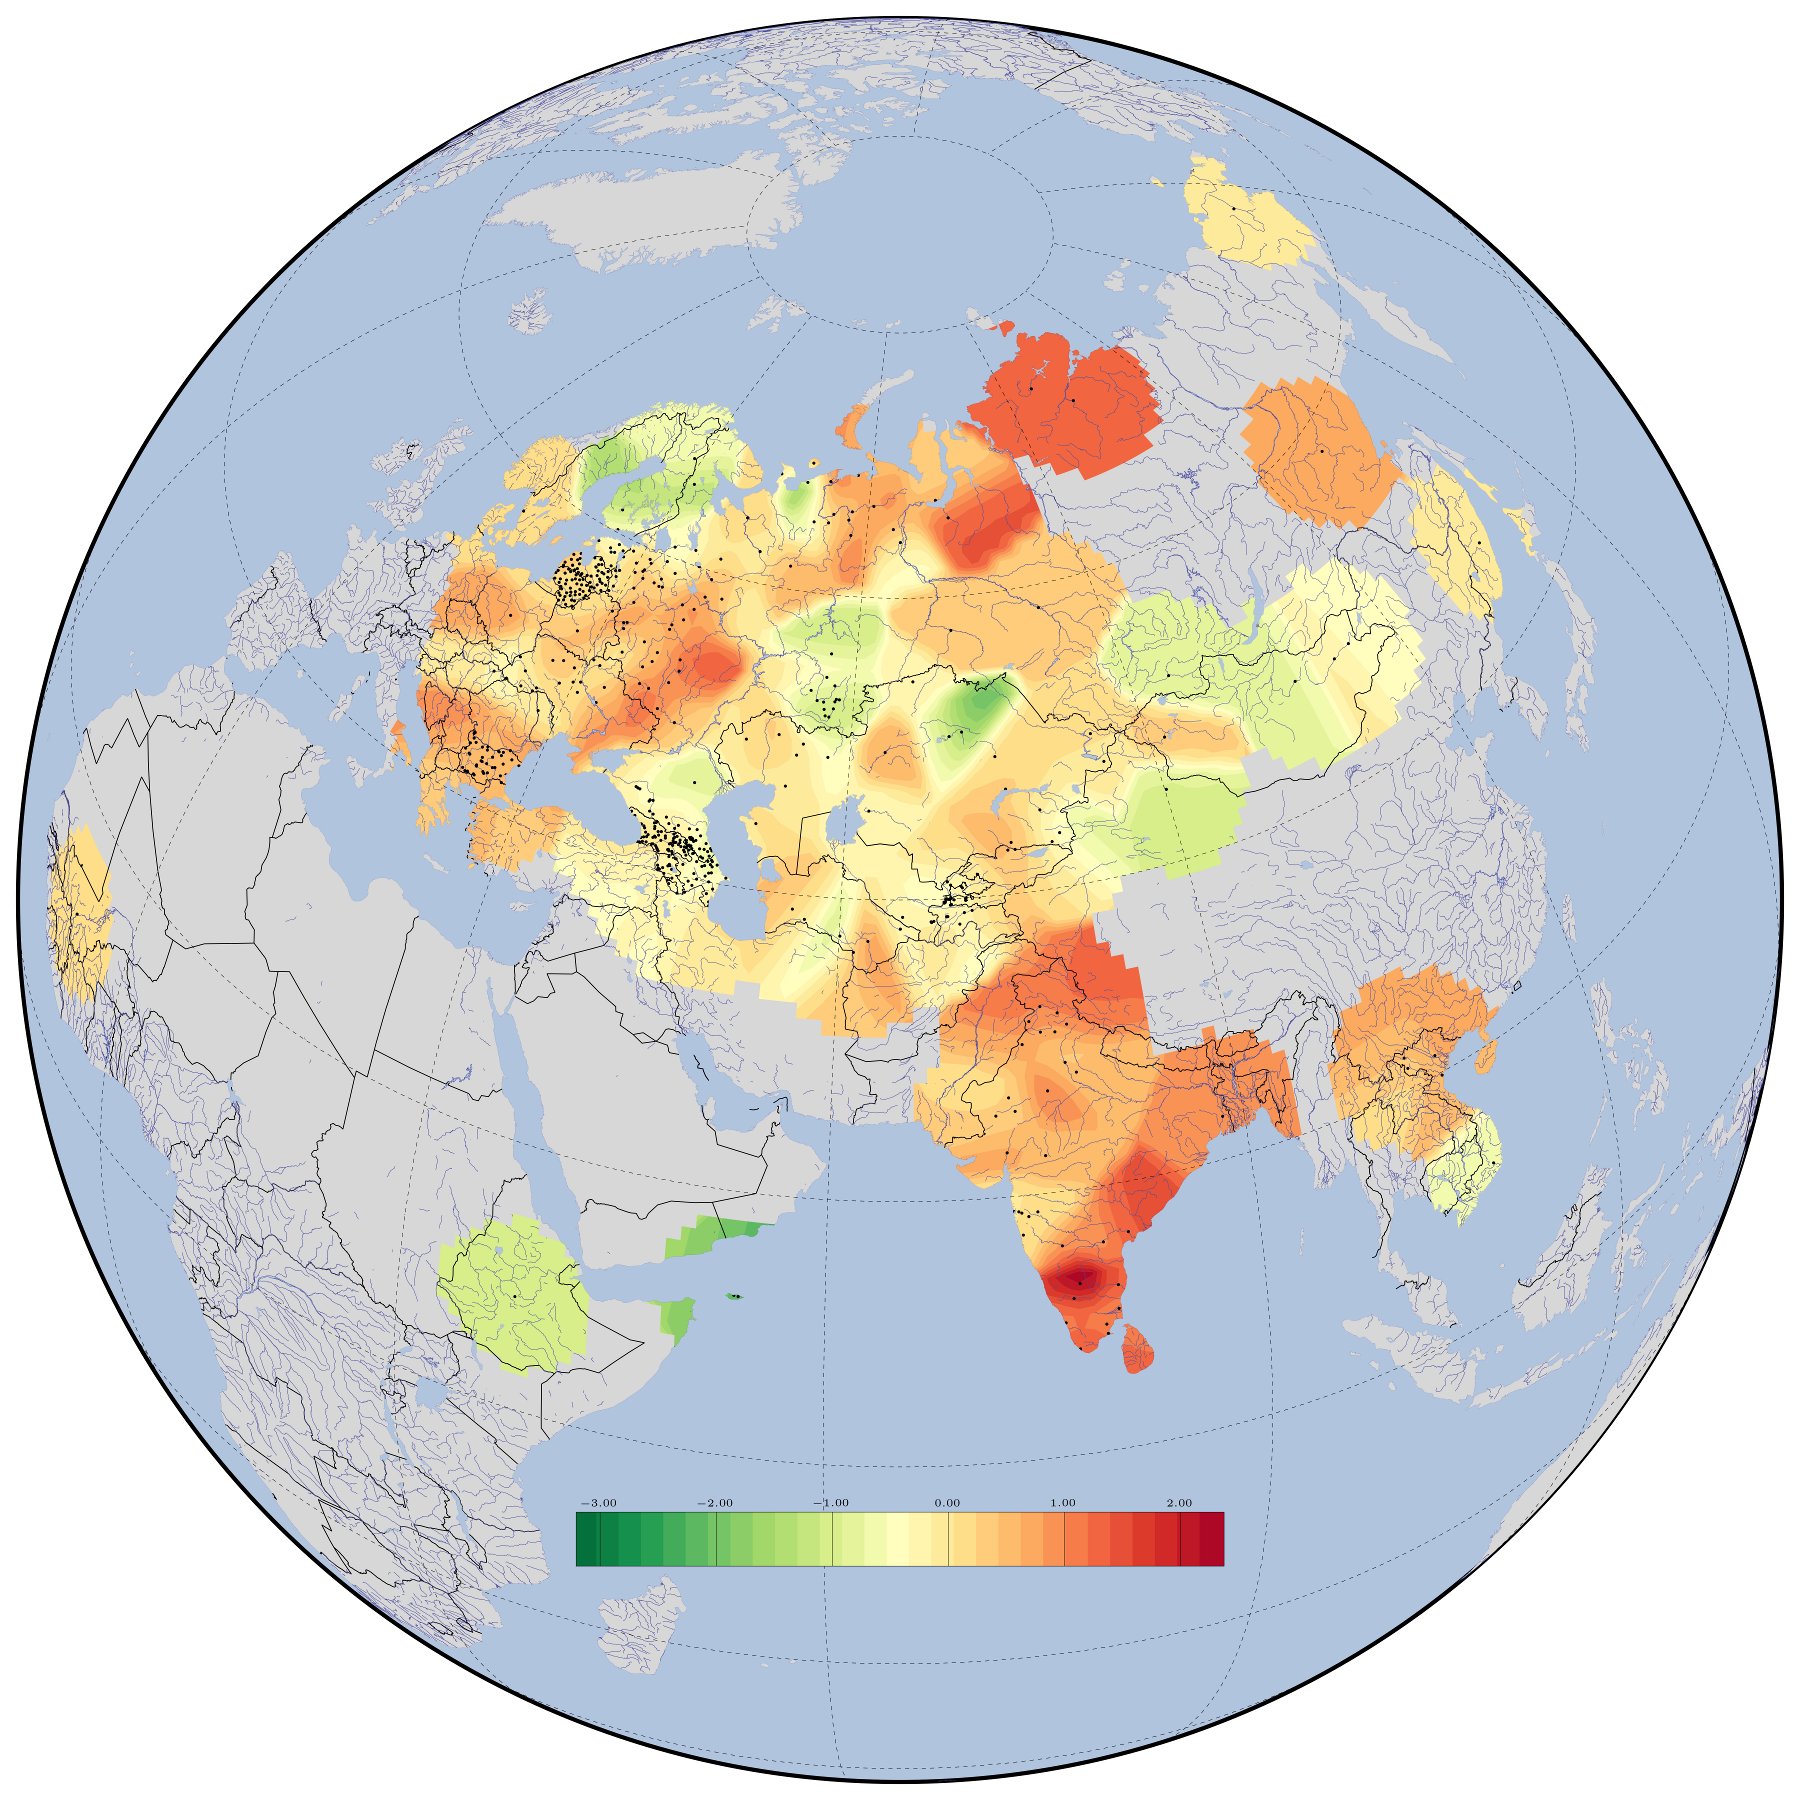
The 3rd PC explains 9 % of the total phenetic variation (fig. 3). High scores of the 3rd PC are determined by loadings mainly in western traits (Carabelli cusp and four-cusped lower first molars). We’ve revealed this combination for west living and fossil populations of the continent in our previous investigation of the Caucasus in the anthropohistorical space of Eurasia (Kashibadze, 2006).
The wide spread of this component through the whole continent seen in the map 3 was an absolutely unexpected and amazing phenomenon. It provides evidence for wide scale ancient populating the continent by a group or close groups mainly from west to east. Maybe this event could happen at different times and maybe repeatedly.
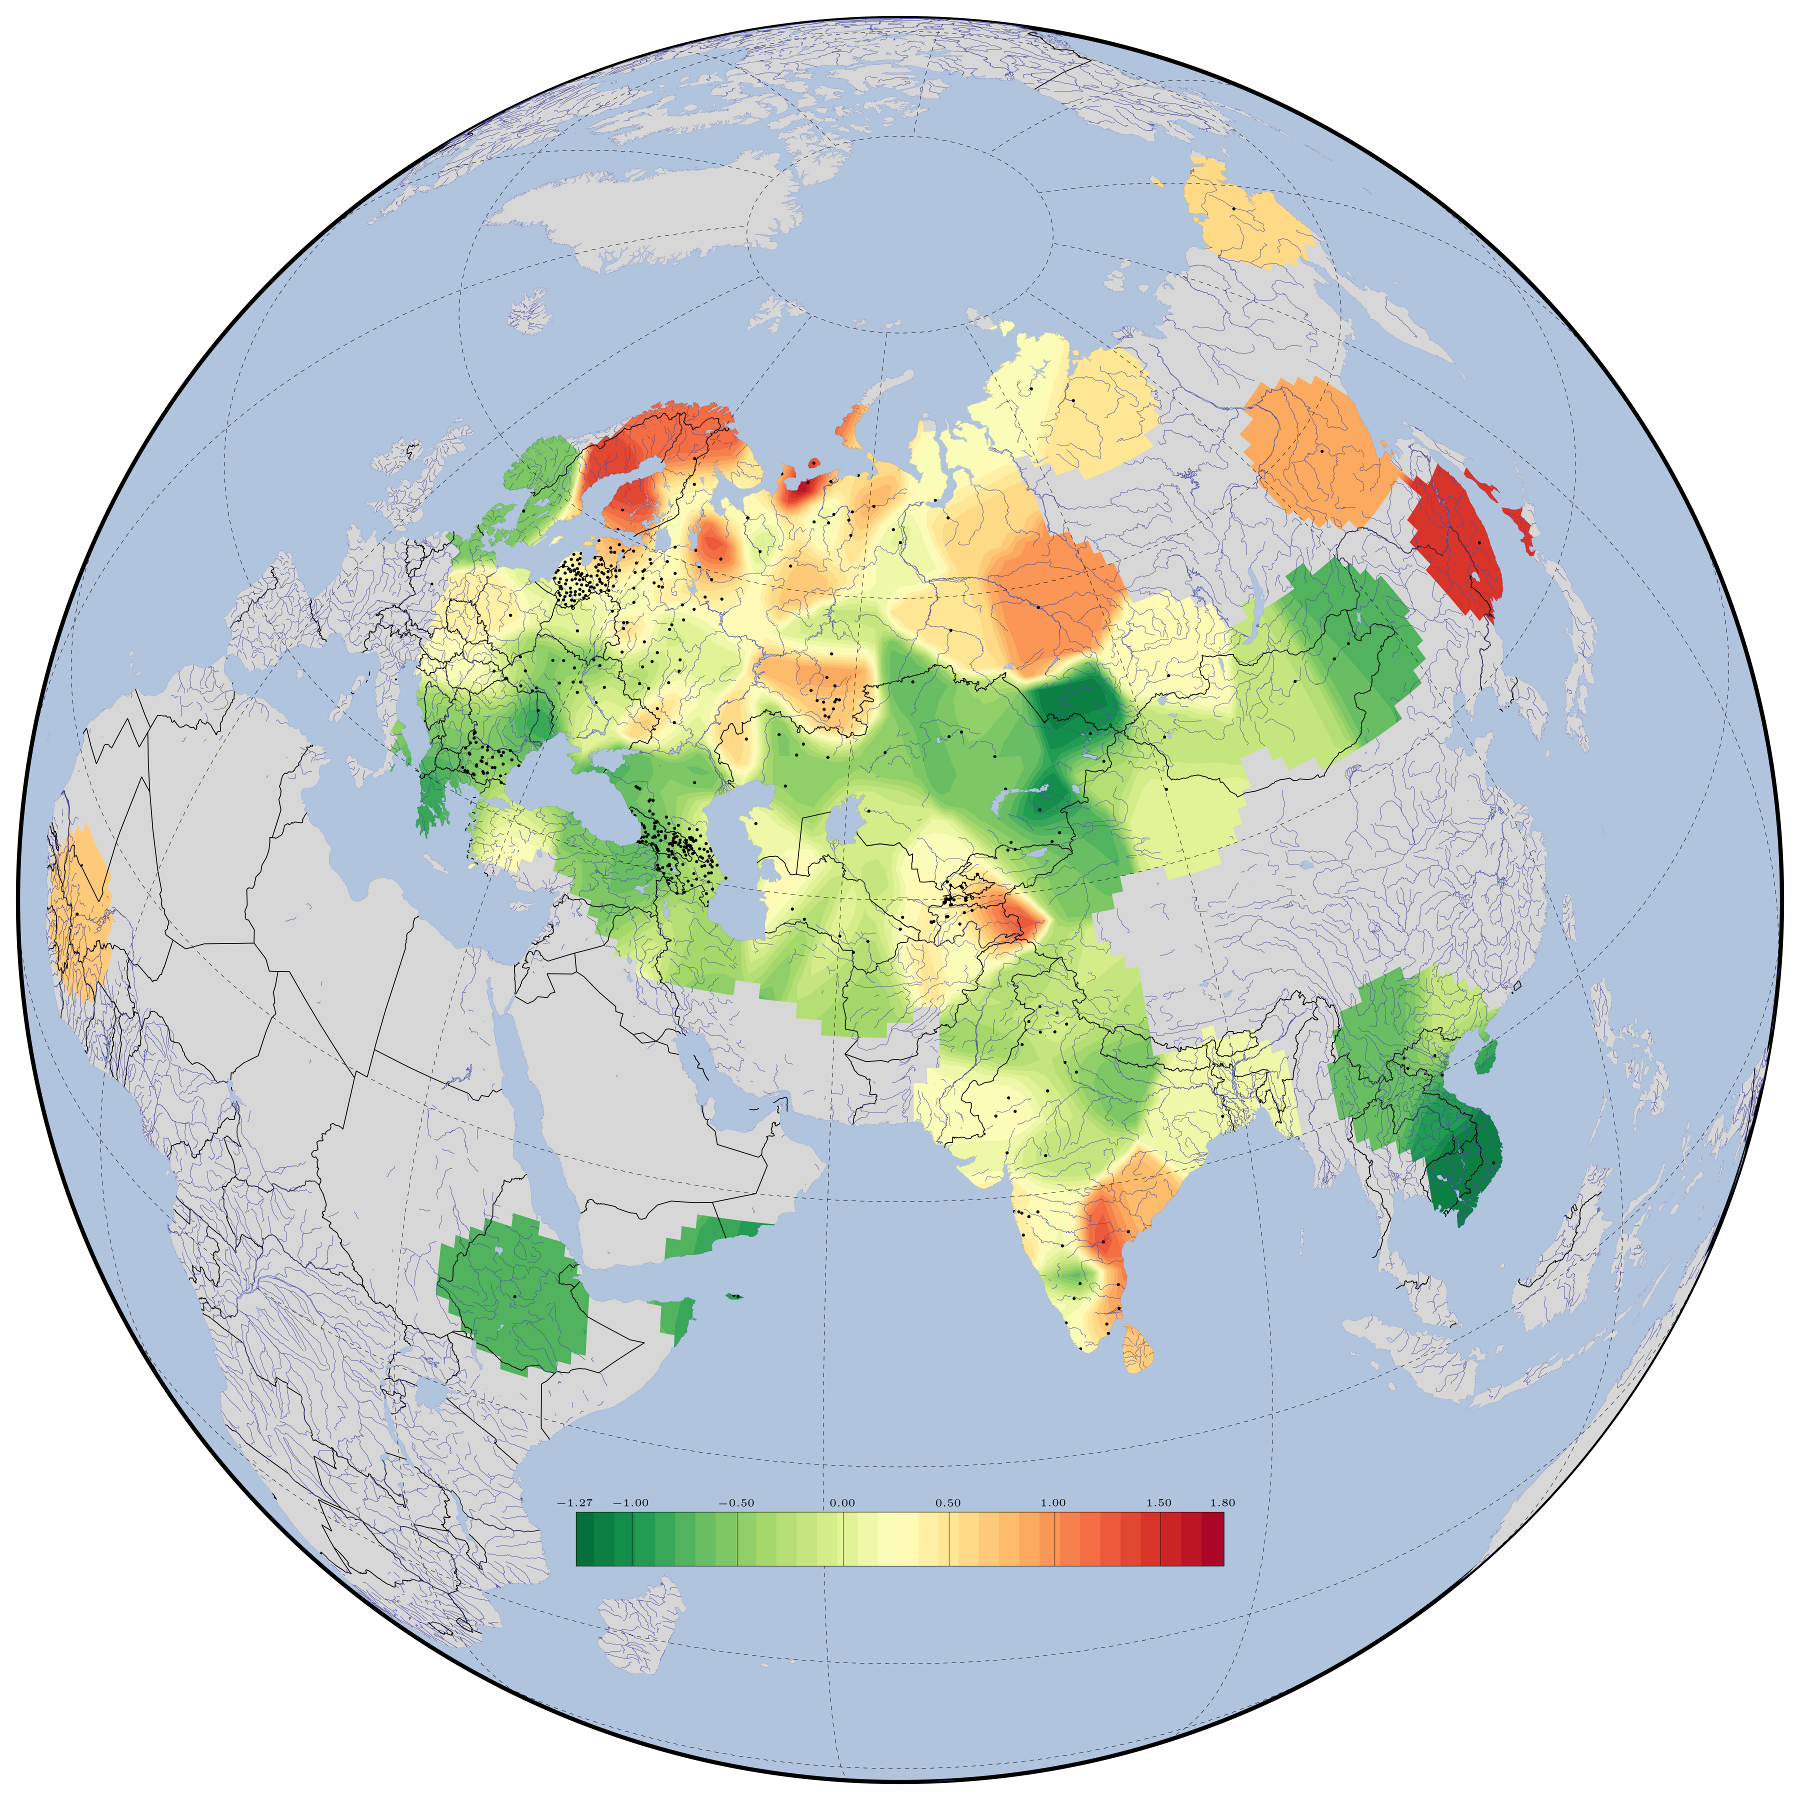
The 4th PC describes 7 % of the total phenetic variation. This PC presents again a combination of eastern and western traits (distal trigonid crest and Carabelli cusp), and it covers south regions of Eurasia. The revealed landscape more obviously divides the continent into southern and northern halves. The northern zone is occupied by another mixed combination (deflecting wrinkle and four-cusped first lower molars) common to Finn-Ugric populations (Zoubov, 1973; Zoubov & Khaldeeva, 1989). The map (fig. 4) again detects hidden patterns and more wide traces of this combination in southern, central and eastern areas of the continent. The highest scores of the last combination are found in some marginal coastline and in central mountain populations of Eurasia. The map traces the dispersal of a branch of this combination to the west via the Middle Urals and its subsequent irradiation in the European territory.
It must be emphasized that two of the four PCs are composed by combinations of western and eastern markers. Diminishing eastern traits frequencies at different grades in different groups of west continental populations (Kashibadze, 2006) and worldwide in shoveling (Mizoguchi, 1985) is a discovered phenomenon. So, we can suggest that ancestral polymorphic or assimilated populations should have even more expressed eastern component. Evolutionary factors, including genetic drift, selection and gene flows, may have altered the patterns of phenetic frequency and distribution in existing populations.
However, the time depths of the revealed landscapes are still not known exactly, so associating them with particular historic and demographic events seems to be speculative at the moment. To provide clear dating additional studies in integrating with established genetic, archaeological and linguistic evidence should be launched. Since dental markers provide the best possibility to examine directly time records in populations, an alternative perspective is in phenetic investigations of fossil Eurasian groups. East Europe and adjacent areas rich in fossil data seem to be the region to start with.
4 Conclusions
In spite of the enormous territory and the revealed divergence the populations of the continent have undergone wide scale and intensive time-space interaction. The maximal phenetic diversity was detected in India, respectively lesser in North Europe, West Siberia and Near East. Many details in the revealed landscape could be backgrounded to different historical events.
The maps visualize the most important results in analysis: the wide spread of the western combination through the whole continent till the Pacific coastline and the envision of the dispersal of the paradox combinations of eastern and western markers from South or Central Asia to the east and to the west. Taking into account that no additional eastern combinations in the total variation in Asian groups have been found but mixed or western markers’ sets and that eastern dental characteristics are traced in Asia since Homo erectus, the choice between the ancestral polymorphism and the hetero-level assimilation in the Eastern province is made in favour of the latter.
Acknowledgements
The study was supported by the Russian Foundation of Basic Research, grant 08-06-00124.
The authors are grateful to Prof. Elena Balanovska, Research Centre for Medical Genetics, Russian Academy of Medical Sciences, for the initial support of the idea of this research; and to Petr Voitsik, Astro Space Center, the Lebedev Physical Institute of the Russian Academy of Sciences, for his valuable aid in software development; and, last but not least, to the organizers and the participants of the 2010 meeting INQUA-SEQS for the inspiring communication.
References
- Kashibadze (2006) Kashibadze V. F., 2006. The Caucasus in the anthropohistorical space of Eurasia. Southern Scientific Centre, Russian Academy of Sciences Publishing House, Rostov-on-Don, Russia (in Russian, with English Summary).
- Keita (1977) Keita B., 1977. The anthropology of the Republic of Mali population. Ph.D. Thesis, Institute of Ethnology and Anthropology, Russian Academy of Sciences, Moscow, Russia (in Russian).
- Mizoguchi (1985) Mizoguchi Y., 1985. Shovelling: a statistical analysis of its morphology. University of Tokyo Press, Japan.
- Shinkarenko et al. (1984) Shinkarenko V. S., Naumkin V. V., Khit G. L., Zoubov A. A., 1984. The anthropological investigations on the Sokotra island. Sovetskaya Etnografia 4, 53-62 (in Russian).
- Zoubov (1968) Zoubov A. A., 1968. Odontology: methods in anthropological research. Nauka, Moscow (in Russian).
- Zoubov (1973) Zoubov A. A., 1973. Ethnical odontology. Nauka, Moscow (in Russian).
- Zoubov & Khaldeeva (1989) Zoubov A. A., Khaldeeva N. I., 1989. Odontology in current anthropology. Nauka, Moscow (in Russian).