THE OPTICAL GRAVITATIONAL LENSING EXPERIMENT:
ANALYSIS OF THE BULGE RR LYRAE POPULATION FROM THE OGLE-III DATA
Abstract
We have analyzed the data on 16,836 RR Lyrae (RR Lyr) variables observed toward the Galactic bulge during the third phase of the Optical Gravitational Lensing Experiment (OGLE-III), which took place in 2001–2009. Using these standard candles, we show that the ratio of total to selective extinction toward the bulge is given by and is independent of color. We demonstrate that the bulge RR Lyr stars form a metal-uniform population, slightly elongated in its inner part. The photometrically derived metallicity distribution is sharply peaked at , with a dispersion of 0.25 dex. In the inner regions (, ) the RR Lyr tend to follow the barred distribution of the bulge red clump giants. The distance to the Milky Way center inferred from the bulge RR Lyr is kpc. We report a break in the mean density distribution at a distance of kpc from the center indicating its likely flattening. Using the OGLE-III data, we assess that – type ab RR Lyr variables should be detected toward the bulge area of the on going near-IR VISTA Variables in the Via Lactea (VVV) survey, where the uncertainty partially results from the unknown RR Lyr spatial density distribution within kpc from the Galactic center.
Subject headings:
Galaxy: bulge – Galaxy: structure – stars: variables: other (RR Lyrae)1. INTRODUCTION
RR Lyrae (RR Lyr) variable stars are known as standard candles and useful tracers of old populations. They play an essential role in our understanding of the formation and evolution of the Galaxy. When multi-epoch light curves are available, RR Lyr variables can be easily identified. A large number of observations allows determination of their properties with high precision. The derived parameters can be used to determine interstellar extinction, metallicity, distance, and spatial distribution of the stars. RR Lyr stars observed toward the bulge provide an independent determination of the distance to the center of the Milky Way.
RR Lyr stars observed close to the central regions of the Milky Way concentrate toward the Galactic center was first noticed by van Gent (1932, 1933). Later, Baade (1946) found a strong predominance of RR Lyr variables toward a relatively unobscured area today called the Baade’s window, indicating the presence of Population II stars in the Milky Way center. By the early 1990s approximately 1000 RR Lyr variables inhomogeneously distributed toward the bulge were known.
The number of new bulge RR Lyr variables has increased following the advent of massive photometric surveys. Udalski et al. (1994, 1995a, 1995b, 1996, 1997) published a catalog of over 3000 periodic variable stars detected in the fields covered by the first phase of the Optical Gravitational Lensing Experiment (OGLE-I). Two-hundred and fifteen of these objects were classified as RR Lyr. Analysis of the OGLE-II data brought a much larger list of 2713 RR Lyr (Mizerski 2003). Later, using the same source of data, Collinge et al. (2006) prepared a catalog of 1888 fundamental mode RR Lyr stars (type RRab).
The MACHO microlensing project also observed a numerous sample of RR Lyr stars toward the Galactic center. Minniti et al. (1998), using a sample of 1150 RRab and 550 RRc stars, showed that the spatial distribution of RR Lyr between 0.3 and 3 kpc follows a power law with an inclination of . Alcock et al. (1998) examined the mean colors and magnitudes of 1800 RR Lyr and found that the bulk of the population is not barred. Only RR Lyr located toward the inner fields closer to the Galactic center (, ) seem to follow the barred distribution observed for red clump giants (RCGs) (Stanek et al. 1994). Recently, Kunder et al. (2008) analyzed photometric data on 3525 MACHO RRab stars to assess the reddening toward the Galactic bulge. They derived the selective extinction coefficient , which corresponds to the average value observed in the solar neighborhood (Cardelli et al. 1989; Fitzpatrick 1999).
The first metallicity measurements of bulge RR Lyr stars were made by Butler et al. (1976) using the method (Preston 1959). Using 9 stars in the 100 variable sample of Baade et al. (1963) list, they obtained dex and concluded that the stars are mildly metal-poor. Gratton et al. (1986) used a sample of 17 bulge RR Lyr variables and found a wide range of iron abundances, between and dex. Later, from spectra of 59 RRab and RRc variables, Walker & Terndrup (1991) determined an average metallicity of dex on the Zinn & West (1984) metallicity scale. In contrast to previous studies they found the metallicity distribution to be sharply peaked, with a dispersion of only 0.16 dex. The most recent metallicity estimate was performed by Kunder & Chaboyer (2008). Based on photometric data for 2,435 MACHO RRab stars they derived (on the Zinn & West 1984 scale), with a broad metallicity range from to dex.
The bulge RR Lyr stars have also often been used to measure the distance to the Galactic center, under the assumption that the center of their population corresponds to the center of the Milky Way. The first such measurement by Baade (1951) yielded kpc. For more than half a century, various investigations brought different values of with comparable uncertainty, e.g., Hartwick et al. (1972) obtained kpc, Oort & Plaut (1975) kpc, Blanco & Blanco (1985) kpc, Walker & Mack (1986) kpc, Fernley et al. (1987) kpc, Carney et al. (1995) kpc, Feast (1997) kpc, Collinge et al. (2006) kpc, Groenewegen et al. (2008) kpc, and recently Majaess (2010) kpc.
In this paper, using the newly released catalog (Soszyński et al. 2011) of nearly 17,000 RR Lyr stars detected toward the Galactic bulge during the third phase of the OGLE project (OGLE-III, Udalski 2003a; Udalski et al. 2008), we show that these variables constitute a uniform population, different to other populations residing in the central regions of our Galaxy.
The structure of this paper is as follows. Section 2 describes the selection of the sample and gives information on the reddening. Metallicities and magnitudes of the bulge RR Lyr variables are determined in Section 3. In Section 4, we estimate the distance to the Galactic center. The structure of the RR Lyr population, based on their mean brightness and density distribution, is studied in Section 5. Section 6 states our main conclusions.
2. THE DATA
2.1. Cleaning the Sample
Soszyński et al. (2011) published data on 11,756 RRab, 4989 RRc, and 91 RRd stars observed toward the Milky Way bulge. The mean -band magnitudes of the detected stars lie in the range . For the purpose of our work, the sample had to be cleaned from various contaminants. In the first step we rejected RR Lyr with amplitudes lower than 0.08 mag in , which are very likely blended objects. Figure 1 presents -band amplitude distributions for each of the three RR Lyr variable types. Based on the shape of the distributions for RRab and RRc stars we set the lower limit at an amplitude of 0.08 mag resulting in the rejection of 38 RRab, 17 RRc, and 0 RRd objects. We also removed the object OGLE-BLG-RRLYR-02792, which likely belongs to a binary system, and a RRab variable with a suspiciously large amplitude of 2.0 mag. The remaining amplitudes, of stars left in the sample, were no higher than 1.49 mag.

In the next step, we constructed versus diagrams to separate bulge RR Lyr stars from foreground and background objects. The diagrams for RRab, RRc, and RRd variables are shown in Figures 2–4, respectively. In all these figures one can see the effect of heavy reddening. Most of the background RR Lyr stars belong to the Sagittarius dwarf spheroidal (Sgr dSph) galaxy. This is well seen in the case of numerous and bright RRab stars which form a sequence in the lower part of Figure 2.


Finally, from the list of bulge RR Lyr stars we rejected 51 RRab and 23 RRc variables which are members or likely members of eight Galactic globular clusters (GCs; P. Pietrukowicz et al., in preparation).
2.2. Reddening
The selection returned 10,472 RRab, 4608 RRc, and 78 RRd bulge variables with measured mean - and -band magnitudes.111We note that all magnitudes published in the catalog of Soszyński et al. (2011) were calibrated to the standard Landolt (1992) photometric system using transformation formulae presented in Udalski et al. (2002) and an improved relation for stars with mag in Szymański et al. (2011). The corrected -band magnitudes are accurate to 0.01-0.02 mag for mag. For an additional 627 RRab, 151 RRc, and 2 RRd stars that are located close to the Galactic plane, we do not have information on -band brightness due to the heavy reddening in those directions. We used the information on the -band brightness and color to estimate the ratio of total to selective extinction , and to test whether it is independent of color or not. In Figures 5 and 6, respectively for RRab and RRc stars, we show unbinned and color-binned bulge RR Lyr stars in the versus diagram. The observed scatter of mag is due to intrinsic differences in the absolute brightness, differences in extinction along the line of sight to the RR Lyr star, the effect of the extent of the population along the line of sight, and the photometric uncertainty. We mark the limits in between which we fit a linear regression. Stars with high are very reddened and too faint to be observed. On the other side, there are very few mildly reddened bulge RR Lyr stars. We obtained the following relations for RRab and RRc stars, respectively:
| (1) |
| (2) |
From the fits we find a mean value of . We also find the difference in mean -band brightness between RRc and RRab stars to be mag. The obtained value of the ratio of total to selective extinction is in agreement with inferred from the OGLE-II data by Udalski (2003b).222A later determined value of 1.168 by Nataf et al. (2010) from brightness of OGLE-III red clump stars is slightly different, since they calibrated photometry for stars redder than mag using an older and slightly inaccurate formula. Our result indicates that interstellar extinction toward the bulge is indeed anomalous if compared with the standard value of derived from the all-sky maps of Schlegel et al. (1998).


2.3. Selection of the Subfields
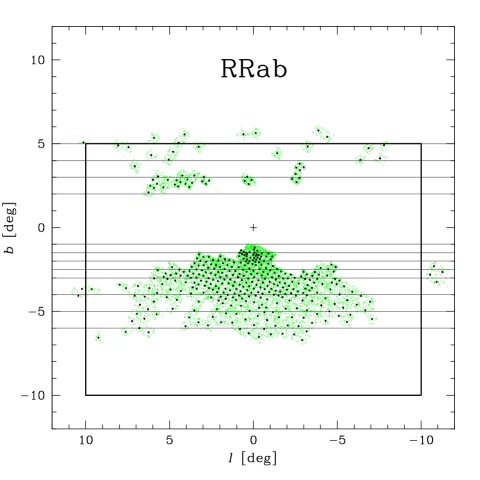
The field of view of the OGLE-III 8-chip camera was a square on a side. We used this area as a unit field in our analysis. To obtain good statistics of RR Lyr stars, we divided the unit field into four and further into sixteen square subfields, corresponding to two adjacent OGLE-III chips ( on a side) and half of a chip ( on a side), respectively. The lowest number of RR Lyr stars required per subfield we set at 10. If the number of stars was lower than 10, we counted stars in a larger subfield. Poorly populated unit fields (with less than 10 stars) were not taken into account in the analysis of metallicity and brightness distributions (Section 3). In Figure 7, we show a map of the bulge RRab stars in Galactic coordinates together with marked centers of selected subfields. The number of RRab subfields is 396 with 10–64 stars per subfield. In case of the RRc stars we selected 200 subfields, each containing 10–53 stars.
2.4. Completeness of the Sample
Completeness of the OGLE-III catalog of RR Lyr stars depends on many factors such as brightness of stars, their amplitude, shape of the light curve, crowding, and number of observing points. The search for periodic variability was run on -band light curves with more than 30 points for about stars with brightness down to mag. The light curves typically consist of 100–3000 measurements. In order to test and improve completeness of the catalog, Soszyński et al. (2011) carried out a cross-identification with published catalogs of RR Lyr stars based on MACHO (Kunder et al. 2008) and OGLE-II data (Collinge et al. 2006). Out of 2114 MACHO RRab stars they missed only 27 objects. Thirteen of them turned out to be located close to bright, saturated stars that were masked during reductions. The cross-match with 1888 OGLE-II RRab variables resulted in one missing object, a blended star. Based on the cross-identification, Soszyński et al. (2011) estimated the completeness of the bulge RRab variables at a level of about 99%.
In Figure 8, we compare the luminosity histograms for all detected OGLE-III RRab and RRc variables with the histograms for all stars detected stars toward three different Galactic latitude intervals. The OGLE photometry is complete down to mag and there are very few RR Lyr stars with mean magnitudes fainter than this brightness. This shows that the limiting magnitude weakly affects the total number of detected RR Lyr stars. The completeness, at least for bright RRab stars with characteristic high-amplitude saw-tooth-shaped light curves, is indeed very high. RRc stars, on the other hand, are on average fainter than RRab variables and have low-amplitude sinusoidal light curves that are very similar to the light curves of ellipsoidal binaries. Hence, pulsating stars of this type are more difficult to classify.

3. METALLICITY AND BRIGHTNESS OF THE BULGE RR LYRAE STARS
3.1. Metallicity
According to the idea of Kovács & Zsoldos (1995), the iron abundance of RRab stars can be derived from their light curve parameters. The method was further developed by Jurcsik & Kovács (1996) who presented a basic relation between the metallicity , pulsational period , and Fourier phase combination from -band light curves. We determine metallicities for 10,259 reliable bulge RRab variables using a relation suitable for -band light curves found by Smolec (2005) for sine decomposition:
| (3) |
The derived metallicities are on the Jurcsik (1995) scale (J95), which is based on high dispersion spectroscopic measurements. We used the uncertainty of to calculate the intrinsic metallicity uncertainty of each star. They range from 0.002 to 0.30 dex with a median value of 0.012 dex. This uncertainty quadratically added to given by Smolec (2005) results in a median total uncertainty of dex.
In Figure 9 we show the metallicity distribution for the bulge RRab stars, plotted as a histogram with a bin size of 0.05 dex. In the upper panel of this figure we plot, for comparison, a distribution of average RR Lyr metallicity for the 396 subfields which were analyzed. Both distributions are sharply peaked, which indicates that the bulge RR Lyr population was likely formed on a short timescale, as it is in the case of the Galactic halo and thick disk (Gratton et al. 1996). About 98.7% of the bulge RRab stars have metallicities between and 0.0 dex, with a peak at and a dispersion of 0.25 dex. These numbers are in very good agreement with results obtained by Kunder & Chaboyer (2008) from -band light curves of 2435 MACHO RRab variables. They found an average metallicity of and a dispersion of 0.30 dex on the Zinn & West (1984) metallicity scale which, according to the work of Papadakis et al. (2000), is less metal-rich by about 0.24 dex than the scale of Jurcsik (1995).
In the lower panel of Figure 9, we compare the bulge RRab metallicity-distribution function derived in this work with that of the 47 Galactic globular clusters (GCs) located within 3.0 kpc from the Galactic center333According to Clement et al. (2001) and the updated Catalogue of Variable Stars in Galactic Globular Clusters (2011) by C. Clement (http://www.astro.utoronto.ca/cclement/read.html) the 47 bulge GCs contain 325 known RR Lyr stars considered to be members of the clusters. Around two-thirds of those variables (exactly 217 stars) belong to the globular cluster M62. There are no known RR Lyr stars in 31 of the selected bulge GCs. (based on 2010 version of Harris 1996 catalog) and that of a sample of 403 bulge red giants (RGs) published by Zoccali et al. (2008). The metallicities of the GCs and RGs were converted from the Carretta et al. (2009) scale (C09) to the one of Jurcsik (1995) via the Zinn & West (1984) metallicity scale (ZW84) using a relation from Papadakis et al. (2000):
| (4) |
and a second relation from Carretta et al. (2009):
| (5) |
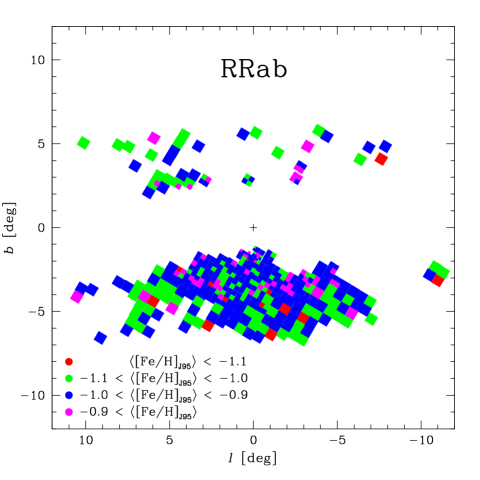
The metallicity distributions of the bulge RGs, RR Lyr stars, and GCs differ significantly from each other. The very peaked and symmetric distribution for the RRab stars indicates that the population of the bulge RR Lyr variables is very metal uniform. In Figure 10 we show a color-coded map of metallicity averaged in each of the 396 subfields. The metallicity of RR Lyr stars seems to be fairly uniformly distributed over the whole investigated area.

3.2. Dereddened Mean Brightness
We calculate dereddened mean magnitudes for each RR Lyr star as:
| (6) |
where the extinction is given by
| (7) |
with reddening given by
| (8) |
We compute the intrinsic color for RRab stars as
| (9) |
where the absolute brightnesses and come from theoretical calibrations in Catelan et al. (2004)
| (10) |
| (11) |
with the following conversion between and :
| (12) |
The conversion is based on a solar metallicity of , as required to match the metal-to-hydrogen ratio of Grevesse & Noels (1993). Intrinsic colors of RRc stars are between 0.32 and 0.42 mag (based on models in Feuchtinger 1999). Since the metallicites of this type of RR Lyr variables are not determined, we use the mean value of mag for each RRc star.
In the above calculation, we adopt an uncertainty of the mean -band brightness at a level of mag (Udalski et al. 2008). The OGLE-III -band light curves are less well sampled and the adopted accuracy of the mean -band brightness is mag. The errors propagate to a range of –0.20 mag for the sample of 10,259 RRab stars with a median value of 0.09 mag.
4. DISTANCE TO THE GALACTIC CENTER
We estimate the position of the Galactic center by measuring the mean distance to the bulge RR Lyr variables. The distances to individual bulge RRab star are estimated using the relation:
| (13) |
To obtain the real distance to the center of the population we have to apply the following two geometric corrections. First, we have to project all the individual distances onto the Galactic plane by taking the cosine of the Galactic latitude, yielding . Second, we have to take into account the “cone-effect” — our subfields subtend solid angles on the sky with more volume further away — by scaling their distance distribution by . A corrected and normalized distance distribution for the 10,259 RRab stars is presented in Figure 11. The symmetry of this distribution further confirms the high completeness of the RR Lyr catalog of Soszyński et al. (2011). The slightly flat peak in the distribution between 8.2 and 8.8 kpc is consistent with the presence of an elongated inner structure (see Section 5). The distance distribution is very well represented by a Lorentzian with a maximum value at kpc. A resulting distance to the Milky Way center of kpc is obtained by quadratically adding the median uncertainty in the distance to the individual stars of 0.418 kpc. This result is in good agreement with the weighted average of kpc determined from eleven different measuring methods by Genzel et al. (2010).

5. STRUCTURE OF THE BULGE RR LYRAE POPULATION
5.1. Brightness Distribution
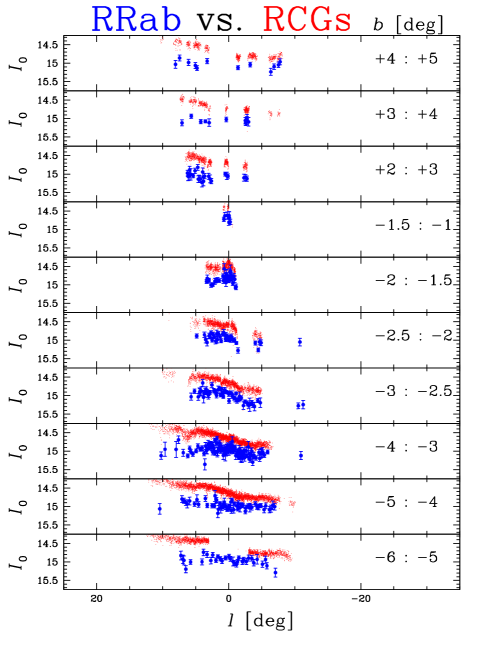
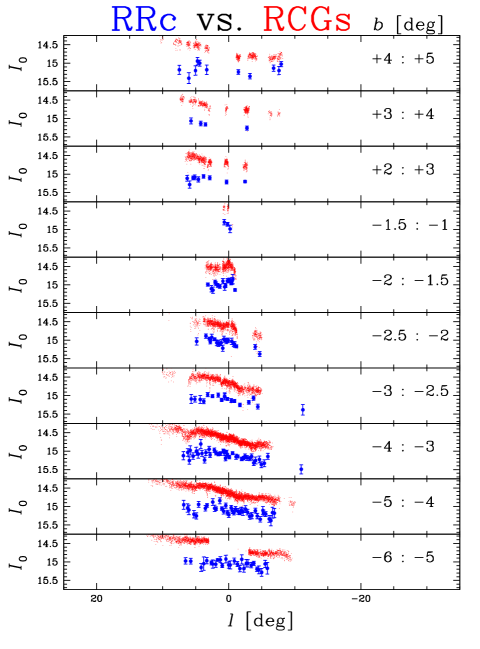
In this section, we study the structure of the bulge RR Lyr population using their mean dereddened magnitudes at different Galactic latitudes. We selected 10 latitudinal stripes, they are or wide. Their location is illustrated in Figure 7. Figure 12 shows magnitudes averaged in subfields for RRab stars in comparison to the mean brightnesses of RCGs from D. M. Nataf et al. (2012, in preparation). A typical uncertainty in the dereddened brightness of the RCGs is 0.20 mag. Results for RRc stars are shown in Figure 13. Bulge RR Lyr stars follow the barred RCGs distribution in the inner part of the bulge at and . This is well seen in the better-covered southern part (see Figure 14). Farther off the Galactic plane at latitudes the distribution of RR Lyr variables is clearly flat, indicating that their population becomes more spherical with increasing distance from the center.
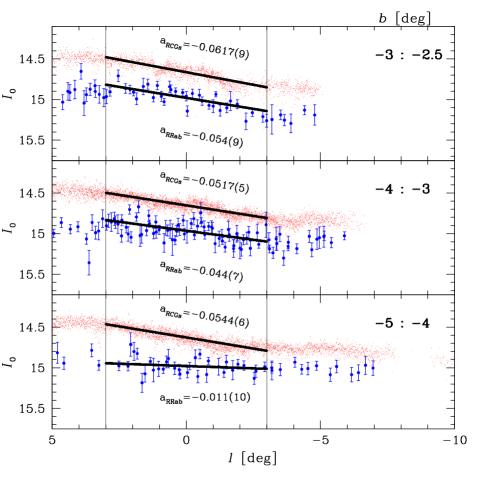
In Figure 15, we investigate if there are any differences in dereddened magnitudes between metal-rich () and metal-poor () RRab stars. For each latitudinal stripe we fit a weighted linear regression to the data. All derived mean values are positive, as expected from Equation (11), that metal-poor stars are on average brighter than metal-rich ones. All values are around mag, indicating no significant differences in metallicity distribution along the line of sight of the bulge RR Lyr population for different Galactic latitudes. Moreover, there seems to be no significant trends in with Galactic longitude. These results corroborate the metal-uniform nature of the bulge RR Lyr population.

5.2. The Inner Part
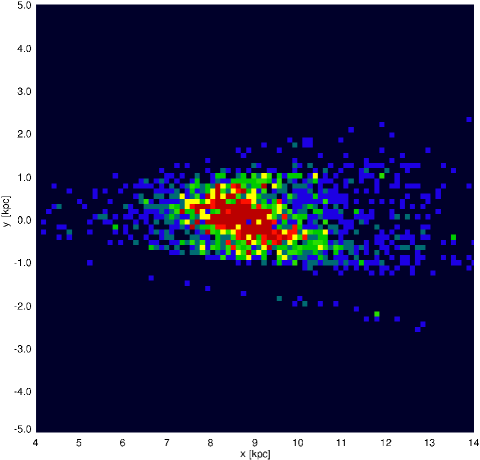
The OGLE-III - and -band data cover Galactic latitudes higher than and lower than . Using RRab variables with derived individual distances, we can make an attempt to study the shape and orientation of the observed part of the inner bulge. Figure 16 shows four projections of the variables onto the Galactic plane. Two of those projections, and , include complete data for stars with Galactic longitudes . Figure 17 illustrates the projection for as a color–density map. The presence of the elongated structure for the RR Lyr located closer to the Galactic plane is evident. Farther off the plane the structure gets round, as is expected from the flat mean magnitude distribution presented in Figures 12–14. Based on the density map in Figure 17, we find the inclination of the RR Lyr structure major axis to be about with respect to the line of sight between the sun and the Galactic center. This angle is very similar to the inclination of – derived for the main RCGs bar by Rattenbury et al. (2007). However, we stress that the accurate estimation of the inclination of the RR Lyr spatial distribution is hampered due to small number statistics and incomplete coverage of the central part of the bulge. Near-IR data from the on going VISTA Variables in the Via Lactea (VVV) survey (Minniti et al. 2010) should bring the final answer to the question on the structure and shape of the inner bulge RR Lyr population.

5.3. Search for Split in Brightness of the RR Lyr Stars
Recently, Nataf et al. (2010) used OGLE-III photometry to find that the Galactic bulge red clump is split into two components toward the fields at (, and . The split is also reported by Gonzalez et al. (2011) who analyzed the first data from the VVV survey (Saito et al. 2012). The observed difference in -band brightness between the components is approximately 0.5 mag. We selected OGLE fields located at for which the number of detected bulge RRab stars was at least 20. Figure 18 presents luminosity histograms for the investigated fields. The adopted size of the bins, 0.25 mag, is wider than the typical brightness uncertainty of mag. The number of bulge RR Lyr variables is insufficient to conclude if such a split is present in this type of stars or not. Some histograms display double peaks, but this can be explained by small number statistics.

5.4. Density Distribution
We analyzed the mean spatial distribution of the bulge RR Lyr as a function of distance from the Milky Way center by counting the stars in square subfields that are on a side. Separate results for the whole sample (consisting of all RR Lyr pulsators), RRab, and RRc subsamples are presented in three panels of Figure 19. The data cover angular distances between and from the center, however, the innermost subfields are incomplete due to high reddening, while the outermost ones suffer from small number statistics. We found a break in both distributions at . For all detected RR Lyr variables in the inner part between and we obtained the following fit:
| (14) |
where is in degrees and in counts deg-2. The outer part for is represented by a steeper line with
| (15) |
In the case of RRc stars we found, respectively,
| (16) |
and:
| (17) |
Finally, for RRab stars we have
| (18) |
and
| (19) |
This would correspond to a spherical distribution with
and
assuming the distance to the Galactic center of kpc given in Section 4.
The distribution of RR Lyr stars in the central part ( kpc) remains unknown. We may speculate that it probably gets more flat toward the center. The answer may come from -band observations currently collected by the VVV survey (Minniti et al. 2010). Using the OGLE-III data, we are able to assess the number of RR Lyr stars which should be detected within the VVV bulge area (marked in Figure 7). If we extrapolate the inner distribution toward the center, we find that VVV should detect RRab stars. With a flat distribution in the central part we obtain stars. For RR Lyr variables of all types the numbers are the following: and . In summary, if we assume that the OGLE-III catalog of RRab variables is 99% complete, we can estimate the VVV survey should detect – RR Lyr stars of this type.

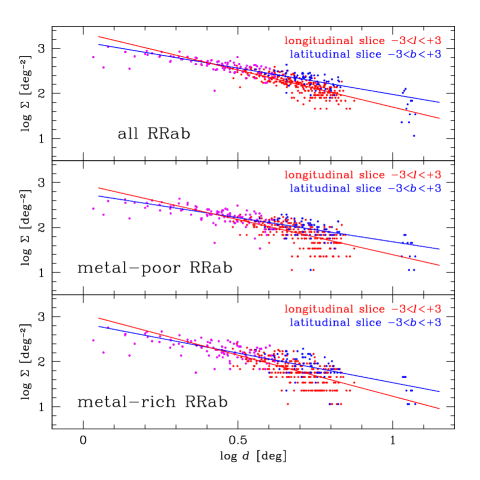
In Figure 20 we draw density distributions of bulge RRab variables in longitudinal and latitudinal slices, each with width of , to verify if there are any significant differences between metal-poor () and metal-rich () stars. No differences are found in the linear fits, leading us to the earlier conclusion that the RR Lyr bulge population is metal uniform. The observed slope of the latitudinal distributions is always shallower than the longitudinal one, confirming earlier suggestions of Minniti et al. (1998) that the whole population is slightly flattened along Galactic longitude. Based on the longitudinal and latitudinal fits obtained we find a mean density of at distances () and (), respectively. From this we can derive that the RR Lyr surface distribution is flattened in the observed outer part, with . Complete data from the near-IR VVV survey will allow to study the distribution in the very central part of the bulge and to determine final parameters for the bulge RR Lyr population.
6. CONCLUSIONS
We have analyzed the data on 16,836 RR Lyr stars observed toward the Galactic bulge during the third phase of the OGLE project (years 2001–2009). After eliminating low-amplitude stars, objects likely foreground and background sources, and GC members the sample includes 10,472 RRab, 4608 RRc, and 78 RRd bulge variables with derived mean - and -band brightness. For an additional 627 RRab, 151 RRc, and 2 RRd stars, all located close to the Galactic plane, we possess mean magnitudes in the filter alone.
Using color information for this type of standard candles, we find that the ratio of total to selective extinction is independent of color and equals . This result confirms the anomalous nature of the extinction toward the bulge.
Our analysis clearly demonstrates that the bulge RR Lyr stars constitute a very uniform population, different to the majority of the stars in the central regions of the Milky Way. The photometrically derived metallicity distribution is sharply peaked at with a dispersion of 0.25 dex on Jurcsik (1995) metallicity scale. Based on the distribution of dereddened brightness we show that the RR Lyr population is elongated in the inner part, where it tends to follow the barred distribution of the bulge RCGs. The elongated structure can also be noticed as a flat peak in the distance distribution. A possible explanation of this structure along the bar is that less populated old RR Lyr stars may feel gravitational forces from young stars in the Milky Way bulge. Farther off the Galactic plane (for ) the shape of RR Lyr population becomes spherical. We note that, due to small number statistics, we can not conclude the presence of a split in the population of bulge RR Lyr stars, as is observed in RCGs.
The distance to the Milky Way center inferred from the OGLE-III bulge RRab variables is kpc. This result is in agreement with kpc obtained from the OGLE-II data (Majaess 2010) and with a value of kpc combined by Genzel et al. (2010) from 11 different methods. It seems that the RR Lyr method suffers from uncertainties in the metallicity determination, and hence absolute brightness of the stars.
In our work, we have also studied the density distribution of the bulge RR Lyr stars as a function of distance from the Galactic center. We found a break in the distribution at a distance of kpc indicating flattening toward the center. Taking into account completeness of the OGLE-III data, we estimate the number of RRab stars which should be detected within the bulge area of the near-IR VVV survey as – stars. The uncertainty partially results from unknown density distribution within kpc from the center.
On going and future wide-field photometric surveys, such as OGLE-IV, VVV, Pan-STARRS (Kaiser et al. 2002), and Large Synoptic Survey Telescope (Ivezić et al. 2008) should bring definitive answers to questions pertaining to the structure and evolution of all Galactic RR Lyr populations. For example, one of unsolved issues is whether the bulge and halo RR Lyr variables form the same population. Minniti et al. (1998) suggested that the bulge RR Lyr stars could represent the inner extension of the Galactic halo. The bulge pulsators do not show the Oosterhoff (1939) dichotomy observed in the halo variables. From the period distribution and period–amplitude diagram presented in Soszyński et al. (2011) it seems that probably all bulge RR Lyr stars belong to the Oosterhoff type I (OoI). Our work shows that the bulge population is very metal uniform and was likely formed on a short time scale. The Galactic halo was probably formed by at least two distinct accretion processes (Miceli et al. 2008). About 25% of the halo RR Lyr variables observed at distances 3–30 kpc appear to be Oosterhoff type II (OoII) stars with a significantly different radial density profile to the remaining 75% of OoI objects. The OoI halo population has a power-law exponent of while the OoII component has a steeper slope with (Miceli et al. 2008). The OoI stars are on average slightly more metal-rich ( dex) than the OoII stars ( dex; Sesar et al. 2010). Comparison of the above numbers for the halo RR Lyr variables with those for the bulge objects obtained in this work does not allow us to answer the question on the common bulge/halo population. More data, in particular on RR Lyr stars residing in the central and outer regions of our Galaxy, are needed.
References
- Alcock et al. (1998) Alcock, C., Allsman, R. A., Alves, D. R., et al. 1998, ApJ, 492, 190
- Baade (1946) Baade, W. 1946, PASP, 58, 249
- Baade (1951) Baade, W. 1951, Pub. Obs. Univ. Mich., 10, 7
- Baade et al. (1963) Baade, W., Payne-Gaposchkin, C., & Irwin, J. B. 1963, Science, 140, 658
- Blanco & Blanco (1985) Blanco, V. M., & Blanco, B. M. 1985, Mem. Soc. Astron. Ital., 56, 15
- Butler et al. (1976) Butler, D., Carbon, D., & Kraft, R. 1976, ApJ, 210, 120
- Cardelli et al. (1989) Cardelli, J. A., Clayton, G. C., & Mathis, J. S. 1989, ApJ, 345, 245
- Carney et al. (1995) Carney, B. W., Fulbright, J. P., Terndrup, D. M., Suntzeff, N. B., & Walker, A. R. 1995, AJ, 110, 1674
- Carretta et al. (2009) Carretta, E., Bragaglia, A., Gratton, R., D’Orazi, V., & Lucatello, S. 2009, A&A, 508, 695
- Catelan et al. (2004) Catelan, M., Pritzl, B. J., & Smith, H. A., 2004, ApJS, 154, 633
- Clement et al. (2001) Clement, C. M., Muzzin, A., Dufton, Q., et al. 2001, AJ, 122, 2587
- Collinge et al. (2006) Collinge, M. J., Sumi, T., & Fabrycky, D. 2006, ApJ, 651, 197
- Feast (1997) Feast, M. W. 1997, MNRAS, 284, 761
- Fernley et al. (1987) Fernley, J. A., Jameson, R. F., Longmore, A. J., Watson, F. G., & Wesselink, T. 1987, MNRAS, 226, 927
- Feuchtinger (1999) Feuchtinger, M. U. 1999, A&A, 351, 103
- Fitzpatrick (1999) Fitzpatrick, E. L. 1999, PASP, 111, 63
- Genzel et al. (2010) Genzel, R., Eisenhauer, F., & Gillessen, S. 2010, Rev. Mod. Phys., 82, 3121
- Gonzalez et al. (2011) Gonzalez, O. A., Rejkuba, M., Zoccali, M., Valenti, E., & Minniti, D. 2011, A&A, 534, A3
- Gratton et al. (1996) Gratton, R., Carretta, E., Matteucci, F., & Sneden, C. 1996, in ASP Conf. Ser. 92, Formation of the Galactic Halo—Inside and Out, ed. H. Morrison & A. Sarajedini (San Francisco, CA: ASP), 307
- Gratton et al. (1986) Gratton, R. G., Tornambè, A., & Ortolani, S. 1986, A&A, 169, 111
- Grevesse & Noels (1993) Grevesse, N., & Noels, A. 1993, in Origin and Evolution of the Elements, ed. N. Pratzo, E. Vangioni-Flam, & M. Casse (Cambridge: Cambridge Univ. Press), 15
- Groenewegen et al. (2008) Groenewegen, M. A. T., Udalski, A., & Bono G. 2008, A&A, 481, 441
- Harris (1996) Harris, W. E. 1996, AJ, 112, 1487
- Hartwick et al. (1972) Hartwick, F. D. A., Hesser, J. E., & Hill, G. 1972, ApJ, 174, 573
- Ivezić et al. (2008) Ivezić, Ž., Sesar, B., Jurić, M., et al. 2008, ApJ, 684, 287
- Jurcsik (1995) Jurcsik, J. 1995, Acta Astron., 45, 653
- Jurcsik & Kovács (1996) Jurcsik, J., & Kovács, G. 1996, A&A, 312, 111
- Kaiser et al. (2002) Kaiser, N., Aussel, H., Burke, B. E., et al. 2002, Proc. SPIE, 4836, 154
- Kovács & Zsoldos (1995) Kovács, G., & Zsoldos, E. 1995 A&A, 293, L57
- Kunder & Chaboyer (2008) Kunder, A., & Chaboyer, B. 2008, AJ, 136, 2441
- Kunder et al. (2008) Kunder, A., Popowski, P., Cook, K. H., & Chaboyer, B. 2008, AJ, 135, 631
- Landolt (1992) Landolt, A. U. 1992, AJ, 104, 372
- Majaess (2010) Majaess, D. 2010, Acta Astron., 60, 55
- Miceli et al. (2008) Miceli, A., Rest, A., Stubbs, C. W., et al. 2008, ApJ, 678, 865
- Minniti et al. (1998) Minniti, D., Alcock, C., Alves, D., et al. 1998, in IAU Symp. 184, The Central Regions of the Galaxy and Galaxies, ed. Y. Sofue (Cambridge: Cambridge Univ. Press), 123
- Minniti et al. (2010) Minniti, D., Lucas, P. W., Emerson, J. P., et al. 2010, New Astron., 15, 433
- Mizerski (2003) Mizerski, T. 2003, Acta Astron., 53, 307
- Nataf et al. (2010) Nataf, D. M., Udalski, A., Gould, A., Fouqué, P., & Stanek, K. Z. 2010, ApJ, 721, L28
- Oort & Plaut (1975) Oort, J. H., & Plaut, L. 1975 A&A, 41, 71
- Oosterhoff (1939) Oosterhoff, P. T. 1939, Observatory, 62, 104
- Papadakis et al. (2000) Papadakis, I., Hatzidimitriou, D., Croke, B. F. W., & Papamasto-rakis, I. 2000, AJ, 119, 851
- Preston (1959) Preston, G. W. 1959, ApJ, 130, 507
- Rattenbury et al. (2007) Rattenbury, N. J., Mao, S., Sumi, T., & Smith, M. C. 2007, MNRAS, 378, 1064
- Saito et al. (2012) Saito, R. K., Hempel, M., Minniti, D., et al. 2012, A&A, 537, A107
- Sesar et al. (2010) Sesar, B., Ivezić, Ž., Grammer, S. H., et al. 2010, ApJ, 708, 717
- Schlegel et al. (1998) Schlegel, D. J., Finkbeiner, D. P. & Davis, M. 1998, ApJ, 500, 525
- Smolec (2005) Smolec, 2005, Acta Astron., 55, 59
- Soszyński et al. (2011) Soszyński, I., Dziembowski, W. A., Udalski, A., et al. 2011, Acta Astron., 61, 1
- Stanek et al. (1994) Stanek, K. Z., Mateo, M., Udalski, A., et al. 1994, ApJ, 429, L73
- Szymański et al. (2011) Szymański, M. K., Udalski, A., Soszyński, I., Kubiak, M., Pietrzyński, G., Poleski, R., Wyrzykowski, Ł., Ulaczyk, K., 2011, Acta Astron., 61, 83
- Udalski (2003a) Udalski, A. 2003a, Acta Astron., 53, 291
- Udalski (2003b) Udalski, A. 2003b, ApJ, 590, 284
- Udalski et al. (1994) Udalski, A., Kubiak, M., Szymański, M., et al. 1994, Acta Astron., 44, 317
- Udalski et al. (1995a) Udalski, A., Kubiak, M., Szymański, M., et al. 1995a, Acta Astron., 45, 1
- Udalski et al. (1995b) Udalski, A., Olech, A., Szymański, M., et al. 1995b, Acta Astron., 45, 433
- Udalski et al. (1996) Udalski, A., Olech, A., Szymański, M., et al. 1996, Acta Astron., 46, 51
- Udalski et al. (1997) Udalski, A., Olech, A., Szymański, M., et al. 1997, Acta Astron., 47, 1
- Udalski et al. (2002) Udalski, A., Szymański, M., Kubiak, M., et al. 2002, Acta Astron., 52, 217
- Udalski et al. (2008) Udalski, A., Szymański, M. K., Soszyński, I., & Poleski, R. 2008, Acta Astron., 58, 69
- van Gent (1932) van Gent, H. 1932, Bull. Astron. Inst. Neth., 6, 163
- van Gent (1933) van Gent, H. 1933, Bull. Astron. Inst. Neth., 7, 21
- Walker & Mack (1986) Walker, A., & Mack, P. 1986, MNRAS, 220, 69
- Walker & Terndrup (1991) Walker, A., & Terndrup, D. M. 1991, ApJ, 378, 119
- Zinn & West (1984) Zinn, R., & West, M. J. 1984, ApJS, 55, 45
- Zoccali et al. (2008) Zoccali, M., Hill, V., Lecureur, A., et al. 2008, A&A, 486, 177