Local elasticity of strained DNA studied by all-atom simulations
Abstract
Genomic DNA is constantly subjected to various mechanical stresses arising from its biological functions and cell packaging. If the local mechanical properties of DNA change under torsional and tensional stress, the activity of DNA-modifying proteins and transcription factors can be affected and regulated allosterically. To check this possibility, appropriate steady forces and torques were applied in the course of all-atom molecular dynamics simulations of DNA with AT- and GC-alternating sequences. It is found that the stretching rigidity grows with tension as well as twisting. The torsional rigidity is not affected by stretching, but it varies with twisting very strongly, and differently for the two sequences. Surprisingly, for AT-alternating DNA it passes through a minimum with the average twist close to the experimental value in solution. For this fragment, but not for the GC-alternating sequence, the bending rigidity noticeably changes with both twisting and stretching. The results have important biological implications and shed light upon earlier experimental observations.
pacs:
87.14.gk 87.15.H- 87.15.ap 87.15.akIntroduction
Internal mechanical stress is ubiquitous in the biologically active state of double helical DNA. In eucaryotic cells, DNA is densely packed in chromosomes and forced to bend, twist and stretch by numerous protein factors involved in genome regulation Bloomfield et al. (2000); Cozzarelli et al. (2006). In procaryotes, DNA is subjected to a constitutive unwinding torque maintained by special enzymes, which leads to supercoiling, as in a long rope with bending and twisting elasticity Wang (1996, 2002). The supercoiling and, more generally, stress-induced DNA forms are key factors in a variety of cellular processes Vologodskii and Cozzarelli (1994). For instance, the degree of supercoiling in bacteria changes systematically during the cell cycle and in response to environmental conditions, which is accompanied by activation or suppression of certain genes Travers and Muskhelishvili (2005). The promoter sensitivity to supercoiling stems from the recognition of short promoter elements by RNA polymerase Borowiec and Gralla (1987). Detailed studies indicate that it probably does not require DNA melting nor transitions to alternative forms Travers and Muskhelishvili (2005). In E. coli, relaxation of the superhelical stress simultaneously alters the activity of 306 genes (7% of the genome), with 106 genes activated and others deactivated Peter et al. (2004). The genes concerned are functionally diverse and widely dispersed throughout the chromosome, and the effect is dose-dependent.
The physical mechanisms of such effects are understood only partially. Long DNA is well described by the coarse-grained worm-like chain (WLC) model Landau and Lifshitz (1976); Cantor and Schimmel (1980) supplemented with harmonic twisting and stretching elasticity Bustamante et al. (1994); Vologodskii (1994); Vologodskii and Marko (1997); Wang et al. (1997); Moroz and Nelson (1997); Bouchiat et al. (1999). This model nicely explains the stress-modulated probability of looping, wrapping around proteins, and juxtaposition of distant protein binding sites Vologodskii et al. (1992). However, it cannot account for the promoter sensitivity to supercoiling, for instance, because in this and many other cases the gene regulation has a strong local character and is dominated by sequence effects. A long-discussed hypothesis is that the stress may act as an allosteric factor in protein-DNA recognition Wells et al. (1977); Bauer (1978). The supercoiling arguably changes the local properties of DNA, as there are small proteins with single short binding sites that can distinguish stressed and relaxed DNA forms Balandina et al. (2002); however, it is never clear what exactly is recognized. The supercoiling torque is distributed between twisting and writhing so that the untwisting of the double helix is estimated as 1-2% Boles et al. (1990), which is below the thermal noise and too small for reliable recognition. Alternatively, the action of the torsional stress may be conveyed through a property other than the structure of the double helix. For instance, the untwisting may change the elastic parameters of DNA Song et al. (1990); Selvin et al. (1992); Naimushin et al. (1994). The supercoiled DNA is governed by the interplay between the local bending and twisting fluctuations. If the bending flexibility or the torsional stiffness vary, parameters of thermal fluctuations of short DNA stretches involved in recognition could be noticeably affected even at low levels of stress.
The foregoing hypothesis implies that even with small deformations the DNA elasticity is not exactly harmonic. This possibility was earlier considered in relation to specific experiments and also to explain the discrepancies in twisting rigidity of DNA evaluated by different methods Song et al. (1990); Selvin et al. (1992); Naimushin et al. (1994); Fujimoto et al. (2006). Notably, it was suggested that the stretching forces applied in single molecule measurements and the bending involved in DNA cyclization can increase the apparent twisting rigidity of DNA Fujimoto et al. (2006). The DNA double helix tends to overwind with small stretching Gore et al. (2006); Lionnet et al. (2006), but it is not clear if bending and/or stretching affect the twisting elasticity. The mechanical coupling between deformations of different types may be very important for regulation. However, the most interesting for biology is not the overall elasticity, but the behavior of short specific sequences within polymer DNA. To the present, all experimental studies have probed only the average properties of long DNA, with a few reports on sequence effects Fujimoto and Schurr (1990); Geggier and Vologodskii (2010) and the influence of supercoiling stress Song et al. (1990); Selvin et al. (1992); Naimushin et al. (1994). For the free relaxed double helix a good convergence of the results of different experiments is obtained for the bending rigidity Hagerman (1988); Geggier and Vologodskii (2010). The torsional rigidity has been measured by multiple different techniques, but the results remain controversial Fujimoto et al. (2006). Also, a few estimates of the stretching stiffness have been obtained from nanomechanics experiments with single DNA molecules Smith et al. (1996); Wang et al. (1997); Wenner et al. (2002).
Although the local sequence-dependent DNA elasticity and possible stress effects are difficult to reveal experimentally, they can be probed by computer simulations. All-atom molecular dynamics (MD) simulations is a powerful instrument particularly suitable for this purpose. Continuous improvement of forcefields Cornell et al. (1995); MacKerell et al. (1995); Perez et al. (2007a) and simulation techniques Darden et al. (1993); Essmann et al. (1995) have now made possible free MD simulations that reproduce conformational ensembles of DNA in good agreement with experimental data Cheatham and Kollman (2000); Perez et al. (2007b). Calculated statistics of fluctuations in short DNA qualitatively agree with the WLC theory Mazur (2006, 2007), and the values of the elastic parameters can be measured with good accuracy Mazur (2008, 2009a). DNA deformation is a classical subject of molecular mechanics Zhurkin et al. (1979). In several earlier investigations, all-atom MD simulations were used for studying deformed DNA states obtained by external stretching MacKerell and Lee (1999); Harris et al. (2005); Luan and Aksimentiev (2008), twisting Kannan et al. (2006); Wereszczynski and Andricioaei (2006); Randall et al. (2009), or bending Curuksu et al. (2008). The required deformations were produced by either potential restraints or periodical boundary constraints. A promising alternative method Mazur (2009b) applies steady forces and torques to short stretches of DNA. In contrast to the earlier approaches, this method makes it possible to evaluate elastic parameters under different types and magnitudes of external stress corresponding to physiological conditions. This method captures linear elastic responses as well as the twist-stretch coupling effect under small torques corresponding to a physiological degree of supercoiling Mazur (2009b). With such approaches it has been found that, depending upon the base pair sequence, small twisting torques corresponding to physiological superhelical density can significantly change the torsional stiffness of the DNA double helix Mazur (2010).
In this article we present the results of the first systematic study of the influence of external mechanical stress upon the local stretching, twisting, and bending elasticity of the double helical DNA. The numerical algorithms described and tested in the recent reports Mazur (2009b, 2010) could be drastically accelerated through parallelization, which made such computations more affordable. Two double helical fragments were considered, with AT- and GC-alternating sequences, respectively. We found that the apparent stretching rigidity of DNA strongly depends upon the method used for measuring the molecule length. When it is obtained by summing base-pair steps as in earlier studies Lankas et al. (2000); Mazur (2006, 2009a) the sign of the twist-stretch coupling effect appears opposite to that measured experimentally. In contrast, much better agreement with experimental data is obtained when the length is measured directly via the end-to-end distance of one helical turn. We argue that only the latter value corresponds to the experimental observable. The change in the stretching rigidity of DNA with external stress is qualitatively similar for the two sequences. It grows with stretching as well as with increased twisting. The torsional rigidity is essentially unaffected by stretching, but it varies with twisting very strongly, and differently for the two sequences. Surprisingly, for the AT-alternating sequence, it passes through a minimum with the average twist close to the experimental value in solution. For this fragment, but not for the GC-alternating sequence, the bending rigidity noticeably changes with both twisting and stretching. The results shed light upon the earlier experimental observations Song et al. (1990); Selvin et al. (1992); Naimushin et al. (1994) and have important implications for the possible mechanisms of allosteric gene regulation Borowiec and Gralla (1987); Peter et al. (2004); Chow et al. (1991).
Methods
Simulation protocols
Tetradecamer DNA fragments were modeled with AT-alternating and GC-alternating sequences. A dodecamer fragment is necessary for a full helical turn of a random-sequence B-DNA. The length of 14 base pairs (bp) is minimal for modelling of a helical turn within a longer DNA. This choice of the fragment length and sequences is consistent with and dictated by the results of the earlier studies Mazur (2008, 2009a). Steady stress loads were applied as described elsewhere Mazur (2009b). This method distributes forces over selected groups of atoms and compensates them by reactions applied to other atoms so as to zero the total external force and torque. Because the forces are applied at different points internal stress and deformations are introduced that correspond to overall twisting or stretching. The method was thoroughly verified in Brownian dynamics simulations of calibrated discrete WLC models Mazur (2009b).
The ranges of forces and torques are selected to comprise the values used in single molecule manipulation experiments as well as the corresponding estimates for living cells. It is known that B-DNA becomes unstable in vitro with stretching forces beyond 50 pN Smith et al. (1996); Cluzel et al. (1996). The covalent bonds in long DNA are broken already with forces beyond 300 pN Bustamante et al. (2000), and in living cells DNA is often fragmented during replication in so-called fragile sites Letessier et al. (2011). A stretching load of a few tens of piconewtons can be exerted by a single molecule of RNA polymerase during transcription Yin et al. (1995); Wang et al. (1998), and forces in the nN range pull the chromatids during cell division Nicklas (1983). The range of torques that do not destroy B-DNA in single molecule experiments is from -10 to +35 pNnm Bryant et al. (2003). The lower limit is close to the estimated torsional stress due to natural negative supercoiling in procaryotes. These data concern the integral stability of long random sequence DNA. Short stretches of B-DNA can tolerate much stronger torsional strain. For instance, the DNA twisting observed in complexes with some bacteriophage repressors Koudelka et al. (2006) corresponds to torques beyond 100 pNnm.
The classical MD simulations were carried out by running independent trajectories in parallel on different processors for identical conditions. The number of processors varied between 32 and 48. Trajectories with the lowest loads started from the final states of free dynamics. The amplitudes of forces and torques were increased gradually so that simulations with higher values started from the final states obtained under the preceding lower values. The initial 0.5 ns of every sub-trajectory were discarded, which was sufficient for re-equilibration.
The AMBER98 forcefield parameters Cornell et al. (1995); Cheatham et al. (1999) were used with the rigid TIP3P water model Jorgensen et al. (1983). The electrostatic interactions were treated by the SPME method Essmann et al. (1995). To increase the time step, MD simulations were carried out by the internal coordinate method (ICMD) Mazur (1997, 1999), with the internal DNA mobility limited to essential degrees of freedom. The rotation of water molecules and DNA groups including only hydrogen atoms were slowed down by weighting of the corresponding inertia tensors Mazur (1998a, b). The double-helical DNA was modeled with all backbone torsions, free bond angles in the sugar rings, and rigid bases and phosphate groups. The effect of these constraints is insignificant, as was previously checked through comparisons with standard Cartesian dynamics Mazur (1998a, 2006). The time step was 0.01 ps and the DNA structures were saved every 5 ps. All trajectories were continued to obtain the sampling corresponding to 164 ns of continuous dynamics, that is 215 points for every value of force (torque).
Additional technical details including preparation of initial states, treatment of rare events, evaluation of statistical errors, and others are described elsewhere Not .
Evaluation of elastic parameters
The DNA elasticity is conveniently characterized by three persistence lengths (PLs) corresponding to bending, twisting and stretching that we denote here as , , and , respectively. These parameters can be extracted from simulated canonical conformational ensembles by using the WLC theory that provides linear relationships of the following form
| (1) |
where is the DNA length and stands for , , or . The WLC deviations are computed from appropriate canonical averages as
| (2) | |||||
where and are the angles of bending and twisting, respectively. The angular brackets denote the canonical averaging and D with square brackets refer to the variance of the variable in the brackets. The sampled conformations of the double helix were analyzed by the program 3DNA Lu and Olson (2003). Because the elastic parameters should be preferably estimated by using integral numbers of helical turns Mazur (2009a), only 11 central base pair steps (bps) were considered (central dodecamers referred to as TA6 and CG6, respectively). In the following text, symbols , , and denote the corresponding parameters of one helical turn.
According to the standard convention Olson et al. (2001), every base pair is characterized by a local Cartesian frame, with the xy-plane parallel to the base pair and z-vectors directed along the DNA. The bend angle is measured between the z-vectors constructed at the opposite ends of a helical turn. Earlier it was shown that this measure of bending is adequate for integral numbers of helical turns Mazur (2009a). The torsional fluctuations were probed by three alternative methods. The end-to-end twist, , was evaluated similarly to the local twist Lu et al. (1997), but using the two terminal reference frames. The cumulated local twist is obtained by summing the local twist at all base-pair steps. The last angle is computed similarly by using the base-pair twist with respect to the optimal helical axis. The fluctuations of the DNA length were also evaluated by using three alternative methods. The end-to-end distance, was measured directly between the origins of the terminal reference frames. The contour length was measured by summing the distances between the consecutive frames. The last value, was obtained by summing the local rise from the 3DNA output. These three methods give different average values and it is not evident which of them is the best estimate of the macroscopic DNA length. Therefore, in Eq. (1) we used computed as nm, that is by using the experimental length for one bps. This can cause a systematic bias in the measured PLs, but does not affect qualitative trends.
Results
Two stretching rigidities of the double helix
The length of the double helix is usually evaluated by summing the helical rise along the moleculeLankas et al. (2000); Mazur (2006). The rise can be measured with respect to the helical axis (global rise) or between the base pair frames (local rise). In both cases it is sensitive to algorithmic differences between the analysis programs Lu and Olson (1999), and the corresponding values sometimes diverge very significantly Mazur (2009a). To get reliable estimates we tested several possibilities and three representative techniques outlined in Methods are compared below. The end-to-end distance, , is a direct measure that is adequate in our case because for very short DNA the length fluctuations are dominated by stretching Mathew-Fenn et al. (2008); Mazur (2009c). The second parameter, , is the length of the three-dimensional zigzag line through the origins of the reference frames. By construction, (see Table 1). The cumulated local rise, , was used in the earlier studies Lankas et al. (2000); Mazur (2009a). The local rise is one of the orthogonal projections of the distance between the neighbor frames, therefore, . A similar value computed with the global rise is not considered here.
| (Å) | (nm) | (deg) | (nm) | ||||||
|---|---|---|---|---|---|---|---|---|---|
| method | TA6 | CG6 | TA6 | CG6 | method | TA6 | CG6 | TA6 | CG6 |
| 34.2 | 35.4 | 78 | 172 | -5.4 | 15.8 | 121 | 123 | ||
| 38.7 | 38.2 | 230 | 238 | 349.4 | 372.6 | 102 | 116 | ||
| 36.3 | 36.4 | 342 | 394 | 365.4 | 384.0 | 140 | 122 | ||
Fig. 1 shows the extension-vs-force plots obtained with the above three lengths. All three plots are approximately linear, in good agreement with the harmonic approximation, but the value grows much faster than the other two. Only the vertical positions of the theoretical straight lines were fitted to the data points while the slopes were computed independently, which gives an additional check of self-consistency. The increase of is similar to that of notwithstanding the divergence of their absolute values (see Table 1), and this increase agrees with the value obtained from equilibrium fluctuations of rather than . To explain these observations, note that the zigzag probed by forms a helical trace that winds around the straight segment measured by . Fig. 1 suggests that the strokes of the zigzag can be considered inextensible, and the end-to-end distance grows mainly due to flattening of angles. The local helical parameters are obtained by decomposing each stroke of the zigzag into rise, shift and slide Lu et al. (1997). All three of them contribute to the fluctuations of , however, only the rise is affected by the applied force because the other two correspond to displacements nearly orthogonal to the force. This explains why the growth of is better described by obtained from .
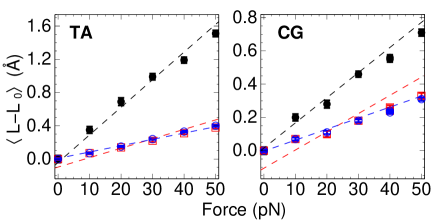
According to Fig. 1 the double helix is characterized by two qualitatively different stretching rigidities. Parameter corresponding to fluctuations of can be measured experimentally. In the experimental literature the stretching stiffness is conventionally characterized by the modulus related to as
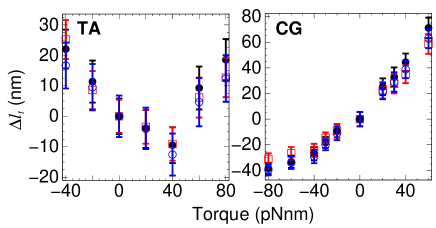
The experimental estimates of are around 1100 pN Smith et al. (1996); Wang et al. (1997); Wenner et al. (2002), which corresponds to =78 nm, in reasonable agreement with computed from MD data (see Table 1). This conclusion is corroborated by Fig. 2 that shows how the measured DNA length changes with forced twisting. According to experiments Gore et al. (2006); Lionnet et al. (2006) small twisting should cause extension of the double helix. It is seen that the end-to-end length indeed grows with small twisting in quantitative agreement with the experimental estimate.
In contrast, the stretching rigidity characterized by parameter is similar for both sequences, but significantly larger than the experimental estimate (see Table 1). Thermal fluctuations of the local rise involve perturbations of base-pair stacking, therefore, specifically characterizes the strength of stacking interactions. However, this stretching rigidity is not probed in experiments. Fig. 2 reveals that the lengths measured by parameters and both decrease with twisting, in qualitative divergence from and experimental observations Gore et al. (2006); Lionnet et al. (2006).
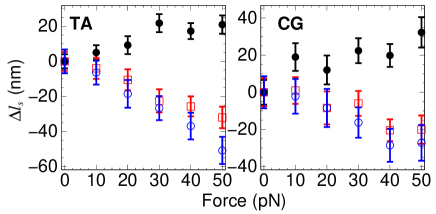
The stretching rigidity does not remain constant with forced stretching and twisting. Fig. 3 reveals that in stretched DNA, and deviate in opposite senses. The value corresponding to experimental measurements grows. Therefore, the molecule should gradually become stiffer until the stretching force approaches the limit of about 70 pN where the B-DNA is known to loose stability Strick et al. (2000). The stiffening agrees with the deviations of black points in Fig. 1 from the linear plots corresponding to the harmonic approximation. Mechanistically, the growth of can be rationalized by noting that, with the zigzag angles flattened, the end-to-end distance approaches the zigzag length . Since can never exceed , the fluctuations of should decrease, that is, grows approaching . The simultaneous decrease of reflects gradual weakening of base-pair stacking. Twisting also increases the stretching rigidity (see Fig. 4). However, untwisting of TA6 changes only slightly, suggesting that it passes through a minimum with torque =-20 pNnm. Interestingly, the value of reached with untwisting of CG6 is similar to that of TA6.
Torsional rigidity
In the previous report Mazur (2010) the torsional rigidity was evaluated by using the twist angle (see Methods). This parameter depends upon the construction of an optimal straight helical axis, which can add a spurious noise due to bending deformations of the double helix. For verification, here the torsional dynamics are analyzed by three alternative methods including the earlier one. The end-to-end twist is most appropriate for comparisons with experiment because it closely corresponds to that measured in experiments with long DNA. The cumulated local twist represents another reasonable alternative and it was added as an additional check.
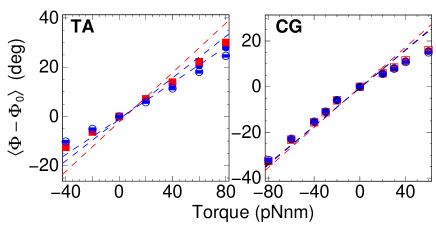
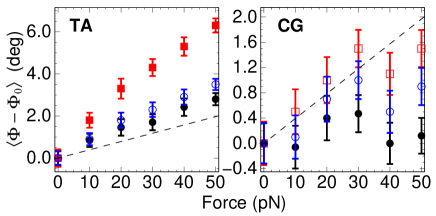
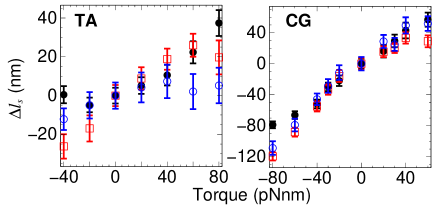
The external torque changes DNA twisting as shown in Fig. 5. In contrast to stretching, the three alternative measures of angle give very similar results in spite of the divergence of the reference zero-stress values (see Table 1). Similarly to Fig. 1, only the vertical positions of the theoretical straight lines were fitted to the data points, with the slopes computed independently. This additionally checks the self-consistency and one may note that the deviations from the harmonic law are smaller for and than for . Earlier single-molecule experiments revealed that DNA overwinds when stretched Gore et al. (2006); Lionnet et al. (2006). This effect is well reproduced with any of the three methods (see Fig. 6) sometimes with good quantitative agreement. The dashed lines in Fig. 6 represent the experimental dependence for small forces below 30 pN Gore et al. (2006). With stronger extension the twist should start to fall. For TA6 this experimental observation is not reproduced, but for CG6 a transition from an ascending trend to an irregular plateau is indeed observed at about 30 pN. This irregular dependence is not due to errors or hidden statistical noise. For verification, we reduced the force from 50 to 40 pN, repeated the MD simulations, then raised the force back to 50 pN, and carried out one more run. The results of this back and forth test were within the error limits shown in Fig. 6.
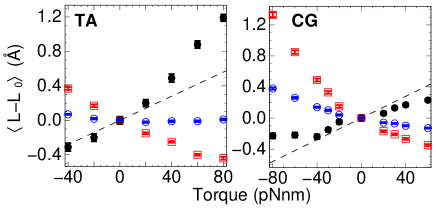
The measured torsional rigidity changes with forced twisting as shown in Fig. 7. The three alternative measures of twist yield very similar results all showing strong variations of , with a remarkable qualitative difference between the two sequences. These rigidity profiles agree with the non-linear features of the plots in Fig. 5. Indeed, for CG6 they are concave and for TA6 the harmonic law corresponding to the zero-stress rigidity overestimates the twisting of both signs. The twisting rigidity of CG6 grows steadily in the whole range of torques tested. In contrast, for TA6 an opposite trend is observed under small torques, but passes via a minimum under positive torques. A qualitatively similar behavior was experimentally observed for one natural DNA sequence Song et al. (1990); Naimushin et al. (1994).
The growth of rigidity with torques of both signs agrees with simple physical intuition for a twist energy profile resembling a flat-bottomed basin with vertical walls. In this case the system cannot go very far even with strong energy fluctuations. The range of torques applied to CG6 was extended to check the existence of a minimum under negative torques. It is seen, however, that the minimum is not reached although the decrease of becomes less steep with untwisting. This behavior indicates that anomalously frequent strong untwisting fluctuations should occur in GC-alternating DNA under normal temperature.
The results in Fig. 7 confirm and corroborate the conclusions of the previous report where smaller torques were considered Mazur (2010). The earlier data are compared with those of the present study in Fig. 8. It is seen that the two series of simulations are consistent in spite of the differences in protocols. Each open circle and open square in Fig. 8 correspond to a single continuous trajectory, therefore, this figure confirms ergodicity and validates the much faster protocol introduced here. The new plots also look less noisy, which can be attributed to the absence of slow non-canonical dynamics. In the previous calculations, such transitions occurred almost exclusively in terminal bps Mazur (2009b, 2010), nevertheless, they affected the middle fragments allosterically and contaminated the results.
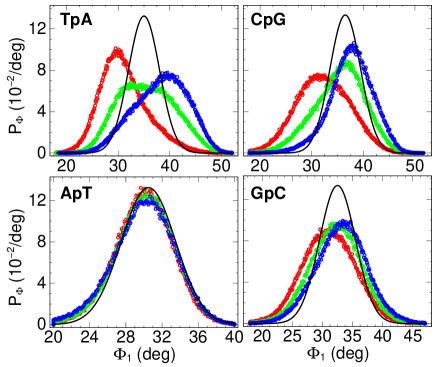
The strong torsional anharmonicity is not seen in the shapes of the probability distributions of twisting fluctuations of the whole fragment. These distributions remain nearly Gaussian, with the widths changing in agreement with Fig. 7 (see Refs. Mazur, 2010; Not, ). In contrast, the pattern of single-step twist fluctuations qualitatively explains the effect revealed in Fig. 7 and 8. As seen in Fig. 9, with a notable exception of the adenine-phosphate-thymine steps (ApT), these distributions strongly differ from Gaussians predicted for harmonic WLC model with the measured values. Surprisingly, for TpA and CpG steps these shapes qualitatively change with twisting. With negative torques the distributions in the upper two panels are strongly positively skewed, but they gradually become negatively skewed as the torque changes the sign. The same is true for the GpC distributions although in this case the effect is much smaller. Some of the TpA and CpG distributions exhibit clear humps suggesting that the twisting in these steps is best described by double-well potentials with low transition barriers.
The CpG and GpC distributions in Fig. 9 behave similarly, that is, they become wider with untwisting in qualitative agreement with the plots for CG6 in Fig. 8. In contrast, in TA6 the two alternating dinucleotide steps behave differently. The width of the ApT step distributions changes monotonously in the whole range of torques probed, that is, the minimum of at 40 pNnm in Fig. 8 is exclusively due to TpA steps. The ApT distributions also exhibit a striking feature. The centers of all plots are shifted in agreement with the sign of the applied torque, however, the magnitude of the shift is small compared to the change in the distribution width. As a result, the probabilities of strong untwisting fluctuations are higher with =+80 pNnm than with =-40 pNnm. The effect is small, but statistically significant (see also Ref. Not, ). This feature is counterintuitive because it cannot be reproduced with the WLC model.

In contrast to twisting, small stretching has virtually no effect upon the torsional rigidity of DNA. The corresponding data are shown in Fig. 10. For clarity, only the values are shown. The variations are small and rarely exceed the statistical errors. When is measured by using magnetic tweezers the common stretching load is smaller than 20 pN Bryant et al. (2003) and the data in Fig. 10 indicate that it can noticeably affect the results only due to mechanisms that are not reproduced in the present DNA model.
Bending rigidity
In long DNA, stretching naturally flattens bends, whereas twisting causes looping and supercoiling, that is, increases bending in some DNA stretches. These effects are strong; the accompanying changes in the bending rigidity are hardly measurable experimentally and this possibility usually is not considered. The atom-level modeling is the only currently available method that can check whether or not the bending rigidity of DNA in principle can be affected by the twisting and/or tensional stress. The results of the first such tests are shown in Fig. 11.
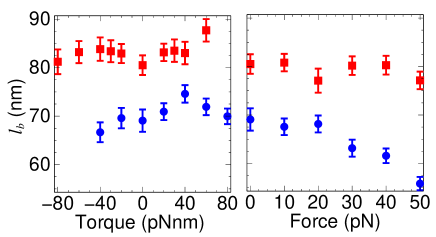
The measured bending PL of CG6 exhibits only small variations with both twisting and stretching. In contrast, for TA6 these variations significantly exceed statistical uncertainty and reveal interesting trends. Notably, the right panel of Fig. 11 reveals that bending in TA6 increases with stretching, which is opposite to the expected flattening effect. At the same time, the dependence in the left panel of Fig. 11 passes through a maximum at 40 pNnm, that is exactly where the torsional PL reaches the local minimum in Fig. 7. A closer look reveals that these trends are accompanied by subtle qualitative changes in the bending dynamics. By using the base pair coordinate frames provided by the program 3DNA Lu and Olson (2003) one can conveniently characterize the bend direction as follows. Consider two coordinate frames constructed at the first and the last base pairs, respectively. According to the standard convention Olson et al. (2001), the two xy-planes dissect the double helix approximately parallel to the base pair planes. The corresponding two z-vectors approximate the local directions of the helical axis. If the z-vectors are not parallel we can construct the orthogonal projection of the second z-vector upon the first xy-plane. The spherical azimuth angle is measured between the projected z-vector and the x-vector of the projection plane. With the x-vector corresponding to the standard convention Olson et al. (2001), the value of is close to zero when the molecule is bent towards the minor groove in the middle of the helical turn. A few representative distributions of angle are shown in Fig. 12.
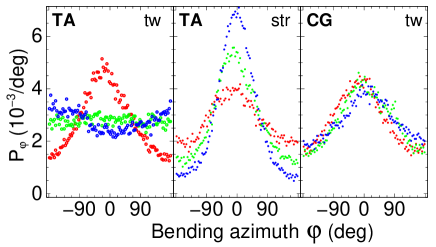
The red distribution in the middle panel indicates that the unstressed TA6 fragment prefers to bend towards the minor groove. The origin of this anisotropy should be studied additionally because it is probably inherent in the overall dynamics rather than caused by local end effects or construction of the coordinate frames. Here we use it just as an indicator. It is seen that the original anisotropy increases with both stretching and unwinding, but positive torques reduce it. As a result, with =40 pNnm the azimuth distribution becomes even, and with further twisting the anisotropy of an opposite sign appears (left panel). This behavior is in remarkable contrast to that of CG6. For CG6 the bending is also preferable towards the minor groove, but twisting only causes rotation of this direction in agreement with the relative orientation of the minor groove in the middle of the fragment (right panel).
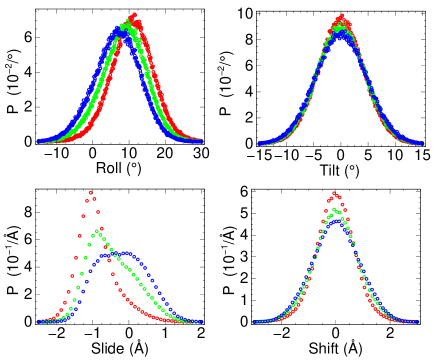
Comparison of Fig. 12 with Fig. 7 and 9 suggests that =40 pNnm corresponds to a transition state between two qualitatively different dynamic patterns and that this behavior is attributable to the specific properties of TpA steps. The results in Fig. 7 and 9 can be readily rationalized and qualitatively reproduced in an appropriate coarse-grained model with local twisting described by a double-well potential. Global bending of the double helix results from local deviations of bps geometry described by parameters Roll, Tilt, Slide, and Shift Olson et al. (2001). Analysis shows that, in TpA steps, all of them are affected by twisting. Roll and Slide change more than other, with Slide exhibiting a bi-modal pattern of fluctuations Not . These data demonstrate that a mechanical link between twisting and bending is an inherent property of TpA dinucleotides, therefore, we can qualitatively explain the results in the left panel of Fig. 12. The quantitative relation is much more difficult to establish because global bending results from a complex summation of local motions over the whole fragment, including correlations and helical rotation. The correspondence of the transition states for twisting and bending in TA6 may be a coincidence, nevertheless, the results in Fig. 11 and 12 evidence that twisting and stretching can produce unexpected sequence dependent effects upon the bending dynamics in DNA. The stress response is complex and it cannot be reduced to an altered bending rigidity of the underlying WLC model.
Discussion
A very good agreement of experiments on polymer DNA with the WLC model Bustamante et al. (1994); Vologodskii (1994); Vologodskii and Marko (1997); Wang et al. (1997); Moroz and Nelson (1997); Bouchiat et al. (1999) have led to an exaggerated belief that the harmonic approximation is sufficient for describing all essential properties of the DNA double helix. In fact, these remarkable results cannot be considered as evidences of harmonicity because the additive ladder construction of the double helix effectively hides local heterogeneity and anharmonicity. Due to this additivity, and the central limiting theorem of the probability theory, various experimental data converge to the WLC model regardless of the local DNA properties, with only a few concatenated bps being sufficient for the apparent statistical equivalence with a harmonic elastic rod Mazur (2010). This effect shadows the true mechanical properties of the DNA double helix which remain elusive.
The present study evidences that, under normal temperature, the local DNA elasticity is strongly anharmonic, in agreement with the early hypotheses Shibata et al. (1984) and some experimental data Song et al. (1990); Selvin et al. (1992); Naimushin et al. (1994). The results of computations using empirical forcefields certainly require further verification. New experimental approaches need to be developed for this purpose because currently available methods can probe only the average elastic parameters of long molecules.
The computed values of all elastic parameters reasonably agree with the data for polymer DNA obtained by different experimental methods. The earlier controversy concerning the stretching (Young’s) modulus Mazur (2009a) is clarified here by comparing different procedures for measuring the length of the double helix. The experimental bending rigidity is characterized by nm Hagerman (1988). The measured values vary between 36 and 109 nm depending upon specific methods and conditions Fujimoto et al. (2006). The stretching PL is about 80 nm Smith et al. (1996); Wang et al. (1997); Wenner et al. (2002). MD simulations give somewhat larger values, that is, the DNA stiffness is slightly overestimated. Lankas et al. (2000); Mazur (2006) This discrepancy is not large and it can be attributed to a combination of factors like inexact correspondence between the microscopic geometric parameters and experimental observables, the neutralizing salt conditions in MD, and the small size of the modeled fragments predictably leading to strong sequence and end effects. As shown here, MD also quantitatively reproduce the reciprocal coupling between twisting and stretching revealed in recent magnetic tweezer experiments Gore et al. (2006); Lionnet et al. (2006). The overall agreement is quite remarkable because none of the MD forcefield parameters was adjusted to fit the computed DNA elasticity to experiment. One may reasonably hope, therefore, that the detailed microscopic picture provided by simulations captures the qualitative physical trends dictated by the atom-level mechanics of the double helix.
Our results indicate that the most significant anharmonicity is inherent in the torsional DNA deformations, which is attributable to the special character of stacking interactions. The twisting occurs due to sliding within the stacks; this motion is essentially barrierless and its amplitude significantly exceeds the zone where the harmonic approximation is valid. Even small twisting torques can cause significant changes in elastic parameters. The qualitative difference in the stress response of the torsional rigidity of AT6 and CG6 indicates that this property is strongly sequence-dependent. Opposite local trends can mutually cancel out, which makes difficult detection of anharmonic effects in long DNA. There are a few reports in the literature where relevant experimental data qualitatively differ from predictions of harmonic models. This occurred with some natural plasmid DNA Naimushin et al. (1994) and also with synthetic alternating sequences Wells et al. (1977). The latter were recently found anomalous as regards the sequence-dependent bending rigidity Geggier and Vologodskii (2010). These earlier results require additional investigations.
The mechanical strain is an ubiquitous attribute of living DNA and a key factor in genome packaging and regulation. The common magnitudes of natural forces and torques are quite large, therefore, a wide spectrum of non-linear structural responses should be anticipated, with elastic deformations at one end of the scale, and local melting at the other end. A few anharmonic effects revealed here have some interesting implications for gene regulation mechanisms. According to Fig. 8, with the helical twist slightly shifted from the equilibrium value the sequence dependence of the DNA elasticity can be significantly changed and enhanced. The measured torsional stiffnesses are similar without applied torque, but diverge with both twisting and untwisting. For other sequences, similar behavior can be anticipated for bending and stretching. The deformability of DNA is long considered as a possible governing factor in the sequence-specific site recognition Hogan and Austin (1987), but this mechanism requires strong sequence dependence of local elastic parameters compared to that observed in experiments with long free DNA Fujimoto and Schurr (1990). As we see the properties of the relaxed DNA cannot be simply transferred to supercoiled and/or protein bound DNA states. Additional studies are necessary to check if the elastic properties of the specific binding sites are sensitive to external stress.
Unexpectedly, we found that the torsional rigidity of AT6 passes via a minimum under moderate positive twisting torques. This feature is probably due to a bimodal character of twist fluctuations in the TpA steps (Fig. 9). The average twist of AT6 with =40 pNnm actually is very close to the experimental value in solution Rhodes and Klug (1981); Strauss et al. (1981) because in free AMBER simulations the DNA structures are somewhat underwound Cheatham et al. (1999). In this state the TpA steps exhibit a distribution of twist fluctuations corresponding to a saddle point between two domains of attraction (Fig. 9). This point also coincides with the maximum in the measured bending PL accompanied by inversion of the local bending anisotropy.
Earlier it was suggested that the TpA steps can adopt at least two distinct conformational states. Depending on the sequence context, there is always a temperature range where the TpA steps exhibit slow conformational transitions with relaxation times beyond the nanosecond time range McAteer et al. (1995). These slow motions should involve extended DNA stretches, that is, these are global transitions accompanied by switching in the TpA steps. The same local switching is probably responsible for the unusual effects observed here. The exceptional properties of the TpA steps are long-known in molecular biology Travers and Klug (1987). These steps are found in both narrowings and widenings of the minor B-DNA groove Yoon et al. (1988); Quintana et al. (1992). Periodically spaced TpA steps is the most statistically significant feature of DNA sequences that provide optimal DNA wrapping around nucleosome particles Takasuka and Stein (2010). Switching of local bending anisotropy in response to variable torsional stress may play some role in the control of DNA wrapping and unwrapping. Future studies will show whether or not these processes are related with the unusual microscopic dynamics revealed in our computations.
According to Fig. 9 the strong variation of the twisting rigidity of CG6 is mainly due to CpG steps. They exhibit anomalously high probability of negative twist fluctuations with torques around zero. The CpG steps are found in a number of known protein binding sites, but their most important biological role is related with C5-cytosine methylation and epigenetic regulation mechanisms Robertson (2005). The recognition of CpG sites is a complex multi-facet process because they exist in three methylation states with distinct functions and because specific binding, methylation and demethylation can occur on both free and nucleosome bound DNA Arita et al. (2008); Metivier et al. (2008); Ho et al. (2008); Chodavarapu et al. (2010). Interestingly, methylation of free DNA strongly depends upon supercoiling, with the superhelical density acting smoothly in a dose-dependent manner Bestor (1987). The corresponding catalytic mechanism requires cytosine flipping from the DNA stack into a protein pocket Klimasauskas et al. (1994). The low energy pathway of this flipping transition may require a strong twisting fluctuation of the CpG step, which would explain the effect of the torsional strain Bestor (1987).
The above specific examples suggests a more general hypothesis concerning the possible role of strong DNA fluctuations in gene regulation, with the non-linear elasticity as the governing factor. There are many long-known and well-documented processes in vivo where strongly deformed conformations are involved instead of canonical B-DNA. Deformed DNA conformations are ubiquitous in X-ray structures of protein-DNA complexes, so that one may wonder why there is no evolutionary pressure towards proteins that can recognize relaxed B-DNA? It was shown that the activity of promoters regulated via strongly deformed DNA states can be increased by mutations that reduce the deformation energy Chow et al. (1991); Li et al. (1999), but these mutations are not selected in vivo. It is possible that the prevalence of large DNA deformations is not a trivial consequence of its flexibility, but a necessity of regulatory mechanisms that involve mechanical stress. The larger the deformation - the lower its probability and the population of such state. However, these low probabilities can strongly change in response to small regulatory impulses, in contrast to populations of low energy states. The non-linear elastic effects should play an important role in such regulation because they can greatly amplify the input signal and also make possible complex responses like coupling of the amplitude and the anisotropy of local bending to the torsional stress as in the TA6 fragment studies here. Similar ideas were discussed in the earlier literature. This hypothesis is complementary to the view of DNA as an allosteric protein cofactor Lefstin and Yamamoto (1998) used to explain the smooth modulation of gene activity during cell development Meijsing et al. (2009). The effects of mechanical strain upon the probabilities of strong fluctuations in DNA represent significant interest and require further studies. New insights in this direction can be obtained by using MD simulations of DNA in steady stress conditions Mazur (2009b) and this work is continued.
Acknowledgements.
The author is grateful to Mickey Schurr and Andrew Travers for useful discussions and valuable comments to the original manuscript.I Appendix
Simulation protocols
Tetradecamer DNA fragments were modeled with AT-alternating (ATATATATATATAT) and GC-alternating (GCGCGCGCGCGCGC) sequences. The choice of the fragment length and sequences is consistent with the recent computations Mazur (2008, 2009b, 2009a) and it was dictated by the following considerations. An integral number of helical turns is preferable for evaluation of the elastic parameters of DNA and one helical turn is optimal because of the rapid growth of the principal relaxation times with the chain length Mazur (2009a). These molecules are homopolymers of ApT and GpC dinucleotides, therefore, they cannot have distinguished asymmetric structures like static bends. True homopolymer DNA duplexes have special properties and, in free MD with the AMBER forcefield, these structures deviate from the canonical B-DNA stronger than AT- and GC-alternating sequences Mazur (2005).
The classical MD simulations were carried out by running independent trajectories in parallel on different processors for identical conditions. The number of processors varied between 32 and 48. The starting states were prepared as follows. The solute in the canonical B-DNA conformation Arnott and Hukins (1972) was immersed in a 6.2-nm cubic cell with a high water density of 1.04. The box was neutralized by placing Na+ ions at random water positions at least 5 Å from the solute. The system was energy minimized and dynamics were initiated with the Maxwell distribution of generalized momenta at low temperature. The system was next slowly heated to 293 K and equilibrated during 1.0 ns. After that the water density was adjusted to 0.997 by removing the necessary number of water molecules selected randomly at least 5 Å from DNA and ions, and the simulations were continued with NVT ensemble conditions. Independent starting states for parallel trajectories were prepared by redistributing the counterions around DNA and re-equilibrating the system with different random sets of initial momenta. The statistical independence was verified as explained further below. Steady stress loads were applied as described elsewhere Mazur (2009b). Trajectories with the lowest loads started from the final states of free dynamics. The amplitudes of forces and torques were increased gradually so that simulations with higher values started from the final states obtained under the preceding lower values. The initial 0.5 ns of every sub-trajectory were discarded, which was sufficient for re-equilibration.
The AMBER98 forcefield parameters Cornell et al. (1995); Cheatham et al. (1999) were used with the rigid TIP3P water model Jorgensen et al. (1983). The electrostatic interactions were treated by the SPME method Essmann et al. (1995), with the common values of Ewald parameters, that is 9 Å truncation for the real space sum and . The temperature was maintained by the Berendsen algorithm Berendsen et al. (1984) applied separately to solute and solvent with a relaxation time of 10 ps. To increase the time step, MD simulations were carried out by the internal coordinate method (ICMD), Mazur (1997, 1999) with the internal DNA mobility limited to essential degrees of freedom and rotation of water molecules and internal DNA groups including only hydrogen atoms slowed down by weighting of the corresponding inertia tensors. Mazur (1998a, b) The double-helical DNA was modeled with all backbone torsions, free bond angles in the sugar rings, and rigid bases and phosphate groups. The effect of these constraints is insignificant, as was previously checked through comparisons with standard Cartesian dynamics Mazur (1998a, 2006). The time step was 0.01 ps and the DNA structures were saved every 5 ps. All trajectories were continued to obtain the sampling corresponding to 164 ns of continuous dynamics, that is 215 points for every value of force (torque). Statistical convergence and errors were evaluated by the method of block averages (see further below).
The terminal base pairs open rather frequently during nanosecond time scale MD, which significantly perturbs the flanking DNA structure. Because this dynamics cannot be averaged during the accessible duration of MD trajectories, we blocked it by applying non-perturbing upper distance restraints as explained elsewhere Mazur (2009b). A similar approach was used to confine the backbone dynamics to the canonical B-DNA zones. Rare non-canonical switches accompanied by and dynamics complicate statistical analysis of MD trajectories Dixit et al. (2005). The population of non-canonical conformers is overestimated with all versions of the AMBER94 forcefield including parmbsc0 Perez et al. (2007a) most used in recent years Lankas et al. (2010). With the parm98 modifications Cheatham et al. (1999) designed to increase the average DNA twist, this problem seems to be less severe Mazur (2009b). However, even with a hypothetical ideal forcefield, such transitions should have been blocked because they are too rare for accurate averaging. It appears that the following flat-bottom restraint upon torsions solves the problem
with 30 kcal/mol. This noninvasive approach does not perturb the dynamics in the canonical zones, which makes possible comparison with the previous long-time simulations of similar DNA fragments.
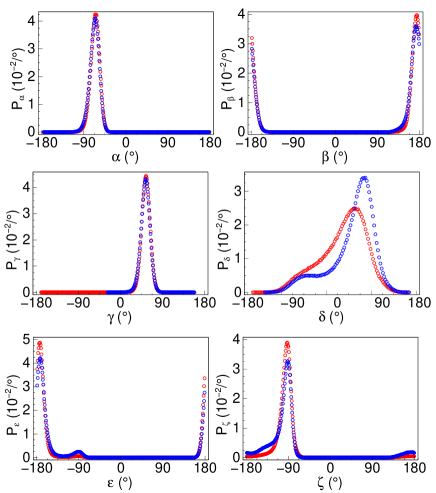
In all simulations the B-DNA conformations were well conserved without signs of accumulated deformations. Representative probability distributions of backbone torsions are shown in Fig. 1. They correspond to standard B-DNA dynamics Dixit et al. (2005).
Evaluation of statistical errors
Evaluation of errors in MD simulations is based upon the following assertions from the probability theory. Consider a random variable with expectation and variance . We can take samples of and compute
and
called the sample average and variance, respectively. Both and are random variables, with and , i.e. and provide unbiased estimates of and , respectively. It is also known that
| (3) |
and, if is a Gaussian random variable,
| (4) |
Eq. (3) and (4) are used for evaluation of statistical errors.
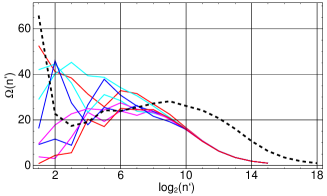
Consider evaluation of torsional fluctuations, for instance. In this case, the random variable is the twist angle of one helical turn, , with expectation and variance . The torsional persistence length is computed as . The canonical moments and are thermodynamic limits and they are estimated by using, respectively, the sample average and variance computed over all points saved during an MD trajectory. However, Eq. (3) and (4) cannot be applied straightforwardly because they are valid only for statistically independent samples, i.e. the time intervals between the MD states must be suitably large compared to the torsional relaxation time. The data saving interval is commonly much smaller, therefore, the errors are evaluated by using the method of block averages Flyvbjerg and Petersen (1989); Frenkel and Smit (1996). The trajectory is successively divided in stretches (blocks) and the sample variances are computed by using block averages instead of individual samples. When the blocks are longer than the torsional relaxation time the block averages are independent and , where is the effective number of independent samples provided by the trajectory. This value should be used in place of in Eq. (3) and (4). In practice, it is convenient to draw the plots of
with respect to . When statistical independence is reached, such plots exhibit a plateau with , which gives the required estimate of . Parameter is the effective correlation time measured in trajectory saving steps.
Fig. 2 shows how this works for Brownian dynamics (BD). We consider eight trajectories from earlier published simulations of a discrete wormlike chain (WLC) model of 14-mer DNA Mazur (2009a, b). Each data set involved consecutive configurations saved with a 5 ps interval (about 164 ns in total), that is exactly as in MD simulations. With decreasing, the plots display emergence of a plateau and the growth of statistical noise. The black dashed line displays the results for a single eight times longer trajectory. It is seen that the plateau becomes less noisy, but its level does not change. This confirms the validity of the above derivations, i.e. is constant and, consequently, Eq. (3) holds. Fig. 2 shows that a reasonably accurate estimate of the plateau value can be obtained with or larger. On the other hand, the plateau emerges with the block length or larger, therefore, the lower estimate of the necessary total duration of trajectory is .
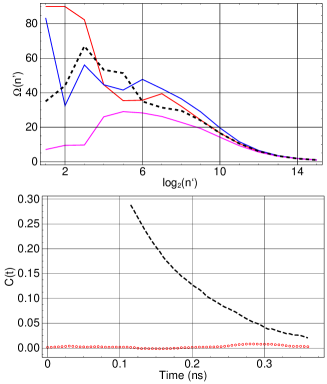
The foregoing analysis is equally valid when several trajectories are concatenated and considered as a single longer trajectory. It is only necessary that the sub-trajectories are statistically independent and suitably longer than . A representative example is shown in the upper panel of Fig. 3. We consider the torsional fluctuations of CG6 fragments. The dashed black plot was obtained by processing a continuous 164 ns trajectory form our earlier report Mazur (2010). The solid red line shows the analogous results for the protocol used here (32 concatenated sub-trajectories). In both cases no external stress was applied. The plots show good convergence except for small where the statistical noise is high. The statistical dependence between the subtrajectories is analyzed by using time cross-correlation functions computed as
| (5) |
where the superscripts and refer to individual sub-trajectories. The lower panel compares the cross-correlation function averaged over all with the time autocorrelation function from the long trajectory. The latter is obtained by setting in Eq. (5). This figure confirms that the subtrajectories are statistically independent from the very beginning. The estimated from the upper panel gives =820 and the relative error of 4.5% in the measured values, which is sufficient for our purposes. This relaxation time is approximately two times that estimated from the decay of autocorrelations by using the condition . A similar consistency is observed for BD simulations (see Fig. 2 and Ref. Mazur, 2009a).
The upper panel of Fig. 3 displays two additional traces obtained in simulations with applied external torques of pNnm. The torsional elasticity of the CG6 fragment changes with the applied torque so that the double helix becomes softer with untwisting. This gives a noticeable increase in the torsional relaxation time, and, accordingly, the three traces corresponding to positive, zero, and negative torques diverge. As a result, for this DNA fragment, the relative error in the measured values increases with untwisting.
Results
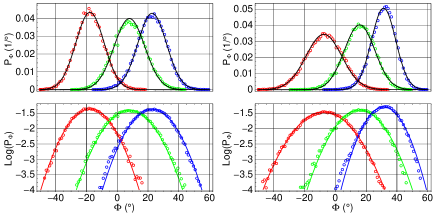
In a harmonic approximation, the canonical distribution of twisting fluctuations reads
| (6) |
where is the shifted equilibrium twist angle under torque . The persistence length defines the width of the distribution and it must be constant if the harmonic approximation is valid. The computed patterns of fluctuations appeared qualitatively similar for all three measured twist angles. In Fig. 4, a few representative distributions are exhibited for fluctuations of angle . All of the distributions are close to the analytical Gaussians defined by Eq. (6), however, their widths vary in agreement with the observed changes in . Systematic deviations from the Gaussian shape are noticeable only with the largest positive torques.
References
- Bloomfield et al. (2000) V. A. Bloomfield, D. M. Crothers, and I. Tinoco, Nucleic Acids Structures Properties and Functions (University Science Books, Sausaliito, CA, 2000).
- Cozzarelli et al. (2006) N. R. Cozzarelli, G. J. Cost, M. Nollmann, T. Viard, and J. E. Stray, Nat. Rev. Mol. Cell. Biol. 7, 580 (2006).
- Wang (1996) J. C. Wang, Annu. Rev. Biochem. 65, 635 (1996).
- Wang (2002) J. C. Wang, Nature Rev. Mol. Cell Biol. 3, 430 (2002).
- Vologodskii and Cozzarelli (1994) A. V. Vologodskii and N. R. Cozzarelli, Annu. Rev. Biophys. Biomol. Struct. 23, 609 (1994).
- Travers and Muskhelishvili (2005) A. Travers and G. Muskhelishvili, Nat. Rev. Microbiol. 3, 157 (2005).
- Borowiec and Gralla (1987) J. A. Borowiec and J. D. Gralla, J. Mol. Biol. 195, 89 (1987).
- Peter et al. (2004) B. J. Peter, J. Arsuaga, A. M. Breier, A. B. Khodursky, P. O. Brown, and N. R. Cozzarelli, Genome. Biol. 5, R87 (2004).
- Landau and Lifshitz (1976) L. D. Landau and E. M. Lifshitz, Statistical Physics, Part 1 (Nauka, Moscow, 1976).
- Cantor and Schimmel (1980) C. R. Cantor and P. R. Schimmel, Biophysical Chemistry, Part III: The Behavior of Biological Macromolecules (W. H. Freeman, San Francisco, 1980).
- Bustamante et al. (1994) C. Bustamante, J. F. Marko, E. D. Siggia, and S. Smith, Science 265, 1599 (1994).
- Vologodskii (1994) A. V. Vologodskii, Macromolecules 27, 5623 (1994).
- Vologodskii and Marko (1997) A. V. Vologodskii and J. F. Marko, Biophys. J. 73, 123 (1997).
- Wang et al. (1997) M. D. Wang, H. Yin, R. Landick, J. Gelles, and S. M. Block, Biophys. J. 72, 1335 (1997).
- Moroz and Nelson (1997) J. D. Moroz and P. Nelson, Proc. Natl. Acad. Sci. U. S. A. 94, 14418 (1997).
- Bouchiat et al. (1999) C. Bouchiat, M. D. Wang, J. Allemand, T. Strick, S. M. Block, and V. Croquette, Biophys. J. 76, 409 (1999).
- Vologodskii et al. (1992) A. V. Vologodskii, S. D. Levene, K. V. Klenin, M. Frank-Kamenetskii, and N. R. Cozzarelli, J. Mol. Biol. 227, 1224 (1992).
- Wells et al. (1977) R. D. Wells, R. W. Blakesley, S. C. Hardies, G. T. Horn, J. E. Larson, E. Selsing, J. F. Burd, H. W. Chan, J. B. Dodgson, K. F. Jensen, et al., CRC. Crit. Rev. Biochem. 4, 305 (1977).
- Bauer (1978) W. R. Bauer, Annu. Rev. Biophys. Bioeng. 7, 287 (1978).
- Balandina et al. (2002) A. Balandina, D. Kamashev, and J. Rouviere-Yaniv, J. Biol. Chem. 277, 27622 (2002).
- Boles et al. (1990) T. C. Boles, J. H. White, and N. R. Cozzarelli, J. Mol. Biol. 213, 931 (1990).
- Song et al. (1990) L. Song, B. S. Fujimoto, P. G. Wu, J. C. Thomas, J. H. Shibata, and J. M. Schurr, J. Mol. Biol. 214, 307 (1990).
- Selvin et al. (1992) P. R. Selvin, D. N. Cook, N. G. Pon, W. R. Bauer, M. P. Klein, and J. E. Hearst, Science 255, 82 (1992).
- Naimushin et al. (1994) A. N. Naimushin, J. B. Clendenning, U. S. Kim, L. Song, B. S. Fujimoto, D. W. Stewart, and J. M. Schurr, Biophys. Chem. 52, 219 (1994).
- Fujimoto et al. (2006) B. S. Fujimoto, G. P. Brewood, and J. M. Schurr, Biophys. J. 91, 4166 (2006).
- Gore et al. (2006) J. Gore, Z. Bryant, M. Nollmann, M. U. Le, N. R. Cozzarelli, and C. Bustamante, Nature 442, 836 (2006).
- Lionnet et al. (2006) T. Lionnet, S. Joubaud, R. Lavery, D. Bensimon, and V. Croquette, Phys. Rev. Lett. 96, 178102 (2006).
- Fujimoto and Schurr (1990) B. S. Fujimoto and J. M. Schurr, Nature 344, 175 (1990).
- Geggier and Vologodskii (2010) S. Geggier and A. Vologodskii, Proc. Natl. Acad. Sci. U. S. A. 107, 15421 (2010).
- Hagerman (1988) P. J. Hagerman, Annu. Rev. Biophys. Biophys. Chem. 17, 265 (1988).
- Smith et al. (1996) S. B. Smith, Y. Cui, and C. Bustamante, Science 271, 795 (1996).
- Wenner et al. (2002) J. R. Wenner, M. C. Williams, I. Rouzina, and V. A. Bloomfield, Biophys. J. 82, 3160 (2002).
- Cornell et al. (1995) W. D. Cornell, P. Cieplak, C. I. Bayly, I. R. Gould, K. M. Merz, D. M. Ferguson, D. C. Spellmeyer, T. Fox, J. W. Caldwell, and P. A. Kollman, J. Am. Chem. Soc. 117, 5179 (1995).
- MacKerell et al. (1995) A. D. MacKerell, Jr., J. Wiórkiewicz-Kuczera, and M. Karplus, J. Am. Chem. Soc. 117, 11946 (1995).
- Perez et al. (2007a) A. Perez, I. Marchan, D. Svozil, J. Sponer, T. E. Cheatham, C. A. Laughton, and M. Orozco, Biophys. J. 92, 3817 (2007a).
- Darden et al. (1993) T. Darden, D. York, and L. Pedersen, J. Chem. Phys. 98, 10089 (1993).
- Essmann et al. (1995) U. Essmann, L. Perera, M. L. Berkowitz, T. Darden, H. Lee, and L. G. Pedersen, J. Chem. Phys. 103, 8577 (1995).
- Cheatham and Kollman (2000) T. E. Cheatham, III and P. A. Kollman, Annu. Rev. Phys. Chem. 51, 435 (2000).
- Perez et al. (2007b) A. Perez, F. J. Luque, and M. Orozco, J. Am. Chem. Soc. 129, 14739 (2007b).
- Mazur (2006) A. K. Mazur, Biophys. J. 91, 4507 (2006).
- Mazur (2007) A. K. Mazur, Phys. Rev. Lett. 98, 218102 (2007).
- Mazur (2008) A. K. Mazur, J. Phys. Chem. B 112, 4975 (2008).
- Mazur (2009a) A. K. Mazur, J. Phys. Chem. B 113, 2077 (2009a).
- Zhurkin et al. (1979) V. B. Zhurkin, Y. P. Lysov, and V. I. Ivanov, Nucleic Acids Res. 6, 1081 (1979).
- MacKerell and Lee (1999) A. D. MacKerell, Jr. and G. U. Lee, Eur. Biophys. J. 28, 415 (1999).
- Harris et al. (2005) S. A. Harris, Z. A. Sands, and C. A. Laughton, Biophys. J. 88, 1684 (2005).
- Luan and Aksimentiev (2008) B. Luan and A. Aksimentiev, Phys. Rev. Lett. 101, 118101 (2008).
- Kannan et al. (2006) S. Kannan, K. Kohlhoff, and M. Zacharias, Biophys. J. 91, 2956 (2006).
- Wereszczynski and Andricioaei (2006) J. Wereszczynski and I. Andricioaei, Proc. Natl. Acad. Sci. U. S. A. 103, 16200 (2006).
- Randall et al. (2009) G. L. Randall, L. Zechiedrich, and B. M. Pettitt, Nucleic. Acids. Res. 37, 5568 (2009).
- Curuksu et al. (2008) J. Curuksu, K. Zakrzewska, and M. Zacharias, Nucleic Acids Res. 36, 2268 (2008).
- Mazur (2009b) A. K. Mazur, J. Chem. Theory Comput. 5, 2149 (2009b).
- Mazur (2010) A. K. Mazur, Phys. Rev. Lett. 105, 018102 (2010).
- Lankas et al. (2000) F. Lankas, J. Sponer, P. Hobza, and J. Langowski, J. Mol. Biol. 299, 695 (2000).
- Chow et al. (1991) K. L. Chow, M. E. Hogan, and R. J. Schwartz, Proc. Natl. Acad. Sci. U. S. A. 88, 1301 (1991).
- Cluzel et al. (1996) P. Cluzel, A. Lebrun, C. Heller, R. Lavery, J. L. Viovy, D. Chatenay, and F. Caron, Science 271, 792 (1996).
- Bustamante et al. (2000) C. Bustamante, S. B. Smith, J. Liphardt, and D. Smith, Curr. Opin. Struct. Biol. 10, 279 (2000).
- Letessier et al. (2011) A. Letessier, G. A. Millot, S. Koundrioukoff, A.-M. Lachages, N. Vogt, R. S. Hansen, B. Malfoy, O. Brison, and M. Debatisse, Nature 470, 120 (2011).
- Yin et al. (1995) H. Yin, M. D. Wang, K. Svoboda, R. Landick, S. M. Block, and J. Gelles, Science 270, 1653 (1995).
- Wang et al. (1998) M. D. Wang, M. J. Schnitzer, H. Yin, R. Landick, J. Gelles, and S. M. Block, Science 282, 902 (1998).
- Nicklas (1983) R. B. Nicklas, J. Cell. Biol. 97, 542 (1983).
- Bryant et al. (2003) Z. Bryant, M. D. Stone, J. Gore, S. B. Smith, N. R. Cozzarelli, and C. Bustamante, Nature 424, 338 (2003).
- Koudelka et al. (2006) G. B. Koudelka, S. A. Mauro, and M. Ciubotaru, Prog. Nucleic. Acid. Res. Mol. Biol. 81, 143 (2006).
- Cheatham et al. (1999) T. E. Cheatham, III, P. Cieplak, and P. A. Kollman, J. Biomol. Struct. Dyn. 16, 845 (1999).
- Jorgensen et al. (1983) W. L. Jorgensen, J. Chandreskhar, J. D. Madura, R. W. Impey, and M. L. Klein, J. Chem. Phys 79, 926 (1983).
- Mazur (1997) A. K. Mazur, J. Comput. Chem. 18, 1354 (1997).
- Mazur (1999) A. K. Mazur, J. Chem. Phys. 111, 1407 (1999).
- Mazur (1998a) A. K. Mazur, J. Am. Chem. Soc. 120, 10928 (1998a).
- Mazur (1998b) A. K. Mazur, J. Phys. Chem. B 102, 473 (1998b).
- (70) See Appendix to this paper.
- Lu and Olson (2003) X.-J. Lu and W. K. Olson, Nucleic Acids Res. 31, 5108 (2003).
- Olson et al. (2001) W. K. Olson, M. Bansal, S. K. Burley, R. E. Dickerson, M. Gerstein, S. C. Harvey, U. Heinemann, X.-J. Lu, S. Neidle, Z. Shakked, et al., J. Mol. Biol. 313, 229 (2001).
- Lu et al. (1997) X. J. Lu, M. A. El Hassan, and C. A. Hunter, J. Mol. Biol. 273, 668 (1997).
- Lu and Olson (1999) X.-J. Lu and W. K. Olson, J. Mol. Biol. 285, 1563 (1999).
- Mathew-Fenn et al. (2008) R. S. Mathew-Fenn, R. Das, and P. A. B. Harbury, Science 322, 446 (2008).
- Mazur (2009c) A. K. Mazur, Phys. Rev. E 80, 010901 (2009c).
- Strick et al. (2000) T. Strick, J. Allemand, V. Croquette, and D. Bensimon, Prog. Biophys. Mol. Biol. 74, 115 (2000).
- Shibata et al. (1984) J. H. Shibata, J. Wilcoxon, J. M. Schurr, and V. Knauf, Biochemistry 23, 1188 (1984).
- Hogan and Austin (1987) M. E. Hogan and R. H. Austin, Nature 329, 263 (1987).
- Rhodes and Klug (1981) D. Rhodes and A. Klug, Nature 292, 378 (1981).
- Strauss et al. (1981) F. Strauss, C. Gaillard, and A. Prunell, Eur. J. Biochem 118, 215 (1981).
- McAteer et al. (1995) K. McAteer, P. D. Ellis, and M. A. Kennedy, Nucleic. Acids. Res. 23, 3962 (1995).
- Travers and Klug (1987) A. A. Travers and A. Klug, Philos. Trans. R. Soc. Lond. B. Biol. Sci. 317, 537 (1987).
- Yoon et al. (1988) C. Yoon, G. Privé, D. S. Goodsell, and R. E. Dickerson, Proc. Natl. Acad. Sci. U.S.A. 85, 6332 (1988).
- Quintana et al. (1992) J. R. Quintana, K. Grzeskowiak, K. Yanagi, and R. E. Dickerson, J. Mol. Biol. 225, 379 (1992).
- Takasuka and Stein (2010) T. E. Takasuka and A. Stein, Nucleic. Acids. Res. 38, 5672 (2010).
- Robertson (2005) K. D. Robertson, Nat. Rev. Genet. 6, 597 (2005).
- Arita et al. (2008) K. Arita, M. Ariyoshi, H. Tochio, Y. Nakamura, and M. Shirakawa, Nature 455, 818 (2008).
- Metivier et al. (2008) R. Metivier, R. Gallais, C. Tiffoche, C. L. Peron, R. Z. Jurkowska, R. P. Carmouche, D. Ibberson, P. Barath, F. Demay, G. Reid, et al., Nature 452, 45 (2008).
- Ho et al. (2008) K. L. Ho, I. W. McNae, L. Schmiedeberg, R. J. Klose, A. P. Bird, and M. D. Walkinshaw, Mol. Cell. 29, 525 (2008).
- Chodavarapu et al. (2010) R. K. Chodavarapu, S. Feng, Y. V. Bernatavichute, P.-Y. Chen, H. Stroud, Y. Yu, J. A. Hetzel, F. Kuo, J. Kim, S. J. Cokus, et al., Nature 466, 388 (2010).
- Bestor (1987) T. Bestor, Nucleic. Acids. Res. 15, 3835 (1987).
- Klimasauskas et al. (1994) S. Klimasauskas, S. Kumar, R. J. Roberts, and X. Cheng, Cell 76, 357 (1994).
- Li et al. (1999) X. Li, E. M. Eastman, R. J. Schwartz, and R. Draghia-Akli, Nat. Biotechnol. 17, 241 (1999).
- Lefstin and Yamamoto (1998) J. A. Lefstin and K. R. Yamamoto, Nature 392, 885 (1998).
- Meijsing et al. (2009) S. H. Meijsing, M. A. Pufall, A. Y. So, D. L. Bates, L. Chen, and K. R. Yamamoto, Science 324, 407 (2009).
- Mazur (2005) A. K. Mazur, J. Chem. Theory Comput. 1, 325 (2005).
- Arnott and Hukins (1972) S. Arnott and D. W. L. Hukins, Biochem. Biophys. Res. Commun. 47, 1504 (1972).
- Berendsen et al. (1984) H. J. C. Berendsen, J. P. M. Postma, W. F. van Gunsteren, A. DiNola, and J. R. Haak, J. Chem. Phys. 81, 3684 (1984).
- Dixit et al. (2005) S. B. Dixit, D. L. Beveridge, D. A. Case, T. E. Cheatham, III, E. Giudice, F. Lankas, R. Lavery, J. H. Maddocks, R. Osman, H. Sklenar, et al., Biophys. J. 89, 3721 (2005).
- Lankas et al. (2010) F. Lankas, N. Spackova, M. Moakher, P. Enkhbayar, and J. Sponer, Nucleic. Acids. Res. 38, 3414 (2010).
- Flyvbjerg and Petersen (1989) H. Flyvbjerg and H. G. Petersen, J. Chem. Phys. 91, 461 (1989).
- Frenkel and Smit (1996) D. Frenkel and B. Smit, Understanding Molecular Simulations. From Algorithms to Applications (Academic Press, New York, 1996).