Antiferromagnetic transitions in ‘-like’
Abstract
Recent studies have reported the existence of an epitaxially-stabilized tetragonal-like (‘-like’) monoclinic phase in thin-films with high levels of compressive strain. While their structural and ferroelectric properties are different than those of rhombohedral-like (‘-like’) films with lower levels of strain, little information exists on magnetic properties. Here, we report a detailed neutron scattering study of a nearly phase-pure film of -like . By tracking the temperature dependence and relative intensity of several superstructure peaks in the reciprocal lattice cell, we confirm antiferromagnetism with largely G-type character and = 324 K, significantly below a structural phase transition at 375 K, contrary to previous reports. Evidence for a second transition, possibly a minority magnetic phase with C-type character is also reported with = 260 K. The co-existence of the two magnetic phases in -like and the difference in ordering temperatures between -like and -like systems is explained through simple Fe-O-Fe bond distance considerations.
pacs:
75.25.-j,75.70.Ak,77.55.Nv,77.80.bnThe oxide-perovskite is the only known room temperature multiferroicCatalan and Scott (2009), with robust ferroelectricity below = 1103 K and long-wavelength cycloidal antiferromagnetism below = 643 K in bulk formRamazanoglu et al. (2011). A flurry of recent work indicates that thin films can exhibit large ferroelectric polarizationWang et al. (2003); Jang et al. (2008), novel magnetoelectric coupling effectsZhao et al. (2006) and a series of strain-induced phase transitions with the promise of compelling device applicationsBa et al. (2009); Zeches et al. (2009); Chen et al. (2010, 2011); Mazumdar et al. (2010); Christen et al. (2011). Currently there is particularly strong interest in the epitaxially-stabilized tetragonal-like (‘-like’) monoclinic phase of induced by large compressive strains. This Letter presents new experimental results on the nature of magnetism in essentially pure -like films, and shows that the structural and antiferromagnetic phase transitions are distinct from one another, contrary to previous reportsInfante et al. (2011); Ko et al. (2011).
Epitaxial strain is known to play a major role in determining properties of thin-film multiferroic materialsHaeni et al. (2004); Choi et al. (2004); Schlom et al. (2007). In , even the slight compressive strain afforded by epitaxial growth on substrates changes the structure from bulk rhombohedral to ‘-like’ monoclinic with a ratio near 1.03Wang et al. (2003). The large room temperature ferroelectric moment of bulk is retained, and with increasing strain the crucial out-of-plane ferroelectric moment is enhancedJang et al. (2008). Antiferromagnetic order is largely G-typeBea et al. (2007); Ke et al. (2010); Ratcliff et al. (2011) with a commensurability that depends on local structural considerationsRatcliff et al. (2011).
When the compressive strain exceeds 4.5 a new phase appears with a ratio near 1.25Ba et al. (2009); Zeches et al. (2009). This ‘-like’ phase can be thought of as a monoclinic distortion from a predicted meta-stable tetragonal phaseEderer and Spaldin (2005); Ricinschi et al. (2006); Hatt et al. (2010). It is now understood to be part of a sequence of phases in : with compressive strain the structural progression is rhombohedral – (-like) monoclinic – (-like) monoclinic – tetragonal , similar to what is observed at morphotropic phase boundaries in lead-based piezo-electric materialsChristen et al. (2011). As has recently been pointed out by Damodaran et al.Damodaran, et al. (2011), this response to strain is very different from that of a Poisson-like deformation. In a Poisson-like elastic regime, coherent strain between a film a substrate is only maintained up to a critical thicknessMatthews et al. (2011). , in contrast, responds via polymorphism similar to the epitaxial halidesFarrow (1983) or antimony, which can be epitaxially stabilized in the “grey tin” allotrope rather than the stable “white tin” phase in the bulkFarrow et al. (1981).
While the ferroelectric transition temperature, , of -like films decreases with compressive strainInfante et al. (2010), its value is unknown for -like . However, such films exhibit a structural phase transition between distinct -like monoclinic phases at 375 KSiemons et al. (2011); Infante et al. (2011); Kreisel et al. (2011); Liu et al. (2012), leading to the anticipation of strong coupling effects as the various transition temperatures become comparable.
Very little is known at this point about the magnetic properties of -like phase of , in large part because magnetometry studies of antiferromagnetic films are often inconclusive due to the strong diamagnetic response of substrate materials. First-principles calculations for films with 6 compressive strain found near-degenerate energy scales for G-type and C-type magnetic structures, where adjacent antiferromagnetic layers are stacked with spins antiparallel and parallel, respectivelyHatt et al. (2010). Such calculationsHatt et al. (2010); Dieguez et al. (2011) predict that structures with a large ratio, including the -like phase, should exhibit ground states with C-type antiferromagnetic orderDieguez et al. (2011). In contrast, a room temperature neutron diffraction measurement on one phase-pure -like film revealed a magnetic peak that is consistent with a G-type structureBa et al. (2009). Subsequent Mössbauer measurements have recently been used to infer an antiferromagnetic transition at = 360 20 KInfante et al. (2011), within error equal to the above-mentioned structural transition. This is remarkably lower than the transitions to G-type antiferromagnetism in -like films that occurs with near the bulk value of 643 KRatcliff et al. (2011); Infante et al. (2010).
In this Letter, we report elastic neutron scattering measurements in epitaxially-stabilized -like on which go beyond previous studies in several important ways and provide important new information about the nature of magnetism in this material. By measuring the temperature dependence of scattering at multiple half-integer Bragg positions, we confirm the existence G-type antiferromagnetism implied by earlier measurementsBa et al. (2009) and provide the first estimate of Nel temperature with neutrons: = 324 K. By additionally observing the T = 375 K structural transition in the same experiment, our data clearly demonstrate that the two transitions are in fact decoupled. We further present evidence for a second magnetic phase showing C-type antiferromagnetism at a lower temperature, demonstrating macroscopic phase co-existence in a -like film that does not contain the -like polymorph. Through a comparison of scattering intensities at several magnetic Bragg peaks, it is inferred that spins in the G-type structure lie in the plane of the film. Aided by Monte Carlo calculations, we show that the essential difference in the magnetism of -like and -like films can be understood using straightforward considerations of Fe-O-Fe bond distances.
An epitaxial film of thickness was grown on (001)-oriented substrates via pulsed laser deposition. (Pseudo-cubic notations are used throughout this Letter.) Details about the growth technique and conditions are described elsewhereChristen et al. (2011), as are extensive x-ray scattering investigations of the quality and structural evolution of the film investigated in the current LetterSiemons et al. (2011).
The data in Ref. Siemons et al., 2011 (obtained on the same sample studied here) show that the film consists only of -like (=1.23), a small () amount of a novel polymorph that reversibly arises below the T =375 K transition due to tiling considerations, a negligible () of polycrystalline bismuth oxide, and no measurable amount of the -like phase. This near phase purity contrasts some previous reports of films on , where a competing -like phase occupies up to 30–60 of the sample volumeZeches et al. (2009); Infante et al. (2011). Nonetheless, it is in agreement with numerous reports in the literature of up to 99 phase pure -like in samples of thickness 100nm or greaterBa et al. (2009); Siemons et al. (2011); Kreisel et al. (2011).
Neutron scattering measurements were performed using the HB1a Triple-Axis Spectrometer at the High-Flux Isotope Reactor in an elastic configuration with a fixed incident energy =14.7meV, pyrolytic graphite (PG) (002) monochromator and analyzer, instrument collimations 48′-48′-40′-60′, and higher order contamination removed by standard PG filters. The film was aligned in the (H H L) scattering plane. For measurements at temperatures ranging from 10 K to 375 K, the sample was mounted in a closed cycle refrigerator (CCR) in a can with thermal contact assured by He exchange gas. Additional measurements from 40 K to 435 K were done using a high-temperature CCR which lacked exchange gas and from 300 K to 500 K using a furnace. Where presented below, data from the furnace were scaled to match the data from the CCR as laid out in the supplementary material.
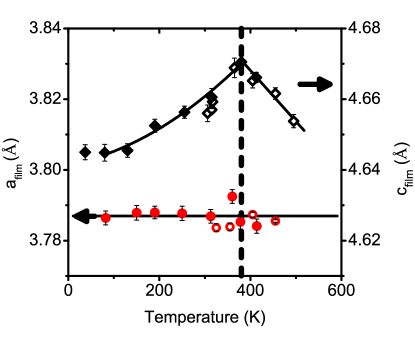
Neutron measurements confirmed that the film had a nearly tetragonal structure with the in-plane lattice constants epitaxially matched to the substrate. The room temperature lattice constants were = 3.79, = 4.66- consistent with the ratio for the -like phase reported by Christen et alChristen et al. (2011) and results from x-ray scattering on this sampleSiemons et al. (2011). Measurements of the film peak at (001) using both the high-temperature CCR and the furnace were used to track the evolution of the out-of-plane lattice parameter, , with temperature. The results, shown in Fig. 1, reveal a significant evolution of over the entire temperature range investigated, while the in-plane lattice parameter remained perfectly epitaxially matched to the substrate within resolution. A sharp cusp in the -temperature curve at K reflects the existence of a structural phase transition between different -like phases of , as reported in recent x-ray and Raman scattering studiesSiemons et al. (2011); Infante et al. (2011); Kreisel et al. (2011); Liu et al. (2012).
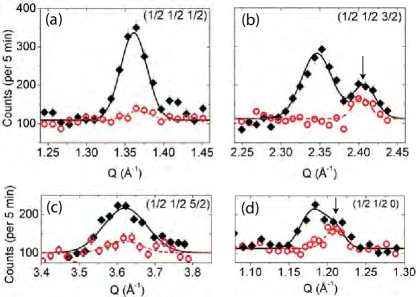
At low temperatures, neutron scattering showed superlattice peaks in the film at half-integer Bragg positions for the majority structural phase. The large ratio of the -like phase allows us to clearly distinguish between signal from it and one from, for example, a possible -like impurity phase that might have escaped our attention in x-ray scattering measurements. Most of the observed peaks were characteristic of G-type order: (), (), (), () and (). In addition, a peak was observed at the C-type wave-vector (). No significant signal was apparent at () or () positions, eliminating A-type antiferromagnetism. Fig. 2 shows radial scans across four peaks at temperatures above (370 K) and below (37 K) the Nel temperatures determined below. All panels show a significant increase of scattering intensity at low temperature. The weak peaks remaining at 370 K in panels (a) and (c) might arise from residual magnetic short range order or weak structural distortions. The temperature independent background peaks in panels (b) and (c) are powder diffraction lines of unknown origin; it has been confirmed that the background peak in panel (d) is dependent on the choice of sample environment.
Temperature dependent x-ray scattering confirmed that there is no structural transition in this sample between 300 K and 375 KSiemons et al. (2011). The neutron data presented in Fig. 1 suggest no major modifications of the film structure over the entire temperature range investigated. At low temperatures, the observed intensity at () is slightly less than 10 of that at (), consistent with expectations based on the magnetic form factor of Fe3+. Moreover, the intensity ratios of the half-integer peaks are inconsistent with any of the known common structural distortions observed in cubic perovskites. The limited data set available does not permit a complete refinement of the magnetic structure, however the relative intensities of different () peaks imply that moments of the G-type structure are confined to the plane of the film. To within the resolution of the present measurements, no modulation of the G-type structure is visible. As mentioned above, the emergence of a peak at the ( 0) Bragg position is at odds with a simple G-type picture. We further point out that the scattering at the () position is much too intense to be associated with the minority structural phase identified by x-ray scattering, which would appear an order-of-magnitude weaker in neutron scattering experiments. Since only one peak has been detected, one cannot definitively rule out a structural phase transition, albeit with no visible effect in the lattice parameters in Fig. 1. More likely is the onset of a co-existence of two distinct magnetic ordering patterns at lower temperatures, both within the majority -like structural phase. This latter possibility is consistent with the near-degeneracy of G-type and C-type structures in the ab-initio calculationsHatt et al. (2010). A comparison of the relative intensities of () and () peaks suggests that 15-30 of the sample volume contains C-type antiferromagnetism in this scenario, depending on the orientation of the ordered spins. As the widths of the superlattice peaks measured in low-order Brillouin zones are comparable to the width of the substrate (2 2 0) peak, it is not possible in the present experiment to infer further information about the magnetic domain sizes or correlation lengths.
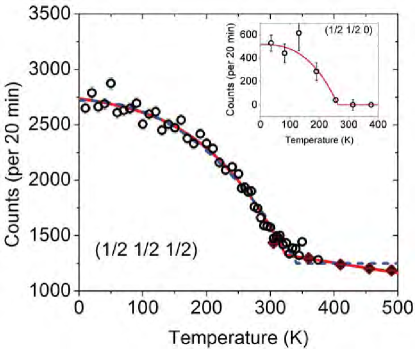
The magnetic transition temperature of the G-type order was determined from the measured intensity of the scattering at (), as shown in the main panel of Fig. 3. Data from both the CCR and furnace were fit phenomenologically to a power-law temperature dependence in the range 10KT. Particular attention was also given to the fits of background above the magnetic transition, as a small amount of temperature dependence was observed up to 500 K, possibly associated with critical correlations above a continuous phase transition. Specifically, fits were performed with either linearly sloping or flat background. The former fit, shown as a solid line in Fig. 3, provides the superior description of the data and implies a transition temperature of = 323 4 K. We believe this to be the most reliable estimate of , however it should be noted that the fit with background held constant (dashed line in Fig. 3) yields = 341 3K. The difference in these values reflects the magnitude of systematic error that might arise from different choices of background, and in fact these values may be taken as upper and lower bounds of reasonable estimates of TN. For example, if a flat background is used and temperatures where the curve is concave-up are excluded, fits imply = 327 5 K. All values represent a significant decrease from the Nel temperatures reported for bulk (643 K)Catalan and Scott (2009) and -like films (600 - 650 K)Infante et al. (2010). The magnetic transition is also clearly distinct from the structural transition identified in Fig. 1, in contrast to some previous reportsInfante et al. (2011); Ko et al. (2011). The temperature dependence of the () peak intensity, shown in the inset of Fig. 3, suggests that the C-type order is seen only at temperatures below = 264 12 K. (Error bars are statistical and do not include possible sources of systematic errors.) No change is seen in the intensity of the () scattering at .
Simple considerations can provide insight into the different magnetic properties of the -like and -like phases of . Transition metal pseudopotential theoryHarrison (1989) predicts that the hopping matrix elements between the -orbitals of Fe and the -orbitals of O scale with the Fe-O interatomic distance as . Since perturbation theory near the atomic limit predicts that the Fe-Fe Heisenberg superexchange depends on via , then overall varies as . Using the known structuresChristen et al. (2011) and normalizing by the in-plane exchange constant of -like , this criterion implies that the -like superexchange is characterized by the parameters ==1.0 and out-of-plane =0.87, while the -like superexchange is characterized by =1.43, =2.41, and =0.10. Although the precise results will be modified by additionally considering true bond angles, it is immediately apparent that the interactions in -like are expected to be much more two-dimensional than the interactions in the -like material. Even though the in-plane values of exchange are higher for the -like phase, our data imply that the net result is a suppression of magnetic order to much lower temperatures.
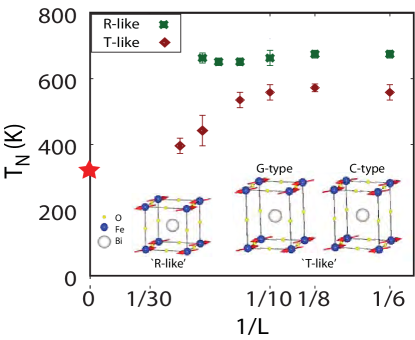
To explore this idea further, we have performed Monte Carlo simulations of the two cases utilizing an anisotropic classical Heisenberg Hamiltonian with exchange couplings in the ratios discussed above. Calculations were carried out on a set of LLL sized tetragonal lattices, with transition temperatures determined by examining the staggered magnetization, susceptibility and heat capacity. The precise magnitude of the superexchange was scaled to match the observed Nel temperature of the -like films, 643 K. Fig. 4 plots the variation of for the two cases with the Monte Carlo system size, L. The convergence to the bulk limit is much slower for the -like system, as expected because of its lower effective dimensionality. However, the present Monte Carlo results are sufficient to show that the ordering for the -like phase will occur at a substantially lower temperature than for the -like phase, in qualitative agreement with the experimental observations.
The weak inter-planar coupling of -like also offers some insight into the possible co-existence of G-type and ( 0) C-type antiferromagnetism at low temperatures. Both structures (illustrated in Fig. 4) are characterized by an antiferromagnetic arrangement of spins in the a-b plane, where the three-dimensional G-type structure is realized by antiferromagnetic stacking and C-type by ferromagnetic stacking along (00L). With very weak inter-planar interactions, one can easily suppose that small differences in local structure or impurities can lead to either state, and this is consistent with the findings of ab-initio calculations that the energy differences are very small and may in fact favor C-type order.
In summary, the results presented here shed light on the physics of the epitaxially-stabilized -like monoclinic phase of which only exists in samples with high levels of compressive strain. Our film grown on is nearly crystallographically phase pure, but gives evidence for phase co-existence of G-type and C-type antiferromagnetic order parameters. We estimate magnetic ordering temperature = 323 4 K for the G-type order, which is distinct from the structural phase transition seen at higher temperature and more than a factor of two lower than similar order seen in -like films. We attribute this large reduction mainly to a reduced dimensionality associated with increased Fe-Fe distances in the out-of-plane direction.
Research supported by the U. S. Department of Energy, Basic Energy Sciences. HMC, WS, JLZ, ED and SL were supported by the Materials Science and Engineering Division, and GJM and SEN were supported by the Scientific User Facilities Division. Experiments were performed at the High Flux Isotope Reactor and the Center for Nanophase Materials Sciences, which are sponsored by the Scientific User Facilities Division.
References
- Infante et al. (2011) I. C. Infante et al., Phys. Rev. Lett. 107, 237601 (2011).
- Ko et al. (2011) K. T. Ko et al., Nature Comm. 2, 567 (2011).
- Catalan and Scott (2009) G. Catalan and J. F. Scott, Adv. Mater. 21, 2463 (2009).
- Ramazanoglu et al. (2011) See e.g. M. Ramazanoglu, W. Ratcliff II, Y. J. Choi, Seongsu Lee, S.-W. Cheong, and V. Kiryukhin, Phys. Rev. B 83, 174434 (2011).
- Wang et al. (2003) J. Wang et al., Science 299, 1719 (2003).
- Jang et al. (2008) H. W. Jang et al., Phys. Rev. Lett. 101, 107602 (2008).
- Zhao et al. (2006) T. Zhao et al. Nature Mater. 5, 823 (2006).
- Ba et al. (2009) H. Ba et al., Phys. Rev. Lett. 102, 217603 (2009).
- Zeches et al. (2009) R. J. Zeches et al., Science 326, 977 (2009).
- Chen et al. (2010) Z. Chen et al., Appl. Phys. Lett. 96, 252903 (2010).
- Chen et al. (2011) Z. H. Chen et al., Adv. Funct. Mater. 21, 133 (2011).
- Mazumdar et al. (2010) D. Mazumdar et al., Nano Lett. 10, 2555 (2010).
- Christen et al. (2011) H. M. Christen, J. H. Nam, H. S. Kim, A. J. Hatt, and N. A. Spaldin, Phys. Rev. B 83, 144107 (2011).
- Haeni et al. (2004) J. H. Haeni et al., Nature 430, 758 (2004).
- Choi et al. (2004) K. J. Choi et al., Science 306, 1005 (2004).
- Schlom et al. (2007) D. G. Schlom, L.-Q. Chen, C.-B. Eom, K. M. Rabe, S. K. Streiffer, and J.-M. Triscone, Annu. Rev. Mater. Res. 37, 589 (2007).
- Bea et al. (2007) H. Ba, M. Bibes, S. Petit, J. Kreisel, and A. Barthlmy, Phil. Mag. Lett. 87, 165 (2007).
- Ke et al. (2010) X. Ke, P. P. Zhang, S. H. Baek, J. Zarestky, W. Tian, and C. B. Eom, Phys. Rev. B 82, 134448 (2010).
- Ratcliff et al. (2011) W. Ratcliff II et al., Adv. Funct. Mater 21, 1567 (2011).
- Ederer and Spaldin (2005) C. Ederer and N. A. Spaldin, Phys. Rev. Lett. 95, 257601 (2005).
- Ricinschi et al. (2006) D. Ricinschi, K. Y. Yun, and M. Okuyama, J. Phys.: Condens. Matter 18, L97 (2006).
- Hatt et al. (2010) A. J. Hatt, N. A. Spaldin, and C. Ederer, Phys. Rev. B 81, 054109 (2010).
- Damodaran, et al. (2011) A. R. Damodaran, S. Lee, K. Jambunathan, S. MacClaren, and L. W. Martin, eprint arXiv:1110.3847 (2011).
- Matthews et al. (2011) J. W. Matthews, and A. E. Blakeslee, J. Cryst. Growth 27, 118 (1974).
- Farrow (1983) R. F. C. Farrow et al., J. Vac. Sci. Tech. B 1, 222 (1983).
- Farrow et al. (1981) R. F. C. Farrow et al., J. Cryst. Growth 54, 507 (1981).
- He et al. (2011) Q. He et al., Nature Comm. 2, 225 (2011).
- Infante et al. (2010) I. C. Infante et al., Phys. Rev. Lett. 105, 057601 (2010).
- Siemons et al. (2011) W. Siemons, M. D. Biegalski, J. H. Nam, and H. M. Christen, Appl. Phys. Express 4, 095801 (2011).
- Kreisel et al. (2011) J. Kreisel et al., J. Phys.: Condens. Matter 23, 342202 (2011).
- Liu et al. (2012) H.-J. Liu et al., Phys. Rev. B 85, 014104 (2012).
- Dieguez et al. (2011) O. Dieguez, O. E. Gonzalez-Vazquez, J. C. Wojdel, and J. Iniguez, Phys. Rev. B 83, 094105 (2011).
- Harrison (1989) W. A. Harrison, Electronic Structure and the Properties of Solids,, Chapter 19(Dover, New York, 1989).
SUPPORTING INFORMATION
1 Sample Characterization
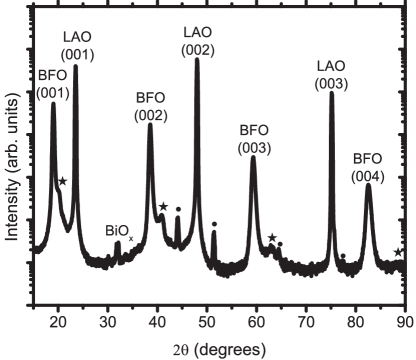
The epitaxial film of the current study was grown on (001)-oriented substrates via pulsed laser deposition. Thickness was determined to be 300nm ( 20) from the spacing of x-ray thickness fringes and growth rate calculations. The sample was then characterized using a PANalytical X’Pert 4-circle thin-film x-ray diffractometer using Cu-K radiation and with the sample mounted on an Anton-Paar heated stage. The resultant data have largely been published and discussed at length in Reference Siemons et al., 2011. A single x-ray pattern taken at room temperature is reproduced in Fig. 1 for the purpose of demonstrating sample quality. As is easily seen, x-ray scattering data indicate that the film consists almost entirely of the -like monoclinic phase of , with =1.23. Impurity phases are reduced by nearly two orders of magnitude (note the logarithmic scale in Fig. 1), and consist of a small () amount of a novel -like polymorph of that reversibly arises below the T =375 K transition from tiling considerations (see Ref. Siemons et al., 2011) and a negligible () amount of polycrystalline bismuth oxide. There is no measurable amount of the -like phase of , which would manifest as peaks nearer to those of with =1.03.
2 Sample Environments and the Scaling of Data Sets.
Neutron scattering data presented in the main article were obtained using three separate sample environments for controlling temperature over the range 10-500K: a high-temperature closed-cycle refrigerator (CCR) over the range 40-400 K, a high-temperature furnace over the range 300-500 K, and a low-temperature CCR with exchange gas which covered the range 10-370 K. It was demonstrated in Figure 1 of the main article that both data from the furnace and high-temperature CCR reflect the existence of the structural phase transition previously observed by x-ray scattering and can be used to independently verify the structural transition temperature of 380 K. As the measurements of the c-axis lattice parameter were measured on warming in the high-temperature CCR and upon cooling in the furnace, this further demonstrates that there is minimal hysteresis for this transition in our sample. In neither of these high-temperature sample environments is there any signature of magnetism at or appearing immediately below the structural transition temperature.
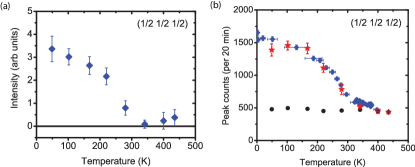
A measure of the Nel temperature for the G-type antiferromagnetically ordered phase can be determined independently using each of the three data sets and the estimates are found to be consistent with one another. One example is shown in Fig. 2(a), where plotted versus temperature is the integrated intensity of the () magnetic Bragg peak as measured via radial scans on warming in the high-temperature CCR. It is clear from this data that is above room temperature and no larger than 340 K, consistent with the analysis presented in the main text (see Fig. 3 of the main Letter). To check for possible hysteresis effects, which would imply a lower , we plot in Fig. 2(b) the peak height extracted from the same radial scans and compare to measurements of the scattering intensity measured while cooling in the same sample environment. The two data sets agree over an extended temperature range, implying that for this transition as well hysteresis is minimal.
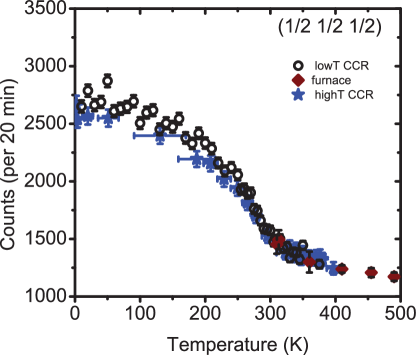
For direct comparison of the different data sets, one can also scale data according to:
| (1) |
where accounts for differing effective scattering volume between separate measurements and is associated with sample-independent sources of scattering background. Fig. 3 demonstrates the result scaling data from all three sample environments to match those taken in the low-temperature CCR. Here, was chosen to be the temperature independent part of the Q-independent background extracted from radial scans across the magnetic Bragg peak; this is a valid assumption since incoherent scattering in both and is minimal. The scaling factors were chosen by comparing nuclear Bragg peak intensities of the film near room temperature, and was chosen such that magnetic data were consistent at T=370K (). Solid and dashed lines are the fits described in the main text. Of immediate note is that at high temperature all of the scattering data are consistent and imply a similar magnetic transition temperature. At lower temperatures, the scattering measured using the high-temperature CCR is systematically lower than what is measured in the low-temperature CCR. We attribute this to inefficient cooling of the sample in the high-temperature displex, expected in this sample environment at low temperatures due to the lack of exchange gas.
3 Determining the Neel Temperature
When estimating in the main article, our analysis focussed on data obtained using the low-temperature CCR instead of the high-temperature CCR data plotted in Figure 2. This was because the low-temperature CCR data was deemed more reliable, due to both the large uncertainty in temperature during the high-T CCR measurements and the existence of helium exchange gas in the low-temperature apparatus. We additionally note the temperature-dependent scattering at the () position apparent in all of our data up to 500 K. This might represent short-range critical correlations, which must exist above a continuous phase transition. In modeling the temperature dependence of this short-range scattering, we have considered the cases of a linearly varying background, a temperature independent (flat) background and a flat background with the critical region excluded from fits.
In this section, we demonstrate directly that neither the choice of data set nor specific modeling of the background temperature dependence has a significant effect on conclusions of the current paper. Data from different sample environments were fit phenomenologically, assuming the follow form for magnetic scattering:
| (2) |
with and as fit parameters and determined by data at temperatures T380 K. Table 1 displays the results of this analysis, giving the inferred value of and quality of fit parameter for each scenario. Error bars reported here are statistical, arising from fits and not accounting for possible systematic effects. This is an especially relevant concern when considering data taken in the high-temperature CCR, as the measurements were almost certainly taken in non-equilibrium conditions due to equipment failure. One can see, however, that each fit in Table 1 implies a transition temperature in the range 322 356 K. Even the highest estimate of is found to be 5 standard deviations below the known structural transition temperature at 375 K. If one excludes the less reliable high-T CCR data, this range is even more restrictive: 322 341 K. For every choice of data subset, the fits assuming sloping background were found to describe the data best. It is worth further noting that for these fits, there is very little variation in inferred among data sets. Our best estimate of Nel temperature is thus determined to be = 3234 K.
| Data set | BG function | (K) | |
|---|---|---|---|
| L | s | 3253 | 2.14 |
| L+F | s | 3244 | 1.90 |
| H | s | 3237 | 0.99 |
| H+F | s | 3225 | 0.87 |
| H+L+F | s | 3243 | 1.77 |
| L | fl | 3423 | 2.78 |
| L+F | fl | 3413 | 2.61 |
| H | fl | 3564 | 1.23 |
| H+F | fl | 3564 | 1.36 |
| H+L+F | fl | 3442 | 2.4 |
| L | fl-x | 3275 | 1.67 |
| L+F | fl-x | 3275 | 1.69 |
| H | fl-x | 32912 | 1.20 |
| H+F | fl-x | 32912 | 1.29 |
| H+L+F | fl-x | 3254 | 1.70 |
References
- Siemons et al. (2011) W. Siemons, M. D. Biegalski, J. H. Nam, and H. M. Christen, Appl. Phys. Express 4, 095801 (2011).