On the Extended Emission Around the Anomalous X-ray Pulsar 1E 1547.0–5408
Abstract
We present an analysis of the extended emission around the anomalous X-ray pulsar 1E 1547.05408 using four XMM-Newton observations taken with the source in varying states of outburst as well as in quiescence. We find that the extended emission flux is highly variable and strongly correlated with the flux of the magnetar. Based on this result, as well as on spectral and energetic considerations, we conclude that the extended emission is dominated by a dust-scattering halo and not a pulsar wind nebula (PWN), as has been previously argued. We obtain an upper limit on the 2–10 keV flux of a possible PWN of , three times less than the previously claimed value, implying an efficiency for conversion of spin-down energy into nebular luminosity of (assuming a distance of 4 kpc). We do, however, find strong evidence for X-ray emission from the supernova remnant shell surrounding the pulsar, as previously reported.
1 Introduction
Anomalous X-ray pulsars (AXPs) and soft gamma repeaters (SGRs) are generally accepted as belonging to the class of neutron stars known as ‘magnetars.’ These sources are characterized by long (2–12 s) spin periods and spin-down rates that imply extremely high surface dipole magnetic fields of (see Woods & Thompson 2006 and Mereghetti 2008 for reviews). It is thought that their large X-ray luminosities are powered by the decay of these powerful magnetic fields, and fracturing of the crust and reconfiguration of the magnetic field lines produce the glitches, bursts, and X-ray variability seen in these sources (Thompson & Duncan, 1995, 1996; Thompson et al., 2002).
One important open question regarding AXPs and SGRs is whether they produce particle outflows akin to those seen in conventional rotation-powered pulsars. The latter are well known to produce often spectacular ‘pulsar wind nebulae’ (PWNe), the classic example of which is the Crab Nebula (see, e.g., Kaspi et al., 2006; Gaensler & Slane, 2006; Kargaltsev & Pavlov, 2008, for reviews). Such nebulae, evident particularly at radio and X-ray energies, are the result of synchrotron emission due to pulsar-produced relativistic electrons and positrons, as they spiral in the ambient magnetic field. Given the large magnetic energy reservoir hypothesized to exist in AXPs and SGRs, particle outflows seem reasonable to consider, and indeed have been suggested to be present ubiquitously in magnetars, either in continuous or sporadic forms (Thompson & Blaes, 1998; Harding et al., 1999). This idea was initially buoyed by the claim of an apparent wind nebula associated with SGR 180620 (Murakami et al., 1994). Although the latter association was later disproved (Hurley et al., 1999), the possibility of a nebula-producing magnetar wind has not been. Extended radio emission was unambiguously identified following one SGR giant flare (Gaensler et al., 2005; Taylor et al., 2005; Gelfand et al., 2005; Fender et al., 2006), but is thought to be from relativistic, weakly baryon-loaded magnetic clouds (Lyutikov, 2006) or from a baryonic outflow (Gelfand et al., 2005; Gelfand, 2007), and associated exclusively with the flare. Recently Rea et al. (2009) have suggested that an unusual X-ray nebula surrounding the relatively high- Rotating Radio Transient (RRAT) J18191458 is magnetically powered, though the mechanism for this is unclear.
The X-ray source 1E 1547.05408 was discovered with the Einstein X-ray satellite in 1980 by Lamb & Markert (1981), but only recently was it suggested to be a magnetar candidate on the basis of its spectrum, variable nature, and likely association with the supernova remnant (SNR) shell G327.24–0.13 (Gelfand & Gaensler, 2007). Radio observations of the source by Camilo et al. (2007) revealed pulsations at a period of 2.1 s and the measured spin-down rate implied a surface magnetic field strength of and a spin-down luminosity of . 1E 1547.05408 is thus the fastest-rotating and highest- magnetar yet known.111See the McGill SGR/AXP Online Catalog at http://www.physics.mcgill.ca/~pulsar/magnetar/main.html. Although observations in 2006 showed the source to be in quiescence, a 2007 XMM-Newton observation showed it to be in a high, apparently post-outburst state (Halpern et al., 2008). In 2008 October and again on 2009 January 29, 1E 1547.05408 underwent strong outburst events, experiencing dramatic increases in its X-ray luminosity and exhibiting many SGR-like bursts within a few hours. For further details on these outbursts and the source’s history, see Israel et al. (2010), Kaneko et al. (2010), Ng et al. (2011), Bernardini et al. (2011), Scholz & Kaspi (2011), and Dib et al. (2011).
In observations of 1E 1547.05408 taken with Swift and XMM-Newton following the 2009 outburst, Tiengo et al. (2010) observed dust-scattering X-ray rings centered on the magnetar and derived from them a source distance of 4–5 kpc. They also found evidence of time variable diffuse emission around the source which they attributed to dust scattering of the bursts and of the persistant X-ray emission.
Meanwhile, Vink & Bamba (2009, hereafter VB09), analyzing Chandra and XMM-Newton observations of the source taken in 2006 when it was in quiescence, detected extended emission and characterized it as the result of a PWN, in analogy with those seen around rotation-powered pulsars. They argued for a PWN based on the high flux level of the extended emission, and because it appeared to have a harder spectrum than the point source. This would make 1E 1547.05408 unusual among the known magnetars, as no other such source has been shown to power such emission. They also showed the presence of extended X-ray emission coincident with the SNR shell.
Here we present an analysis of the extended emission around 1E 1547.05408 using multi-epoch XMM data, in which the source flux varies strongly, as does the putative nebular emission. We show conclusively that the putative PWN reported by VB09 is in fact dominated by dust scattering, rather than by emission from any pulsar outflow.
2 Observations
We obtained an observation of 1E 1547.05408 with the XMM-Newton Observatory on 2010 February 10 in order to track the star’s properties as it decayed to quiescence after the 2009 outburst. We also reanalyzed three archival XMM-Newton observations of the source: one in 2006 with the source in quiescence, the 2007 post-outburst observation, and one taken 2 weeks after the 2009 outburst. For each observation, the data from the two EPIC MOS cameras (Turner et al., 2001) were not suitable for our analysis, either because the operating mode provided too small a field of view or because the data were highly piled-up. We therefore restricted our analysis to data from the EPIC pn camera (Strüder et al., 2001), which had no such issues. The data from all four observations were analyzed using the XMM-Newton Science Analysis System (SAS) version 10.0.2222See http://xmm.esac.esa.int/sas/10.0.0/ with calibrations updated 2010 July 29. Each observation was filtered for times of strong background flaring that sometimes occur in XMM-Newton data, and two bursts were removed from the 2009 data. Details of each of the four observations, including the total pn exposure time after removing the bad time intervals, are listed in Table 1.
3 Imaging Analysis and Results
In order to search for and characterize any extended emission around 1E 1547.05408, we began by removing all point sources detected in the field of each observation other than the magnetar, as well as the out-of-time pn events present in the 2009 observation. To construct a radial profile, we extracted events from concentric annuli having width centered on the position of the star, as determined by a standard centroid search algorithm. The number of counts in each bin was divided by both the geometric area of each extraction region and the mean exposure time therein as determined from the unvignetted exposure map. This procedure corrects for the chip gaps, dead pixels, and removed regions on the detector.
The radial profile of a point source in XMM-Newton is given by the energy-dependent, radially averaged point-spread function (PSF). Using the SAS task eradial we extracted from instrument calibration files the theoretical PSF at 1 keV energy intervals from 1 to 12 keV for each observation. These component PSFs were weighted such that the PSF at energy was given the weight , where is the total number of counts within of the source position. They were then summed to produce a weighted PSF, . Finally, by scaling using the formula
we created an expected point-source radial profile for each observation. Here, is a spatially uniform background count rate found by averaging the count rate in all the bins of the observed profile a sufficient distance away from the source. The normalization factor was derived via a least-squares fit of to the first five bins of the observed radial profile, under the assumption that the contribution of any extended emission to the profile in that region would be minimal. We found, however, that the least-squares fit tended to be poor, especially for the observations with higher count rate and thus better statistics. This suggested that the uncertainty on based on the was not reliable because of additional systematic errors affecting the fit. For example, in addition to possible contamination by extended emission, the size chosen for the radial bins oversamples the square pixels of the pn detector. Therefore, in order to better estimate the uncertainty, we obtained a range of possible values for by making a least-squares fit of to any four of the first five and any five of the first six bins of the observed profile. Our uncertainty estimate was then given by .
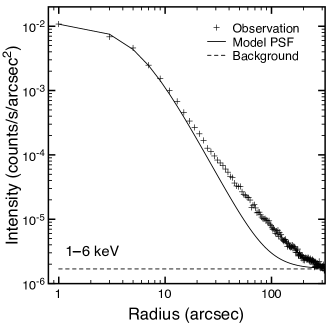
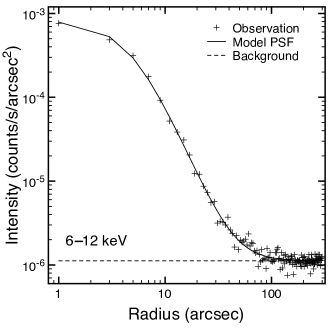
The 2010 radial profiles of 1E 1547.05408 in the 1–6 keV and 6–12 keV energy bands are shown in Figure 1. Below 6 keV the observed profile has a significant excess of counts over the expected point-source profile, extending out to ; conversely, above 6 keV no excess is detected and the observed profile is consistent with a point source. Radial profiles constructed from the three archival data sets display similar results, although the shape and extent of the excess vary among the observations, and the three dust-scattering rings reported in Tiengo et al. (2010) are visible in the 2009 data. We therefore confirm the presence of extended emission around 1E 1547.05408 below 6 keV as previously reported by VB09 and Tiengo et al. (2010). We also find that the extended emission is brighter at low energies (3 keV), in line with the soft spectrum reported by VB09.
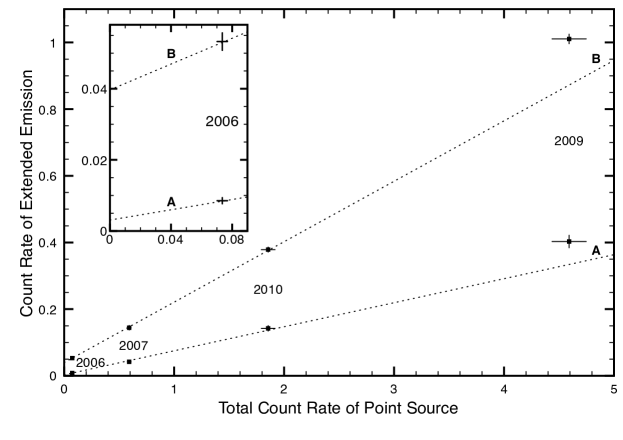
In Figure 2, we plot the 1–6 keV count rate of the extended emission, , as a function of the total background-subtracted point-source count rate, , for two regions: region A, an annulus centered on the source with radius ; and region B, a similar annulus but with radius . In both regions we find a tight correlation between the two quantities; in fact, the first three points (2006, 2007, and 2010) fit well to a straight line, although the fourth point (2009) lies above the extrapolated linear fit in both regions A and B (but see Section 4.2). The extended emission flux varies wildly between observations, increasing and decreasing along with the flux of the pulsar. For example, in region A the extended emission brightened by a factor of nearly 50 between the 2006 and 2009 observations, and by the following year it had faded by almost a factor of three.
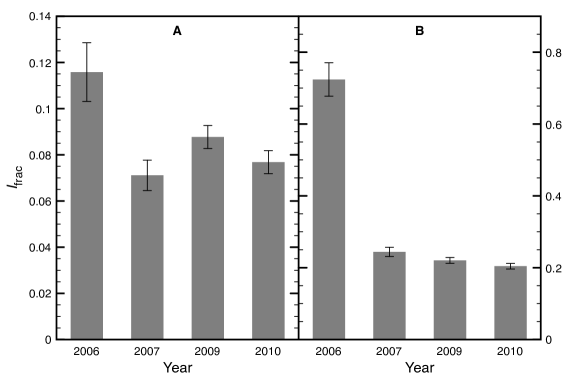
Figure 3 shows the fractional intensity of the extended emission, in regions A and B for all four observations of 1E 1547.05408. The most prominent feature in both regions is that in 2006 is notably higher than in the other three observations, particularly in region B.
3.1 Spectral Analysis
Because of contamination from the broad wings of the XMM-Newton PSF, we could not simply extract spectra of the extended emission from regions A and B. For example, in each observation, less than half of the total background-subtracted counts found in region A were contributed by the extended source. Therefore, we instead computed a simple hardness ratio for the extended emission, , and we list in Table 2, for all four observations, these hardness ratios in regions A and B. For comparison, the table also lists the hardness ratio of the point source, , where is the background-subtracted count rate within of the source position.
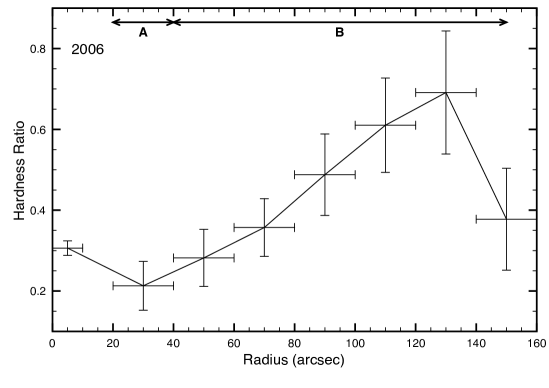
We find that in region A, for all four observations, meaning that the extended emission has a softer spectrum than the point source, although in 2006 the hardness ratio is smaller by only . In region B, the results are the same as above for all but the 2006 observation, where the extended emission spectrum is instead harder than the source spectrum. This behavior is further illustrated in Figure 4, which shows the 2006 hardness ratio of the extended emission as a function of distance from the source, beginning at (the first bin provides the hardness ratio of the point source itself).
Finally, assuming an absorbed power-law spectrum, the hardness ratios in Table 2 can be used to constrain the photon index and the flux of the extended emission. For example, taking as in VB09, we find that the 2–10 keV unabsorbed flux of the extended emission in region A varied from a minimum of (for ) in 2006 to a maximum of (for ) in 2009.
4 Discussion
Our analysis has confirmed the presence of extended emission around 1E 1547.05408, visible in four observations taken at very different stages of its flux history. VB09 previously detected extended emission around this source based primarily on a 2006 Chandra observation and interpreted it as a PWN and, farther out, the X-ray counterpart of SNR G327.24–0.13. Here we reexamine this interpretation in light of our new data.
4.1 A Pulsar Wind Nebula?
In the context of conventional rotation-powered pulsars, given the low spin-down power of 1E 1547.05408, we generally would not expect it to harbor a bright PWN in X-rays. For erg s-1, the typical X-ray efficiency of a PWN is about (Kargaltsev & Pavlov, 2008). Even allowing for the X-ray efficiency to be up to an order of magnitude greater, this predicts an unabsorbed PWN flux of erg s-1 cm-2 in the 0.5–8 keV range for 1E 1547.05408. On the other hand, the putative PWN as suggested by VB09 has an unabsorbed flux of erg s-1 cm-2 in the same band. Thus, if the extended emission is entirely rotation-powered, this would require an unusually high X-ray efficiency of over 1%. This problem could be alleviated, however, by hypothesizing that magnetic power could be contributing to the nebula, as has been suggested by Rea et al. (2009) for RRAT 18191458.
However, another issue is the soft spectrum of the putative PWN. The hardness ratios in Section 3.1 suggest a power-law spectrum with photon index , a range that is consistent with the value reported in VB09 . This is much softer than previously reported PWNe, which typically have (Kargaltsev & Pavlov, 2008), although VB09 proposed that the discrepancy could be explained as being somehow a result of the magnetar nature of 1E 1547.05408.
A more pressing problem with the PWN interpretation is its failure to explain the strong flux correlation seen in Figure 2. First, PWNe in rotation-powered pulsars have not been seen to have large luminosity variations as are observed for 1E 1547.05408. Even if energy injection due to outbursts played a role, we show here that the observed fading time is incompatible with a synchrotron origin. First, to estimate the magnetic field strength in the putative PWN, we consider as an analogy the 2004 flare of SGR 180620, which was accompanied by nebular radio emission. In that event, a total energy of erg was released (Palmer et al., 2005). Lyutikov (2006) proposed that the event could produce relativistic, weakly baryon-loaded magnetic clouds analogous to a solar coronal mass ejection, and deduced a total energy of erg for the relativistic electrons plus magnetic field, with an average magnetic field of 0.1 G within a radius cm. As the nebula expands, the field strength decays with the volume as or , depending on whether the field is tangled (Gaensler et al., 2005). Assuming the former case, we have scaled these values to those appropriate for the properties of 1E 1547.05408 and find a conservative -field estimate of G at , which corresponds to cm from the source. We note that the -field is much lower for the latter field decay case. The synchrotron cooling timescale is then for particles emitting at =6 keV. This is incompatible with the flux decay timescale observed and shown in Figure 2, in particular between 2009 and 2010.
The above theory suggests that the particle energy was about 4% of the burst fluence for SGR 180620. The total burst fluence for the 2009 event of 1E 1547.05408 was measured to be erg by Mereghetti et al. (2009), and estimated to be in the range erg by Tiengo et al. (2010). Taking the uppermost value of erg would give an injected particle energy of erg. Assuming this results in synchrotron emission from the radio regime up to 6 keV, with a typical photon index of 1.5, we find a power of , corresponding to a flux of between 1 and 6 keV. This is well below the observed extended emission flux in 2009.
4.2 Dust-scattering Halo
Extended emission around an X-ray source can be produced by the scattering of X-rays off dust particles between the source and observer. The flux of such a dust-scattering halo is expected to be proportional to the source flux (Mathis & Lee, 1991). Returning to Figure 2, then, for a dust-scattering halo, all of the points should fit well to a straight line (allowing for some scatter because the source spectrum did not remain constant). This is indeed the case for the first three points, although the 2009 point lies above the linear fit. In order to fit with the linear trend, the 2009 source flux would have to be 15%–20% higher than what we observed. However, because the scattered photons in a dust halo travel a longer path than photons observed directly from the source, the halo flux depends in a complicated manner on the recent history of the source flux over a period of hours or days (Mauche & Gorenstein, 1986). The 2009 XMM observation of 1E 1547.05408 was taken only 13 days after its January outburst, at which time the magnetar’s flux was decaying following a power law of index to (Bernardini et al., 2011; Scholz & Kaspi, 2011). As a result, the source would have been bright enough to produce the observed halo 4.5–5.5 days prior to the observation, not an unreasonable timescale for the evolution of a dust halo. We therefore conclude that the observed variability in the extended emission flux is entirely consistent with a dust-scattering halo.
VB09 rejected the dust-scattering halo interpretation of the extended emission based on two arguments. The first one is that the extended emission around 1E 1547.05408 had a harder spectrum than the source itself. A dust halo, on the other hand, is expected to have a softer spectrum than the source because the scattering cross section has an inverse-square dependence on energy. From the hardness ratios in Table 2 we find that, contrary to the claim by VB09, the extended source in region A has an unambiguously softer spectrum than the magnetar in 2007, 2009, and 2010, supporting the interpretation of dust scattering. In 2006, the hardness ratios suggest a softer spectrum too, although the difference is not statistically significant. For comparison, though, VB09 reported that the photon index of the ‘PWN’ differed from that of the point source by only , which is not statistically significant either. We cannot, therefore, conclude that the spectrum of the extended emission in region A supports either interpretation in 2006. It should be noted, however, that be it harder or softer than the point source, the extended emission in 2006 still has a much softer spectrum than any previously reported PWN, as discussed above.
Table 2 also indicates similar results for region B as in region A. The extended emission shows a softer spectrum than the magnetar in all observations except 2006. Again, we note that although the extended emission spectrum is harder than the point source in 2006, it is still very soft overall.
Our investigations so far strongly support that the extended emission observed around 1E 1547.05408 in regions A and B is dominated by a dust-scattering halo, at least in 2007, 2009, and 2010, although this interpretation is less clear in 2006. We now examine the other argument given in VB09 against dust scattering: that the extended emission was too bright, especially above 3 keV, to be a dust halo. They estimated the expected fractional halo intensity and the dust-scattering optical depth based on models by Predehl & Schmitt (1995) and Draine (2003), which depend on the absorption column , the X-ray energy , and a parameter describing the distribution of the dust between source and observer. Following a similar procedure, we assumed an effective energy for the 1–6 keV photons based on the spectrum of the magnetar, took (meaning most of the dust is close to the source) and , as in VB09, and calculated for regions A and B. This gives for region A and for region B, which are in a good agreement333In region B, the calculated is actually below the observed value by . However, if we subtract the non-dust contribution to the extended emission from the SNR (see below and Table 3) then the two values are in full agreement. with the 2010 values in Figure 3, suggesting that dust scattering is adequate to explain the brightness of the extended emission, at least in 2010. For pure dust scattering we expect in each region to be the same for each observation, except in 2009 where it should be higher due to source variability as discussed above. Indeed, there is a good agreement between the 2007, 2009, and 2010 observations, but the 2006 value of stands out. In region A, it is higher than what is expected from the 2007 and 2010 data, and in region B an even larger increase is evident, with being higher in 2006 than in any subsequent observation.
The best explanation for all of our results is that the extended emission around 1E 1547.05408 consists of a dust-scattering halo plus an additional component independent of the source flux. This secondary component is significant mainly in region B and becomes noticeable only when the halo is faint, as is the case for the 2006 observation. In order to better quantify it we return to Figure 2. For pure dust scattering, the linear fits in the diagram should pass through the origin. As seen from the inset, however, both fits have a positive -intercept, suggesting that some of the extended emission does not come from the dust halo. In Table 3, we list the values of the -intercepts for regions A and B and the extended emission count rate in 2006, and we calculate the fraction of the latter that was not contributed by dust scattering.
We find that in region B, of the extended emission in 2006 is not from the dust halo. Since our region B mostly corresponds to the SNR region from VB09 and therefore to the location of the radio SNR shell, we conclude that the X-ray counterpart of this shell is the source of the non-dust extended emission here.
Region A corresponds roughly to the ‘PWN’ region from VB09, noting that the broad PSF of XMM-Newton restricts us to . Unlike farther out, the 2006 extended emission in region A is still dominated by the dust halo; only of it comes from another source. In fact, since the significance is only above zero, it is possible that dust scattering alone is sufficient to explain all of the extended emission in region A. Nevertheless, we can use the parameters in Table 3 to estimate an upper limit on the flux of a possible PWN, assuming an absorbed power-law spectrum with , as in VB09, and a photon index of , as is typical of PWNe. We find a upper limit444In this case, the most stringent upper limit found was based on the non-detection of extended emission above 6 keV, not the parameters from Table 3. on the 2–10 keV unabsorbed flux of , corresponding to a luminosity of . This implies an X-ray efficiency of . We also repeated our estimation for a softer PWN spectrum of , but found that the 2–10 keV upper limit was largely insensitive to changes in .
5 Conclusions
In this paper, we have examined multi-epoch XMM-Newton data for the magnetar candidate 1E 1547.05408 and we show that the observed extended emission surrounding the source is dominated by dust-scattered magnetar emission. Specifically we find that the luminosity of the nebular emission is proportional to the source flux, as expected for dust scattering, but not seen in any known PWN or other magnetar candidate. Additional strong evidence for dust-scattering comes from spectral and energetics arguments, as well as from the disagreement between the observed nebular variability time scale and the expected synchrotron loss time in the PWN interpretation. We note that contrary to a previous claim (VB09), even in 2006 when the source was relatively faint, of the nebular emission is from dust scattering. We cannot, however, rule out the presence of a faint PWN with luminosity in the 2–10 keV band, a limit three times lower than the previously claimed detection ( from VB09). Deep observations of this source when the magnetar is in quiescence are necessary to test this hypothesis. We do, on the other hand, find strong evidence for non-dust-scattered extended X-ray emission at angular distance , which we argue is from the SNR shell surrounding the pulsar, as previously reported by VB09.
With the absence of evidence for a PWN surrounding any AXP or SGR, now including 1E 1547.05408, previous models for the production of PWNe by magnetars (Thompson & Blaes, 1998; Harding et al., 1999) remain unsupported. On the other hand with clear evidence for the existence of PWNe surrounding many high-magnetic-field radio pulsars (e.g., PSR J1846–0258: Helfand et al., 2003; PSR J1119–6127: Gonzalez & Safi-Harb, 2003) which generally have substantially higher spin-down luminosities than any known AXP or SGR, the production of the relativistic particle wind necessary to generate an observable PWN seems intimately tied to the rotation-derived power, rather than that from magnetic-field decay. This then makes the detection of the surprisingly bright X-ray PWN surrounding the presumably rotation-powered but relatively high- RRAT PSR J18191458 (Rea et al., 2009) particularly interesting and worthy of follow-up.
References
- Bernardini et al. (2011) Bernardini, F., Israel, G. L., Stella, L., et al. 2011, A&A, 529, A19
- Camilo et al. (2007) Camilo, F., Ransom, S. M., Halpern, J. P., & Reynolds, J. 2007, ApJ, 666, L93
- Dib et al. (2011) Dib, R., Kaspi, V. M., & Gavriil, F. P. 2011, ApJ, submitted
- Draine (2003) Draine, B. T. 2003, ApJ, 598, 1026
- Fender et al. (2006) Fender, R. P., Muxlow, T. W. B., Garrett, M. A., et al. 2006, MNRAS, 367, L6
- Gaensler et al. (2005) Gaensler, B. M., Kouveliotou, C., Gelfand, J. D., et al. 2005, Nature, 434, 1104
- Gaensler & Slane (2006) Gaensler, B. M., & Slane, P. O. 2006, ARA&A, 44, 17
- Gelfand (2007) Gelfand, J. D. 2007, Ap&SS, 308, 39
- Gelfand & Gaensler (2007) Gelfand, J. D., & Gaensler, B. M. 2007, ApJ, 667, 1111
- Gelfand et al. (2005) Gelfand, J. D., Lyubarsky, Y. E., Eichler, D., et al. 2005, ApJ, 634, L89
- Gonzalez & Safi-Harb (2003) Gonzalez, M., & Safi-Harb, S. 2003, ApJ, 591, L143
- Granot et al. (2006) Granot, J., Ramirez-Ruiz, E., Taylor, G. B., et al. 2006, ApJ, 638, 391
- Halpern et al. (2008) Halpern, J. P., Gotthelf, E. V., Reynolds, J., Ransom, S. M., & Camilo, F. 2008, ApJ, 676, 1178
- Harding et al. (1999) Harding, A. K., Contopoulos, I., & Kazanas, D. 1999, ApJ, 525, L125
- Helfand et al. (2003) Helfand, D. J., Collins, B. F., & Gotthelf, E. V. 2003, ApJ, 582, 783
- Hurley et al. (1999) Hurley, K., Kouveliotou, C., Cline, T., et al. 1999, ApJ, 523, L37
- Israel et al. (2010) Israel, G. L., Esposito, P., Rea, N., et al. 2010, MNRAS, 408, 1387
- Kaneko et al. (2010) Kaneko, Y., Göǧüs, E., Kouveliotou, C., et al. 2010, ApJ, 710, 1335
- Kargaltsev & Pavlov (2008) Kargaltsev, O., & Pavlov, G. G. 2008, in AIP Conf. Proc. 983, 40 Years of Pulsars: Millisecond Pulsars, Magnetars, and More, ed. C. Bassa et al. (Melville, NY: AIP), 171
- Kaspi (2007) Kaspi, V. M. 2007, Ap&SS, 308, 1
- Kaspi et al. (2006) Kaspi, V. M., Roberts, M. S. E., & Harding, A. K. 2006, in Compact Stellar X-ray Sources, ed. W. H. G. Lewin & M. van der Klis (Cambridge: Cambridge Univ. Press)
- Lamb & Markert (1981) Lamb, R. C., & Markert, T. H. 1981, ApJ, 244, 94
- Lyutikov (2006) Lyutikov, M. 2006, MNRAS, 367, 1594
- Mathis & Lee (1991) Mathis, J. S., & Lee, C.-W. 1991, ApJ, 376, 490
- Mauche & Gorenstein (1986) Mauche, C. W., & Gorenstein, P. 1986, ApJ, 302, 371
- Mereghetti (2008) Mereghetti, S. 2008, A&A Rev., 15, 225
- Mereghetti et al. (2009) Mereghetti, S., Götz, D., Weidenspointner, G., et al. 2009, ApJ, 696, L74
- Murakami et al. (1994) Murakami, T., Tanaka, Y., Kulkarni, S. R., et al. 1994, Nature, 368, 127
- Ng et al. (2011) Ng, C.-Y., Kaspi, V. M., Dib, R., et al. 2011, ApJ, 729, 131
- Palmer et al. (2005) Palmer, D. M., Barthelmy, S., Gehrels, N., et al. 2005, Nature, 434, 1107
- Predehl & Schmitt (1995) Predehl, P. & Schmitt, J. H. M. M. 1995, A&A, 293, 889
- Rea et al. (2009) Rea, N., McLaughlin, M. A., Gaensler, B. M., et al. 2009, ApJ, 703, L41
- Scholz & Kaspi (2011) Scholz, P., & Kaspi, V. M. 2011, ApJ, 739, 94
- Strüder et al. (2001) Strüder, L., Briel, U., Dennerl, K., et al. 2001, A&A, 365, L18
- Taylor et al. (2005) Taylor, G. B., Gelfand, J. D., Gaensler, B. M., et al. 2005, ApJ, 634, L93
- Thompson & Blaes (1998) Thompson, C., & Blaes, O. 1998, Phys. Rev. D, 57, 3219
- Thompson & Duncan (1995) Thompson, C., & Duncan, R. C. 1995, MNRAS, 275, 255
- Thompson & Duncan (1996) Thompson, C., & Duncan, R. C. 1996, ApJ, 473, 322
- Thompson et al. (2002) Thompson, C., Lyutikov, M., & Kulkarni, S. R. 2002, ApJ, 574, 332
- Tiengo et al. (2010) Tiengo, A., Vianello, G., Esposito, P., et al. 2010, ApJ, 710, 227
- Turner et al. (2001) Turner, M. J. L., Abbey, A., Arnaud, M., et al. 2001, A&A, 365, L27
- Vink & Bamba (2009) Vink, J., & Bamba, A. 2009, ApJ, 707, L148
- Woods & Thompson (2006) Woods, P. M., & Thompson, C. 2006, in Compact Stellar X-ray Sources, ed. W. H. G. Lewin & M. van der Klis (Cambridge: Cambridge Univ. Press)
| Date | Obs ID | Exposure (ks) | Count Rate (cnt s-1)aaBackground-subtracted count rate of the point source in the 1–6 keV energy range. | Mode/FilterbbThe time resolutions of the operating modes of the EPIC pn camera are: Full Frame (FF): 73.4 ms; Large Window (LW): 47.7 ms. |
|---|---|---|---|---|
| 2006 Aug 21 | 0402910101 | 38.7 | 0.074 | FF/Medium |
| 2007 Aug 9 | 0410581901 | 11.6 | 0.59 | LW/Medium |
| 2009 Feb 3 | 0560181101 | 48.9 | 4.6 | FF/Thick |
| 2010 Feb 10 | 0604880101 | 35.7 | 1.9 | LW/Medium |
| Observation | Hardness RatioaaThe hardness ratio is defined as , where is the background-subtracted count rate of the point source or extended emission. Numbers in parentheses are uncertainties. | ||
|---|---|---|---|
| Point Source | Region A | Region B | |
| 2006 | 0.306(18) | 0.21(6) | 0.46(5) |
| 2007 | 0.482(16) | 0.18(5) | 0.32(4) |
| 2009 | 1.014(6) | 0.55(4) | 0.45(1) |
| 2010 | 0.814(8) | 0.34(4) | 0.37(2) |
| Region | Count Rate of Extended Emission (cnt s-1)aaNumbers in parentheses are uncertainties. | Fraction Not Attributable | |
|---|---|---|---|
| Extrapolated -interceptbbExtrapolated -intercept for the linear fits in Figure 2. | Observed Value in 2006 | to Dust ScatteringaaNumbers in parentheses are uncertainties. | |
| A | 0.003(1) | 0.0085(4) | 0.36(12) |
| B | 0.040(3) | 0.053(4) | 0.75(6) |