Average Heating Rate of Hot Atmospheres in Distant Clusters by Radio AGN: Evidence for Continuous AGN Heating
Abstract
We examine atmospheric heating by radio active galactic nuclei (AGN) in distant X-ray clusters by cross correlating clusters selected from the 400 Square Degree (400SD) X-ray Cluster survey with radio sources in the NRAO VLA Sky Survey. Roughly 30% of the clusters show radio emission above a flux threshold of 3 mJy within a projected radius of 250 kpc. The radio emission is presumably associated with the brightest cluster galaxy. The mechanical jet power for each radio source was determined using scaling relations between radio power and cavity (mechanical) power determined for nearby clusters, groups, and galaxies with hot atmospheres containing X-ray cavities. The average jet power of the central radio AGN is approximately erg s-1. We find no significant correlation between radio power, hence mechanical jet power, and the X-ray luminosities of clusters in the redshift range 0.1 – 0.6. This implies that the mechanical heating rate per particle is higher in lower mass, lower X-ray luminosity clusters. The jet power averaged over the sample corresponds to an atmospheric heating of approximately 0.2 keV per particle within R500. Assuming the current AGN heating rate does not evolve but remains constant to redshifts of 2, the heating rate per particle would rise by a factor of two. We find that the energy injected from radio AGN contribute substantially to the excess entropy in hot atmospheres needed to break self-similarity in cluster scaling relations. The detection frequency of radio AGN is inconsistent with the presence of strong cooling flows in 400SD clusters, but does not exclude weak cooling flows. It is unclear whether central AGN in 400SD clusters are maintained by feedback at the base of a cooling flow. Atmospheric heating by radio AGN may retard the development of strong cooling flows at early epochs.
Subject headings:
Galaxies: clusters: general; Galaxies: clusters: intracluster medium; Galaxies: quasars: general; X-rays: galaxies: clusters; Radio continuum: galaxies1. Introduction
Heating by active galactic nuclei (AGN) may be responsible for two significant phenomena in galaxy clusters. First, cool, dense cores found in the X-ray atmospheres of clusters are expected to cool efficiently to low temperatures (Fabian, 1994). However, the levels of cold gas and star formation lie well below the values expected from pure radiative cooling (reviewed by Peterson & Fabian, 2006; McNamara & Nulsen, 2007). The generally accepted solution is that the cooling is being compensated by one or more heating mechanisms, possibly including conduction from the hot gas in non-cooling regions (e.g. Narayan & Medvedev, 2001; Zakamska & Narayan, 2003; Voigt & Fabian, 2004; Wise et al., 2004), and AGN heating (e.g. Binney & Tabor, 1995; Churazov et al., 2002; Roychowdhury et al., 2004; Voit & Donahue, 2005). Among the possible heating mechanisms, AGN heating stands out because of both the enormous energy released and the opportunity for feedback, since AGN power is controlled by the accretion rate. Second, galaxy groups and poor clusters are less luminous than expected based on the - relation derived for massive clusters (Markevitch, 1998; Arnaud & Evrard, 1999; Ruszkowski et al., 2004; Sanderson et al., 2003; Popesso et al., 2005). This is interpreted as a break of the self-similar scaling relation between X-ray luminosity and gas temperature expected in structure formation models that include only gravitational heating (Kaiser, 1986; Evrard et al., 1996). The lower than expected X-ray luminosity for a given temperature is thought to reflect extra entropy (heat) in the gas that was injected by star formation and AGN at early times (e.g. Kaiser, 1991; Balogh et al., 1999; Borgani et al., 2005; Ponman et al., 2003; Croston et al., 2005; Sanderson et al., 2005; Jetha et al., 2007; Cavagnolo et al., 2009). The “preheating” model proposes that the excess entropy was injected during the early stages of structure formation (e.g. Kaiser, 1991; Balogh et al., 1999; McCarthy et al., 2002).
The amount of energy released by an AGN, on the order of erg, is more than enough to be the major heating source. Nevertheless, how and where the energy is distributed into the ICM remains an issue. As discussed by McNamara & Nulsen (2007), AGN heat in two ways. First, AGN outbursts inflate cavities. The enthalpy released as the cavities rise buoyantly is dispersed into the ICM (Brüggen & Kaiser, 2002; Reynolds et al., 2002; Churazov et al., 2002; Bîrzan et al., 2004). Thermalization of the energy of cosmic rays diffusing out of a radio lobe is an alternative channel for converting lobe free energy to heat (e.g. Mathews, 2009). Second, the AGN inject energy into the ICM through shocks (e.g. Forman et al., 2005; McNamara et al., 2005; Nulsen et al., 2007) and sound waves (e.g. Fabian et al., 2005a). Cavity power can be estimated using the enthalpy contained in the cavity and its rise time. In practice, the enthalpy is calculated as , assuming the cavity is filled with relativistic particles, and the age can be estimated using the terminal velocity of the buoyantly rising bubbles (Bîrzan et al., 2004; Dunn et al., 2005; Rafferty et al., 2006; Bîrzan et al., 2008). All of these quantities, the pressure of the surrounding gas , the volume of the cavity and sound speed in the ICM, can be obtained from X-ray data in principle. Simulations by (Mendygral et al., 2011) have verified that the cavity power estimated using this approach can be accurate to approximately a factor of two. Furthermore, Bîrzan et al. (2008) and Cavagnolo et al. (2010) find that the radio power and the buoyant cavity power are correlated for samples ranging from elliptical galaxies and galaxy groups to massive galaxy clusters. Thus, the radio power can be used as a proxy for the cavity power for large samples of radio galaxies embedded in hot atmospheres that lack deep X-ray observations. However, cavity power estimated using this approach is probably a lower limit, because it does not include the additional energy released by shocks (Forman et al., 2005; McNamara et al., 2005; Nulsen et al., 2005a, b).
It is more challenging to calculate the total AGN energy deposited over the life of a cluster. Since the power output of AGN is highly variable and outbursts are intermittent, current AGN power is not necessarily representative of its historical average. Even under the simplest assumption, that the power of an AGN is the same in every outburst (which is inconsistent with data, e.g. Fabian et al., 2006; Randall et al., 2011), an estimate is still required for the fraction of the time that the AGN is in outburst, i.e., for its duty cycle, which is also inaccessible for individual AGN. An alternative to studying single systems is to determine the average AGN power for a large sample. For a well chosen sample, the average power should represent the time average of the AGN power for individual sample members. The key to success here is to use a well-defined, unbiased, and sufficiently large sample.
In this paper, we estimate the average jet power in distant, X-ray selected clusters found in the 400 Square Degree Cluster Survey (400SD; Burenin et al., 2007; Vikhlinin et al., 2005) by cross correlating the 400SD catalog with the NRAO VLA Sky Survey (NVSS; Condon et al., 1998). We calculate jet powers for radio sources above a flux limit of mJy. Following earlier work on AGN heating in cooling core clusters (Dunn & Fabian, 2006, 2008; Rafferty et al., 2006, 2008), we evaluate the AGN power injected into normal clusters to address the question of how much energy is deposited by AGN into cluster halos over a significant fraction of their ages. Note that AGN feedback would be expected to enhance the incidence of radio outbursts at the centers of cooling core clusters. As a result, this question cannot be answered based on a sample of nearby cooling core clusters, which does not represent the general cluster population. Also, since we are interested in the total power injected by AGN, multiple radio sources may be attributed to a single cluster in the present study.
The paper is arranged as follows. In §2, we introduce the 400SD clusters, and the matched radio sources. In particular, we discuss the background source correction in §2.3, and examine the morphology of a subsample of the NVSS sources using images from the survey Faint Images of the Radio Sky at Twenty-cm (FIRST; Becker et al., 1995) in §2.4. Then we present our analysis and discuss the interpretation: the correlation between the 1.4 GHz power of the radio AGNs and the X-ray luminosity of their host clusters in §3.1, the radial distribution of radio sources in the clusters in §3.2, the jet power estimated from the radio power in §3.3, and the estimation of AGN heating energy in §3.4. We summarize our results in §4.
2. Sample
2.1. X-ray data
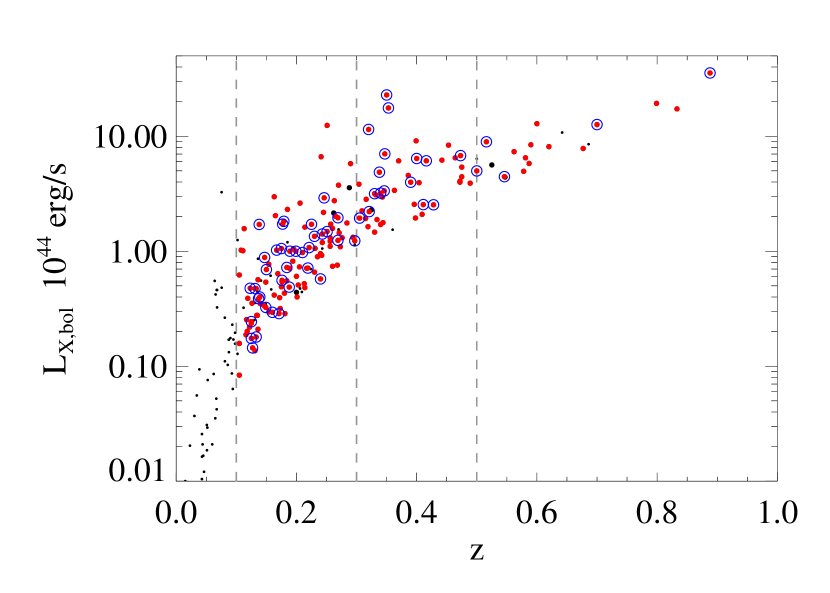
The 400SD survey is one of the largest serendipitous X-ray surveys of clusters based on ROSAT Position Sensitive Proportional Counter pointed observations. It includes 242 optically confirmed clusters and groups brighter than an X-ray flux limit of erg s-1 cm-2 in the keV energy band, and lying at redshifts within a deg2 area. It is arguably one of the best surveys for studying the evolution of clusters because the 400SD samples “normal” clusters at higher redshift. It is not targeted at the most massive clusters. It includes clusters with L erg s-1 at (Fig. 1), in contrast to the all-sky surveys, such as MACS (Ebeling et al., 2001), BCS+eBCS (Ebeling et al., 1997, 2000), which are targeted at the rarer, more luminous and more massive clusters. In addition, the ratio of strong cooling core clusters (SCC; defined as cooling time less than Gyr in Mittal et al., 2009) in 400SD is very low according to Santos et al. (2010), who find none SCC out of 20 clusters at ), comparing to the all-sky surveys, e.g. BCS (Dunn & Fabian, 2008) and HIFLUGCS (Mittal et al., 2009). A similar conclusion is also made by Samuele et al. (2011) studying emission lines in the optical spectra of the brightest cluster galaxies (BCGs) in 400SD clusters.
Here we provide a short summary of the measurements of the 400SD clusters in the catalog of Burenin et al. (2007) and Vikhlinin et al. (1998).
-
•
The clusters were confirmed optically using images with magnitude limit m. Their redshifts were measured spectroscopically.
-
•
The center position and core radius of each cluster were derived from the best-fit -model with fixed to . The typical systematic error of the cluster positions is with respect to the brightest cluster galaxy.
-
•
The X-ray flux in the energy band keV was estimated as the mean of two fluxes calculated from the integration of best-fit -models with fixed to and respectively. The systematic uncertainty caused by the uncertainty of value was added.
- •
-
•
To be consistent, we extrapolated to obtain the X-ray bolometric luminosity LX,bol (Fig. 1) assuming the same LX-T relation.
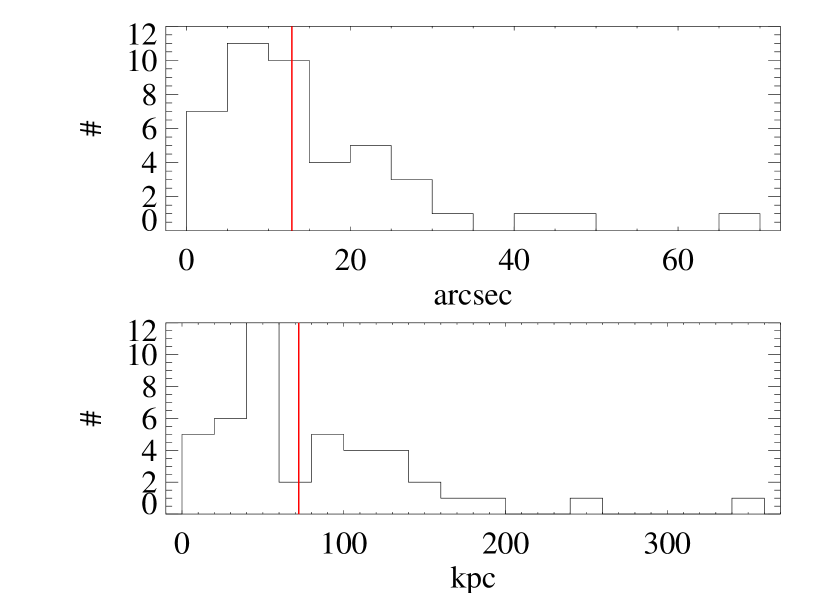
We used the high resolution ACIS/Chandra data, which is available for a subsample of the 400SD clusters (Vikhlinin et al., 2009, 52 clusters in total), to examine the uncertainties in the luminosities and centroids determined from the PSPC data. Compared to centers determined visually from the ACIS images (see Fig. 2), we find that the average offset of the position in the catalog is , which is consistent with the uncertainty quoted above. In the rest frames of these clusters, all but one of the offsets correspond to projected distances of less than kpc. The exception is a binary system (CL J0152.7-1357) whose cataloged centroid is located between the two clusters which are separated by .
In Burenin et al. (2007), the uncertainty in the luminosities derived from the PSPC fluxes using more accurate Chandra fluxes is . In addition, a few outliers, which are likely caused by contamination from X-ray point sources, can be found in Fig. 23 of Burenin et al. (2007).
2.2. NVSS sources
In order to match the coordinates of 400SD clusters with 1.4 Ghz sources in the NVSS (Condon et al., 1998), we extracted a subsample consisting of the 400SD clusters in the region covered by the NVSS survey. This procedure yields 196 clusters at . We find, in total, radio sources above a flux limit of 3 mJy 111The completeness reaches at 3 mJy (Condon et al., 1998). We also tried a lower flux limit, 2 mJy, and found that the results are qualitatively insensitive to the limit (see §3.4)., located within a projected distance of 2 Mpc of 166 clusters at . Of these sources, 61 are located within a 250 kpc radius of 56 clusters at . Considering the uncertainty in the centroids for the 400SD clusters (§2.1) and the resolution of NVSS images, all sources within 250 kpc are consistent with being associated with the central galaxies of the clusters. We note that a small fraction of these matched radio sources are background sources seen in projection and are not physically associated with the clusters. We discuss the background correction in §2.3.
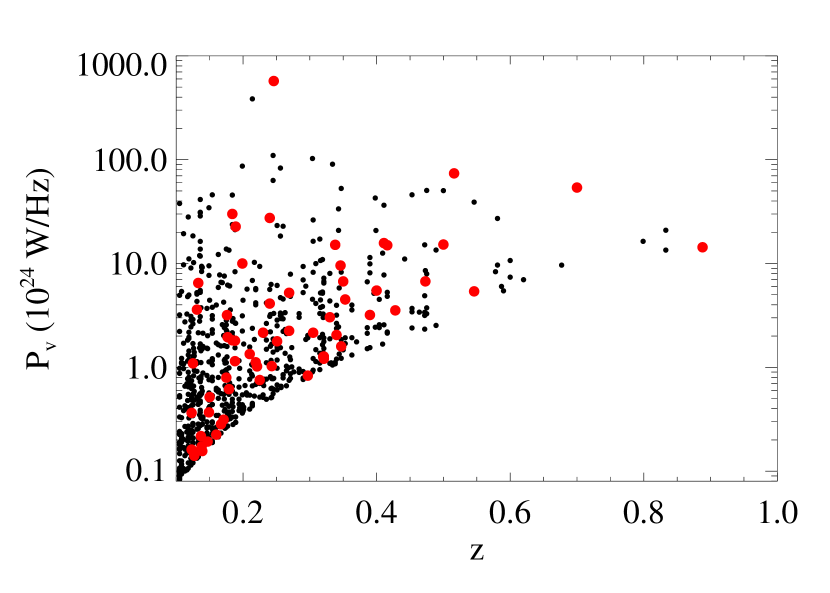
We calculated the radio power density, (Fig. 3), for each matched NVSS source, using the cluster redshift and a spectral index of , which is the average for NVSS sources (Condon et al., 1998). The cluster redshift was used because we cannot identify and measure the redshift of the host galaxy.
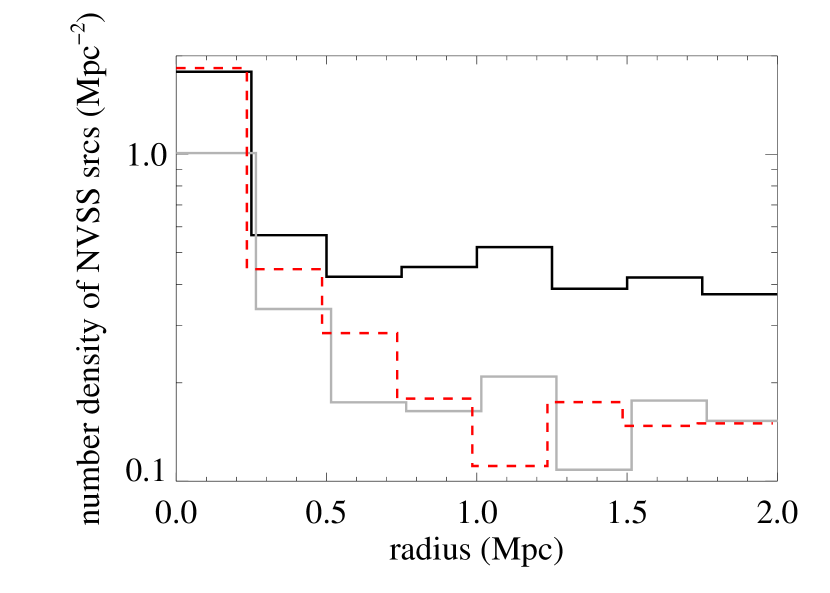
In Fig. 4, we plot the surface density of detected NVSS sources around the 400SD clusters as functions of distance from the X-ray centroid, for the redshift bins, and . The surface density of NVSS sources associated with clusters declines more quickly with distance at higher redshifts (red) compare to those at redshift between 0.1 and 0.3 (black). The distribution for the lower redshift sample is flat beyond kpc. The difference between the profiles arises because of the radio flux limit. Our adopted flux limit of mJy corresponds to a minimum luminosity of (see Fig. 3) for radio sources beyond , and drops to W Hz-1 for radio sources at the redshift . Thus, we detect many more low power radio sources within and projected onto the nearby clusters compared to those at higher redshifts. Plotting the radial distribution of only the high luminosity sources () for clusters lying between (gray histogram in Fig. 4) gives a closer match to the distribution for clusters beyond . However, the surface density of NVSS sources within the central 250 kpc is significantly higher in the higher redshift clusters (red dashed histogram) compared to the lower redshift clusters (gray histogram).
2.3. Background correction
We are unable to identify the radio host galaxies due to the poor resolution of the NVSS survey. Furthermore, we do not have their redshifts. We have therefore corrected our numbers for background contamination statistically. We assumed that the spatial distribution is locally homogeneous and the flux function is independent to the location on the sky. Thus, the probability of finding any background sources within an area can be expressed as
| (1) |
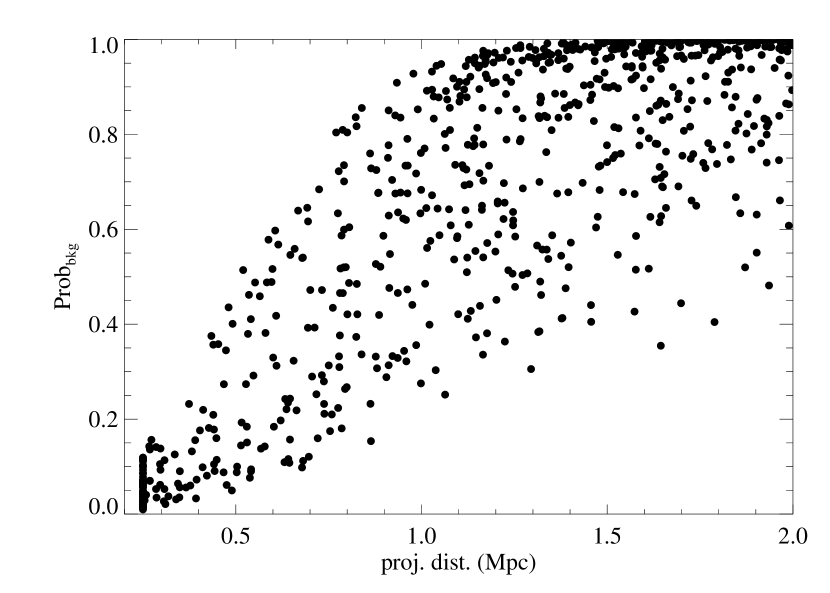
the mean is estimated from the number density of the background sources, the number of the NVSS sources in an annulus from to around the cluster of interest is , and is the area of this annulus222We have also tried the background source density calculated using the entire NVSS source catalog, and found no significant difference in our results.. The typical number of sources in the annulus is about 1600 and the background number density is about 42 deg-2, consistent with the number density mentioned in Condon et al. (1998). Fig. 5 shows that any detected source is likely to be a background source at large radii. Therefore, we confine out attention mostly to sources located within 250 kpc of the center.
In order to correct the flux contamination, we calculated the expected flux of background sources within the background area defined above. When we calculated the average flux of radio sources within some projected distance of a cluster, we scaled the expected background flux according to the ratio of area, and subtracted it from the gross average flux.
2.4. High resolution radio source images for a subset of the sample
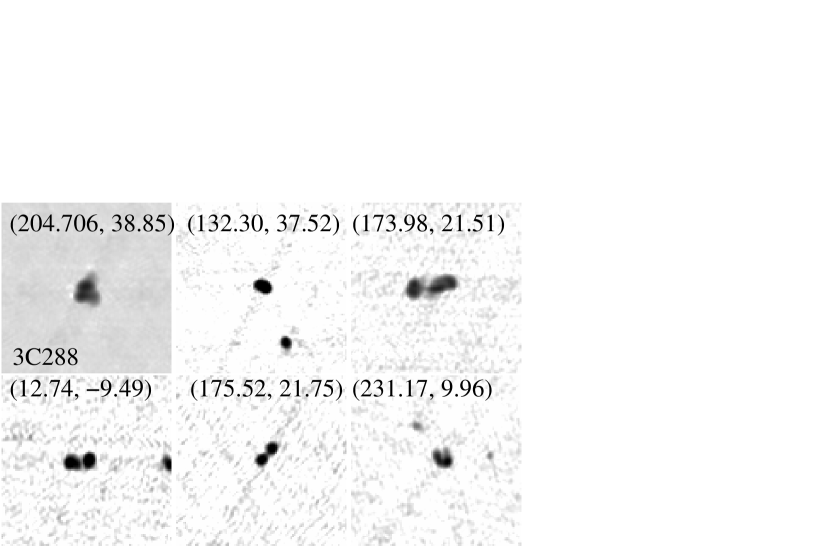
Before we investigate the statistical properties of the matching radio sources, we briefly discuss the properties of a few sources with higher resolution radio images obtained from the FIRST data archive. Overall, more than half of the NVSS sources were observed in the FIRST survey. For example, we examined the images of 33 out of 56 NVSS sources matched within a 250 kpc radius of the 400SD clusters. We find 14 of these sources have double radio source morphologies, and 7 of the remaining 19 single sources are resolved at the FIRST resolution () with a minimum FIRST flux mJy. We also checked the optical images of Vikhlinin et al. (2009), and find that (25/33) of the radio sources within 250 kpc are associated with BCGs. We are unable to identify the BCGs of the remaining 8 clusters with radio sources using the available optical imagery.
In Fig. 6, we show FIRST images for the strongest six sources located within 250 kpc radius of the 400SD clusters. Of particular interest is 3C288, which is the brightest NVSS source in our sample ( W Hz-1). Its host is the BCG of cluster 400DJ1338+3851 at with erg s-1. It is a well-studied object because of its bright but edge-darkened radio morphology (Bridle et al., 1989; Saripalli & Subrahmanyan, 2009; Lal et al., 2010), and has been characterized as a transitional FR I/FR II radio galaxy (Fanaroff & Riley, 1974). In the core of the cluster, Lal et al. (2010) detected two surface brightness discontinuities, which are interpreted as shocks induced by the supersonic inflation of the radio lobes. The inferred shock energy is comparable to the cavity enthalpy of erg s-1.
3. Results and Discussion
3.1. Correlation between radio power of AGN and X-ray luminosity of clusters?
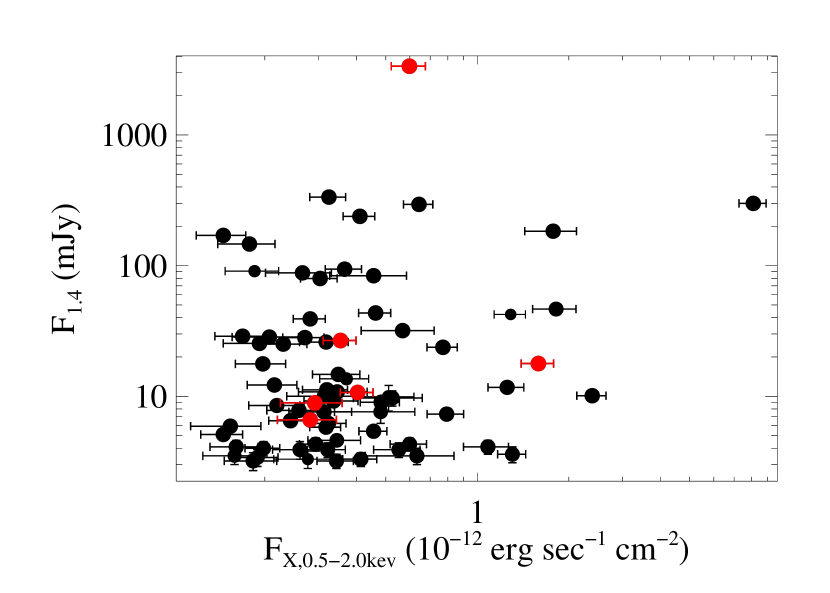
Using our catalog of 400SD clusters, we now examine the relationship between the radio power of the central galaxies and cluster X-ray luminosity. A simple flux-flux plot in Fig. 7 shows no correlation between the radio fluxes333Radio fluxes are summed for all sources within 250 kpc of each cluster cener. However, most of the clusters (51 out of 56) with radio sources within 250 kpc radius only contain a single radio source, so that the fluxes could be taken as those of individual radio sources. (F1.4) of the sources within kpc radius and the X-ray fluxes (FX,0.5-2.0keV). The Spearman correlation is only . To make sure the correlation is not hidden by redshift dependent factors, such as reddening, we plot the ratio of radio power to X-ray luminosity versus redshift in Fig. 8. Although the points seem to be centered on a constant ratio of , the lower limits, estimated for clusters with no detected NVSS sources (F mJy), and the upper limit (red curve) for clusters not detected at the X-ray flux limit of the 400SD survey, suggest that any correlation is deceptive. In summary, no correlation is found between radio power and X-ray luminosity in our cluster sample.
Several previous studies (e.g. Sun, 2009; Mittal et al., 2009) have demonstrated that the correlation between X-ray luminosity of the cooling core and the radio power only appears in “strong” cooling core clusters. Therefore, the lack of a correlation between radio and X-ray power is consistent with the lack of strong cooling core clusters among 400SD clusters (Vikhlinin et al., 2007; Santos et al., 2010; Samuele et al., 2011). Of the 52 400SD clusters with Chandra data, 20 have NVSS sources within 250 kpc of the center. Of those, 6 clusters have surface brightness concentrations (Santos et al., 2008), corresponding to central cooling times shorter than Gy (Santos et al., 2010). These are likely to be weak cool core clusters (WCC in Mittal et al., 2009). These sources are plotted in red in Fig. 7 and their radio and X-ray fluxes do appear better correlated than for the bulk of the sample, consistent with previous studies.
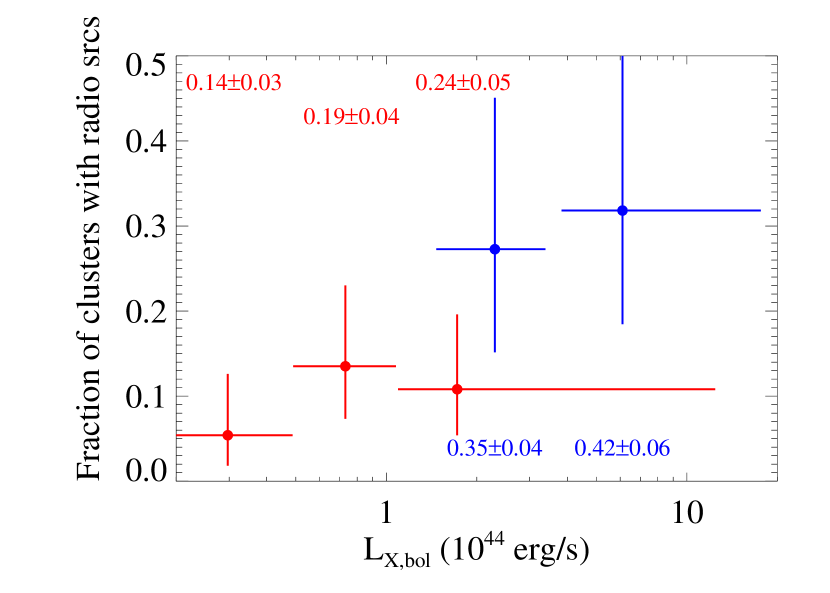
We also consider the dependence of the fraction of clusters with NVSS radio sources on X-ray luminosity. In Fig. 9, the incidence of radio sources appears to increase slightly with X-ray luminosity. However, the range of X-ray luminosities sampled depends on the redshift in a flux-limited survey. The low luminosity clusters in the sample are only detectable at lower redshift because of the X-ray flux limit. Separating the sample into two redshift slices ( and in Fig. 9), we find that the apparent correlation between X-ray luminosity and the fraction of cluster with NVSS sources disappears. Thus, we suggest that the difference between the blue points (higher redshift, more luminous clusters) and the red points (lower redshift, less luminous clusters) is probably caused by redshift and not X-ray luminosity. Best et al. (2007) found no correlation between the fraction of radio-loud AGN in cluster galaxies and cluster velocity dispersion, which is, a proxy for X-ray luminosity and cluster mass. However, Lin & Mohr (2007) found a clear increase in the “radio active fraction” in a massive cluster sample selected when they have bright BCGs with . In order to examine this apparent inconsistency, we need to study the k-band luminosity of the BCGs which is beyond the scope of this paper.
Although we see no evidence of a dependence on X-ray luminosity, the incidence of radio AGN does increase marginally at higher redshift. This may reflect higher AGN fractions in the past, as suggested by some, e.g.,by Martini et al. (2007, 2009) for X-ray AGN and by Galametz et al. (2009) for AGN selected by radio, infrared and X-ray. However, Gralla et al. (2010) analyzed radio AGN in the 618 clusters of the Red Sequence Clusters Survey at redshifts , finding that the average number of AGN is independent of redshift. Although they are less significant, our results agree better with the trend found for radio AGN by Galametz et al. (2009), of an increase in incidence by about a factor of 2 ( significance) from to .
3.2. Radial Distribution and Incidence of radio AGN in clusters
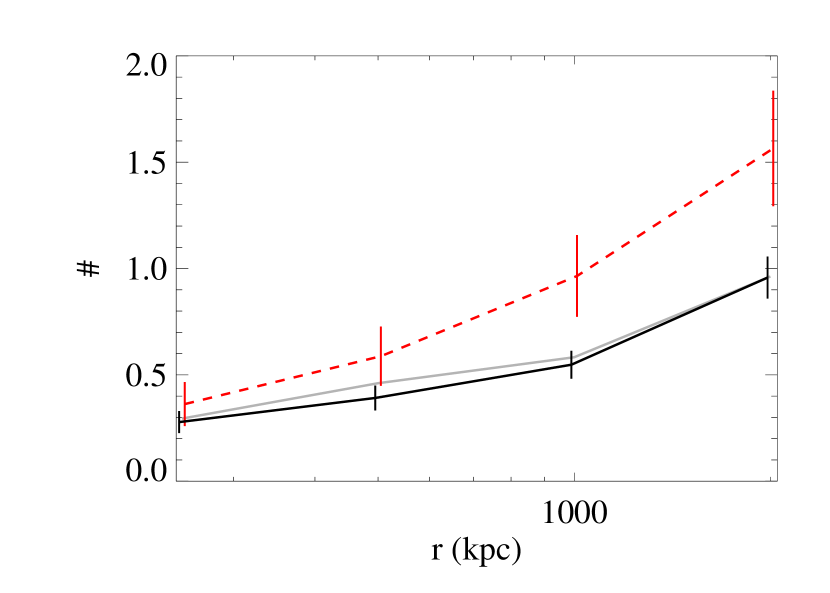
In Fig. 10, we plot the average cumulative number of radio AGN within radius versus for the 400SD clusters. The number of radio sources increases from an average of in the cluster cores to within Mpc. However, the number of radio sources increases much more slowly than the area (i.e., ), consistent with the observation that the surface density of radio sources peaks at cluster centers (Ledlow & Owen, 1995; Best et al., 2007; Lin & Mohr, 2007; Croft et al., 2007).
Since most 400SD clusters have no more than one radio source within 250 kpc, the average number of radio sources shown as the leftmost point in Fig. 10 is equivalent to the radio source fractions in Fig. 9. The average number of radio sources we find in the cores of 400SD clusters is significantly lower than the fraction of radio-loud BCGs in nearby cooling core clusters, which lies between 75% to 100% (Burns, 1990; Edwards et al., 2007; Dunn et al., 2006; Mittal et al., 2009). This fraction is expected to correlate with the central cooling time. Our detection fraction is close to the fraction of radio sources found in nearby, non-cooling core clusters () as defined by Mittal et al. (2009), and is identical to the fraction found in optically selected clusters (30%) determined by Best et al. (2007). While a more quantitative comparison between the numbers is difficult, a low radio source fraction for the 400SD clusters is consistent with our claim that most of them lack strong cooling cores. At the same time, our detection fraction is significantly higher than the radio loud fraction of isolated ellipticals, which is Best et al. (2007). So it is possible that our host galaxies lie at the centers of weak cooling flows. This issue will need to be addressed using deep X-ray imaging.
In Fig. 10, the clusters are divided into two redshift ranges, (solid line) and (red dashed line). We find that the average number of radio sources increases with redshift, consistent with the discussion of Fig. 9 in §3.1. Nevertheless, the comparison between the higher redshift and the lower redshift clusters shows that the spatial distribution of radio sources around these clusters is not significantly different from that for all lower redshift clusters in the 400SD sample. In order to show that the redshift dependence of the average number of radio sources is not a consequence of the X-ray flux limit (i.e., luminosity limit) for the higher redshift clusters, we also plot the distribution of radio sources for lower redshift clusters with (gray solid line). This X-ray luminosity corresponds approximately to the flux limit for the higher redshift sample, so the close correspondence between the gray and black curves shows that their difference from the radial distribution for the higher redshift sample (red dashed line) is not due to the X-ray flux limit.
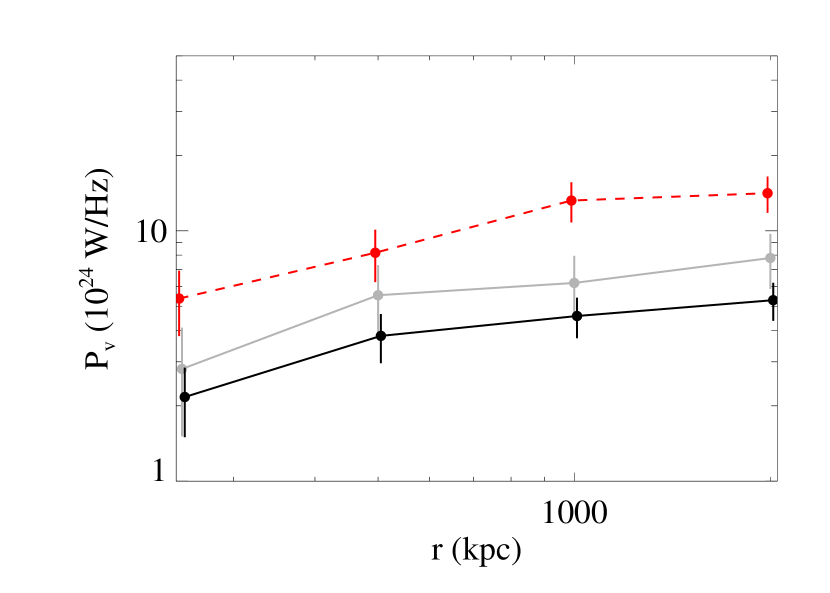
Like Fig. 10, Fig. 11 shows the distribution of the average radio power around 400SD clusters. The radio power also show a modest increase with redshift, but here the impact of the X-ray flux limit (see the gray solid line) is more marked. Note that the average power for the low redshift sample does not include the brightest radio source (3C288, ), which is roughly an order of magnitude brighter than the second brightest source within kpc (Fig. 3). If the contribution of this source was included, the average power of the low redshift sample would exceed that for the high redshift sample. We omit this source because the jet power derived from its radio power exceeds the jet power determined from its cavities by more than an order of magnitude (see §3.3, Lal et al., 2010). This discrepancy may simply reflect the large intrinsic scatter in the relationship of Eqn. 2, but we are unable to pursue this issue here, since our sample lacks a statistically significant population of such extremely luminous, short-lived sources.
3.3. Jet power estimated from radio power
Radio power has been shown to correlate with “cavity power,” an estimate of the mean power of radio jets based on enthalpies and ages of X-ray cavities (Bîrzan et al., 2004, 2008; Cavagnolo et al., 2010). Given their close correspondence to radio lobes, cavities are assumed to be formed by AGN outbursts. As a cavity rises buoyantly and expands, its enthalpy is expected to be released into the hot atmosphere that hosts it (reviewed in McNamara & Nulsen, 2007). This is one of several mechanisms by which radio outbursts may heat the gas. Other mechanisms include shock waves or sound waves created by the expansion of cavities (Forman et al., 2005; McNamara et al., 2005; Fabian et al., 2005b; Nulsen et al., 2005a, b; Forman et al., 2007) and thermalization of cosmic rays leaked from a radio source (Böhringer & Morfill, 1988; Mathews, 2009; Guo & Mathews, 2011). Here, we estimate jet powers, , using the – scaling relation of Cavagnolo et al. (2010),
| (2) |
which is expected to provide, on average, a minimum estimate for the total power injected into a cluster by a radio AGN. Here, is in units of , and in unit of . The scatter in the correlation between jet power and radio luminosity is dex. It is dominated by the intrinsic scatter (Bîrzan et al., 2008), due to a number of effects, including aging, and differences in particle content and magnetic field. The relationship (Eqn. 2) is determined over 6 decades in (- erg s-1), including data for nuclear radio sources for BCGs in cooling core clusters, with up to erg s-1, and low power sources in giant ellipticals with around erg s-1. The large scatter in this scaling relation implies that the jet power estimate it provides for any individual object has an uncertainty approaching a factor of 10.
We estimate the jet power for all of the cluster radio sources using Eqn. 2, albeit with a large intrinsic uncertainty. Assuming the errors are random, we expect the uncertainty in the ensemble average to be reduced to an acceptable level. More importantly, the average jet power calculated for an unbiased sample should provide an estimate of the contribution to the energy budget of AGN power integrated across the sample. A more precise measurement of jet power may be obtained for an individual object by analyzing its X-ray cavities. Despite being more precise, the measurement is only an instantaneous snap shot of its current jet power, and does not necessarily reflect the historical average AGN power. The ages of FR 1 radio AGN outbursts in clusters lie typically between to yrs, and the lives of powerful FRII sources are even shorter (O’Dea et al., 2009). These time scales are much less than cluster ages, which greatly exceed years. Therefore, an estimate of the time average jet power is required to calculate the total AGN energy input to the clusters over cosmic time. This quantity may be estimated by averaging jet power over a sufficiently large and unbiased sample of clusters, as we have done here.
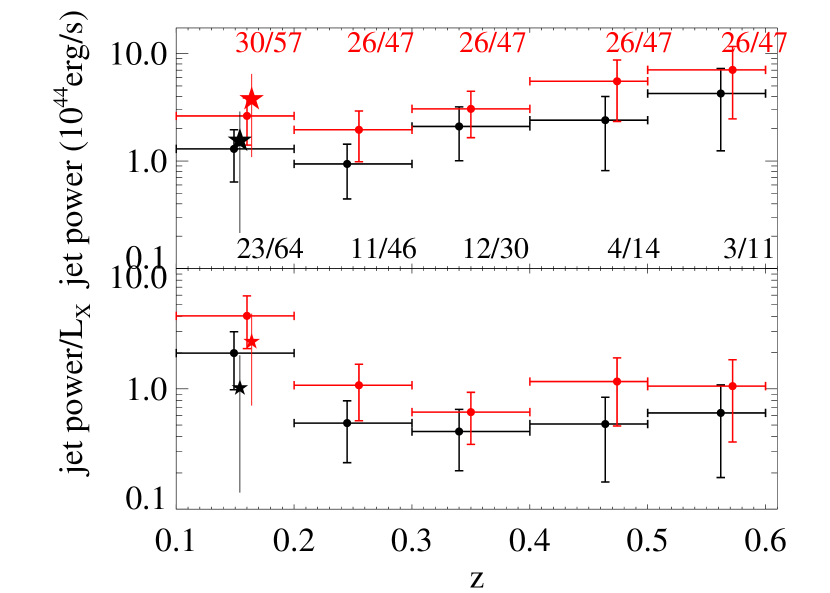
In Fig. 12, we show our estimate of the average jet power (), using a Monte-Carlo method that allows for the uncertainty in the radio flux and the parameters in Eqn. 2, the distribution of radio spectral indices444A Gaussian distribution with a mean of 0.75 and a of 0.10 (Condon, 1992) is assumed for the spectral indices., and the large intrinsic scatter () in the relation (Eqn. 2) to estimate confidence ranges. Overall, the confidence ranges shown in Fig. 12 are dominated by . Note that we use the arithmetic mean value of , excluding the brightest source (see §3.2). While this gives a mean power that is substantially greater than the “mean” of the log-normal distribution of jet powers, assumed implicitly in the correlation (Eqn. 2), our purpose is to determine the average energy deposited by AGN, not its distribution, so that the arithmetic mean is the appropriate estimator. In order to quantify the potential underestimate, we calculated the mean jet power excluding the 10% most powerful radio sources, and found that the number drops by 5%.
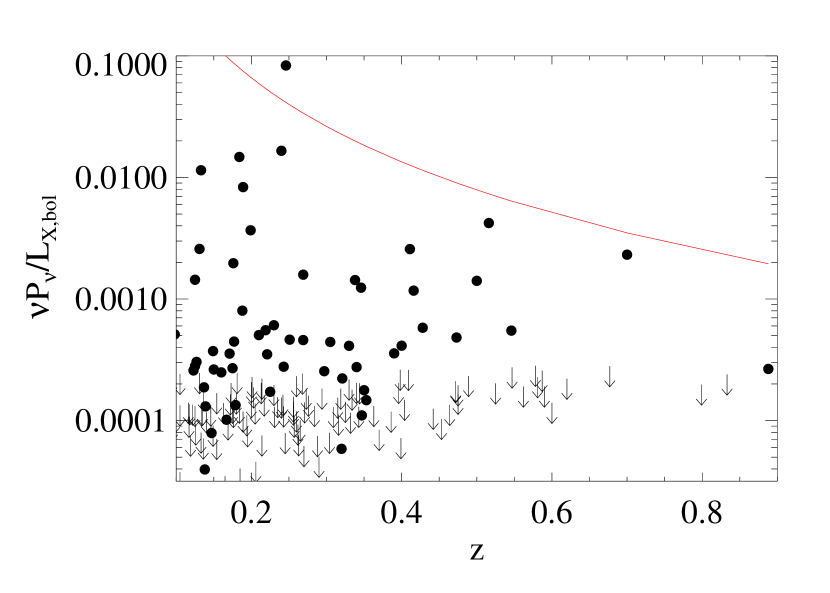
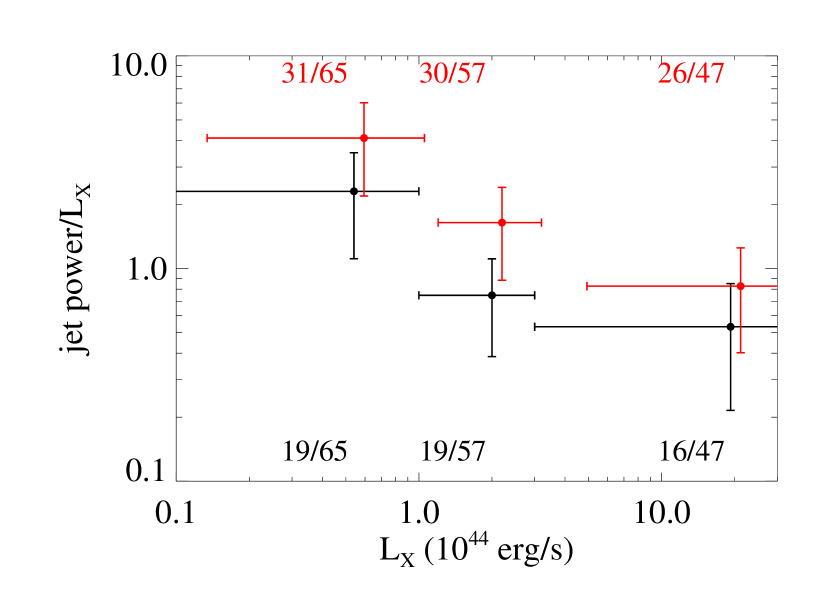
We find that the average jet power in the cores of the 400SD clusters is erg s-1and does not show a significant redshift evolution. The slight increase in the jet power at higher redshift reflects the increased AGN fraction shown in Fig. 9 and Fig. 10. The typical total X-ray luminosity of the 400SD clusters (Fig. 1, ) is erg s-1, so that the average jet power in these clusters is about of their X-ray luminosity (Fig. 12). Comparing the two plots in Fig. 12, we find that the higher ratio of jet power to X-ray luminosity for the lowest redshift bin shown in the bottom panel of Fig. 12 is caused primarily by selection effects. Using an X-ray flux limit reduces the average X-ray luminosity at lower redshifts, while lower luminosity clusters at higher redshifts fall below the detection threshold. Excluding low luminosity clusters ( erg s-1) for the low redshift bin gives an average jet power (star symbols in Fig. 12) that is comparable to the values at higher redshifts, consistent with the average radio power being largely independent of the redshift, as argued in §3.2 (see Fig. 11). It suggests that the average jet power does not depend on the X-ray luminosity of a cluster. If so, the impact of AGN on the gas will be greater in lower luminosity, hence less massive, systems. Fig. 13 shows that the minimum jet power may exceed the power radiated by the ICM in group-scale objects with erg s-1. If the jet power is mostly retained by the hot atmospheres and not radiated away, AGN can cause a net increase of entropy in low mass systems.
3.4. AGN heating
| 250 kpc | 500 kpc | ||||
|---|---|---|---|---|---|
| Ncl | Ndet | heating | Ndet | heating | |
| erg s-1 | keV par-1 | keV par-1 | |||
| 65 | 0.47 | 19 | 56 | ||
| 57 | 19 | 42 | |||
| 47 | 16 | 36 | |||
| 169 | 54 | 134 | |||
From the jet power, we can estimate the mean total energy per particle injected by the radio sources (Table 1)
| (3) |
where is the mean molecular weight and is the proton mass. and are the mean jet power and gas mass, respectively, for the clusters555The mean jet power we estimated is defined within an aperture projected on the sky, but the gas mass here is defined in three dimension. From Fig. 4 and discussions in §3.2, the radio sources in clusters are dominated by central sources. Therefore, the difference between projected and three dimensional mean jet power should not be significant, especially for small aperture like 250 kpc.. The gas mass is calculated from the X-ray luminosity assuming the - relation in Vikhlinin et al. (2009) and a gas mass fraction of . We excluded clusters beyond because their numbers are small. The duration of energy injection, , is estimated as the time interval from to (4.4 billion years). As might be expected from the discussion of Fig. 13, decreases with X-ray luminosity, although the trend is weaker due to the luminosity dependence of the - relation. AGN heating from within the core alone can reach about keV/particle for poor clusters with typical X-ray luminosities of erg s-1. The number increases to keV/particle if the aperture increases to 500 kpc. We have also combined the data for the three X-ray luminosity bins, giving the average AGN energy input per particle for the entire sample in the last column of the table.
We expect the average energy injected by radio sources to be underestimated somewhat due to the radio luminosity cut, particularly for the high redshift clusters. We examine this effect by calculating the contribution from the weaker radio sources ( W/Hz) in clusters lying between redshift 0.1 and 0.3. We further assume that the radio luminosity function does not evolve with redshift. Including the contribution of the weaker sources, the average energy injected by radio sources into clusters at is boosted by within 250 kpc radius and by within 500 kpc. This correction ignores radio sources lying below our 3 mJy radio flux limit. Lowering the limit to mJy and weighting to offset to the flux-dependent completeness of the NVSS survey (Condon et al., 1998), the increase in the average injected energy is negligible (). Since the dependence of jet power on radio power according to Cavagnolo’s calibration is steeper than found previously by Bîrzan et al. (2008), the contribution of weak source is expected to be less important than was found, for example, by Hart et al. (2009).
We note that the numbers in the table are calculated using the mass of gas within R500. The radio sources considered here deposit most of their energy directly into the cluster cores, but current ignorance of the significant heating processes means that we do not know where the bulk of the energy will ultimately reside. If it did remain within the cluster cores, the energy deposited per unit mass would be approximately times666The factor is estimated from the ratio of mass within R500 and 250 kpc radius assuming a simple density profile .) larger than the values given in the table, with a commensurate increase in its local impact. However, our primary objective is to demonstrate that the energy input is significant, even if the energy ends up being spread uniformly throughout much of the cluster atmospheres.
We have limited our jet power calculation in the redshift interval of the sample (). In principle, the energy injected by radio sources should be traced back to the time when BCGs formed (, e.g. van Dokkum & Franx, 2001). Ignoring AGN evolution, the energy injected per particle since would be at least twice the values listed in Table 1. This is a conservative estimate, since the fraction of powerful AGN increases with redshift (e.g. Galametz et al., 2009; Martini et al., 2009) and the contribution of AGN heating is expected to be significantly greater in the past. Furthermore, we should take into account the evolution of clusters over this time scale, so that we cannot simply scale the values in the first three rows of Table 1, which are derived for fixed X-ray luminosity ranges. Naïvely, if we assume that the mass function of 400SD clusters is representative of the “integrated” mass function of clusters since , we can extrapolate the numbers in the last row of Table 1 to provide a rough estimate of the minimum AGN energy injected per particle since . The values we find are keV/particle from AGN within 250 kpc.
Wu et al. (2000) found that the minimum excess energy required to break self-similarity is keV/particle. Therefore, our results suggest that the continuous input of energy from AGN activity at the current rate over the ages of clusters would provide a significant fraction (40%) of the excess entropy (heat) found in the hot atmospheres of clusters. It also implies that AGN heating may be a factor leading to the dearth of strong cooling flows in distant clusters (e.g. Vikhlinin et al., 2007; Samuele et al., 2011). It is unclear whether this heating is being supplied by a self-regulated feedback loop.
4. Summary
We have correlated the positions of clusters from the 400SD cluster survey lying between redshifts 0.1 and 0.6 against radio sources with fluxes above 3 mJy from the NVSS. Radio sources are detected within 250 kpc of the center for 30% of the clusters and within 1Mpc for 50 to 80%, depending on redshift. The first value agrees with the fraction of radio sources in BCGs found by Best et al. (2007) for SDSS clusters, but lies well below the nearly 100% detection rate in strong cooling flows (e.g. Burns, 1990; Edwards et al., 2007; Dunn et al., 2006; Mittal et al., 2009; Cavagnolo et al., 2009). We found that radio power of radio sources in the 400SD clusters does not correlate with the cluster X-ray luminosity. For comparison, Mittal et al. (2009) and Sun (2009) found strong correlations between AGN radio power of BCG host galaxies and the X-ray luminosities of their bright cooling cores, and the correlation disappeared in systems with weak or absent cooling cores. Both of these facts support our conclusion that the 400SD sample is composed primarily of weak or non-cooling core clusters.
We have found no significant correlation between the incidence of radio sources in clusters and the X-ray luminosity. Since the X-ray luminosity of a cluster correlates with its richness, this implies that richer clusters have fewer radio AGN per galaxy. In addition, the density profile of radio sources in clusters peak at the cluster center, implying that BCGs are the dominant radio galaxies in clusters. Apart from the BCG, the rich cluster environment is hostile to the formation of radio AGN, so that the number of radio AGNs does not increase with the number of galaxies.
We have found only modest correlation between radio power and incidence of radio detection in 400SD clusters with redshift. Although it is difficult to completely rule out bias in a flux-limited sample, our results are qualitatively consistent with redshift evolution of the radio AGN detection rate in clusters by e.g. Galametz et al. (2009).
We have estimated the average jet power and the rate of AGN heating in clusters using the scaling relation of Eqn. 2. The average jet power is about erg s-1for radio AGNs within 250 kpc radius of the 400SD clusters and about erg s-1for sources within 500 kpc radius. We found that the average jet power and AGN heating rate do not correlate with total X-ray luminosity of the 400SD clusters. Therefore, the heating rate per particle will be larger in less massive systems. The AGN heating within the core of clusters can reach 0.2 keV/particle for poor cluster with typical X-ray luminosities of erg s-1. These numbers are calculated within the redshift range of our sample, i.e. . If we extrapolate the result to redshift ignoring AGN evolution, the integrated AGN heating per particle will increase by a factor of 2.
If the heated gas is unable to cool quickly enough, the entropy of their hot atmospheres will rise above the values expected from gravitational heating alone. In fact, we found in §3.4 that the amount of AGN heating of the hot atmospheres is a significant fraction () of the heating required to “preheat” clusters (Kaiser, 1991; Wu et al., 2000; McCarthy et al., 2002). This so-called preheating phase is thought to occur during the epoch of galaxy formation at redshifts of 3 and beyond (Kaiser, 1991). Our results suggest that the AGN heating of cluster atmospheres long after the epochs of galaxy and cluster formation, and throughout the formation history of clusters are significant. Thus, the heating that apparently broke the self-similarity of cluster scaling relations appears to have occurred continuously, and not necessarily at a single epoch.
References
- Arnaud & Evrard (1999) Arnaud, M., & Evrard, A. E. 1999, MNRAS, 305, 631
- Balogh et al. (1999) Balogh, M. L., Babul, A., & Patton, D. R. 1999, MNRAS, 307, 463
- Becker et al. (1995) Becker, R. H., White, R. L., & Helfand, D. J. 1995, ApJ, 450, 559
- Best et al. (2007) Best, P. N., von der Linden, A., Kauffmann, G., Heckman, T. M., & Kaiser, C. R. 2007, MNRAS, 379, 894
- Binney & Tabor (1995) Binney, J., & Tabor, G. 1995, MNRAS, 276, 663
- Bîrzan et al. (2008) Bîrzan, L., McNamara, B. R., Nulsen, P. E. J., Carilli, C. L., & Wise, M. W. 2008, ApJ, 686, 859
- Bîrzan et al. (2004) Bîrzan, L., Rafferty, D. A., McNamara, B. R., Wise, M. W., & Nulsen, P. E. J. 2004, ApJ, 607, 800
- Böhringer & Morfill (1988) Böhringer, H., & Morfill, G. E. 1988, ApJ, 330, 609
- Borgani et al. (2005) Borgani, S., Finoguenov, A., Kay, S. T., Ponman, T. J., Springel, V., Tozzi, P., & Voit, G. M. 2005, MNRAS, 361, 233
- Bridle et al. (1989) Bridle, A. H., Fomalont, E. B., Byrd, G. G., & Valtonen, M. J. 1989, AJ, 97, 674
- Brüggen & Kaiser (2002) Brüggen, M., & Kaiser, C. R. 2002, Nature, 418, 301
- Burenin et al. (2007) Burenin, R. A., Vikhlinin, A., Hornstrup, A., Ebeling, H., Quintana, H., & Mescheryakov, A. 2007, ApJS, 172, 561
- Burns (1990) Burns, J. O. 1990, AJ, 99, 14
- Cavagnolo et al. (2009) Cavagnolo, K. W., Donahue, M., Voit, G. M., & Sun, M. 2009, ApJS, 182, 12
- Cavagnolo et al. (2010) Cavagnolo, K. W., McNamara, B. R., Nulsen, P. E. J., Carilli, C. L., Jones, C., & B ?? ?rzan, L. 2010, ApJ, 720, 1066
- Churazov et al. (2002) Churazov, E., Sunyaev, R., Forman, W., & Böhringer, H. 2002, MNRAS, 332, 729
- Condon (1992) Condon, J. J. 1992, ARAA, 30, 575
- Condon et al. (1998) Condon, J. J., Cotton, W. D., Greisen, E. W., Yin, Q. F., Perley, R. A., Taylor, G. B., & Broderick, J. J. 1998, AJ, 115, 1693
- Croft et al. (2007) Croft, S., de Vries, W., & Becker, R. H. 2007, ApJ, 667, L13
- Croston et al. (2005) Croston, J. H., Hardcastle, M. J., & Birkinshaw, M. 2005, MNRAS, 357, 279
- Dunn & Fabian (2006) Dunn, R. J. H., & Fabian, A. C. 2006, MNRAS, 373, 959
- Dunn & Fabian (2008) —. 2008, MNRAS, 385, 757
- Dunn et al. (2006) Dunn, R. J. H., Fabian, A. C., & Celotti, A. 2006, MNRAS, 372, 1741
- Dunn et al. (2005) Dunn, R. J. H., Fabian, A. C., & Taylor, G. B. 2005, MNRAS, 364, 1343
- Ebeling et al. (2000) Ebeling, H., Edge, A. C., Allen, S. W., Crawford, C. S., Fabian, A. C., & Huchra, J. P. 2000, MNRAS, 318, 333
- Ebeling et al. (1997) Ebeling, H., Edge, A. C., Fabian, A. C., Allen, S. W., Crawford, C. S., & Böhringer, H. 1997, ApJ, 479, L101
- Ebeling et al. (2001) Ebeling, H., Edge, A. C., & Henry, J. P. 2001, ApJ, 553, 668
- Edwards et al. (2007) Edwards, L. O. V., Hudson, M. J., Balogh, M. L., & Smith, R. J. 2007, MNRAS, 379, 100
- Evrard et al. (1996) Evrard, A. E., Metzler, C. A., & Navarro, J. F. 1996, ApJ, 469, 494
- Fabian (1994) Fabian, A. C. 1994, ARAA, 32, 277
- Fabian et al. (2005a) Fabian, A. C., Reynolds, C. S., Taylor, G. B., & Dunn, R. J. H. 2005a, MNRAS, 363, 891
- Fabian et al. (2005b) Fabian, A. C., Sanders, J. S., Taylor, G. B., & Allen, S. W. 2005b, MNRAS, 360, L20
- Fabian et al. (2006) Fabian, A. C., Sanders, J. S., Taylor, G. B., Allen, S. W., Crawford, C. S., Johnstone, R. M., & Iwasawa, K. 2006, MNRAS, 366, 417
- Fanaroff & Riley (1974) Fanaroff, B. L., & Riley, J. M. 1974, MNRAS, 167, 31P
- Forman et al. (2005) Forman, W., et al. 2005, ApJ, 635, 894
- Forman et al. (2007) —. 2007, ApJ, 665, 1057
- Fukazawa et al. (1998) Fukazawa, Y., Makishima, K., Tamura, T., Ezawa, H., Xu, H., Ikebe, Y., Kikuchi, K., & Ohashi, T. 1998, PASJ, 50, 187
- Galametz et al. (2009) Galametz, A., et al. 2009, ApJ, 694, 1309
- Gralla et al. (2010) Gralla, M. B., Gladders, M. D., Yee, H. K. C., & Barrientos, L. F. 2010, preprint astro-ph/1010.6011
- Guo & Mathews (2011) Guo, F., & Mathews, W. G. 2011, ApJ, 728, 121
- Hart et al. (2009) Hart, Q. N., Stocke, J. T., & Hallman, E. J. 2009, ApJ, 705, 854
- Jetha et al. (2007) Jetha, N. N., Ponman, T. J., Hardcastle, M. J., & Croston, J. H. 2007, MNRAS, 376, 193
- Kaiser (1986) Kaiser, N. 1986, MNRAS, 222, 323
- Kaiser (1991) —. 1991, ApJ, 383, 104
- Lal et al. (2010) Lal, D. V., et al. 2010, ApJ, 722, 1735
- Ledlow & Owen (1995) Ledlow, M. J., & Owen, F. N. 1995, AJ, 109, 853
- Lin & Mohr (2007) Lin, Y.-T., & Mohr, J. J. 2007, ApJS, 170, 71
- Markevitch (1998) Markevitch, M. 1998, ApJ, 504, 27
- Martini et al. (2007) Martini, P., Mulchaey, J. S., & Kelson, D. D. 2007, ApJ, 664, 761
- Martini et al. (2009) Martini, P., Sivakoff, G. R., & Mulchaey, J. S. 2009, ApJ, 701, 66
- Mathews (2009) Mathews, W. G. 2009, ApJ, 695, L49
- McCarthy et al. (2002) McCarthy, I. G., Babul, A., & Balogh, M. L. 2002, ApJ, 573, 515
- McNamara & Nulsen (2007) McNamara, B. R., & Nulsen, P. E. J. 2007, ARAA, 45, 117
- McNamara et al. (2005) McNamara, B. R., Nulsen, P. E. J., Wise, M. W., Rafferty, D. A., Carilli, C., Sarazin, C. L., & Blanton, E. L. 2005, Nature, 433, 45
- Mendygral et al. (2011) Mendygral, P. J., O’Neill, S. M., & Jones, T. W. 2011, Synthetic Observations of Simulated AGN Jets: X-ray Cavities, 34 pages, 14 figures, accepted for publication in ApJ
- Mittal et al. (2009) Mittal, R., Hudson, D. S., Reiprich, T. H., & Clarke, T. 2009, A&A, 501, 835
- Narayan & Medvedev (2001) Narayan, R., & Medvedev, M. V. 2001, ApJ, 562, L129
- Nulsen et al. (2007) Nulsen, P., McNamara, B. R., David, L. P., Wise, M. W., & Leahy, J. P. 2007, A&AS, 210, 3407
- Nulsen et al. (2005a) Nulsen, P. E. J., Hambrick, D. C., McNamara, B. R., Rafferty, D., Birzan, L., Wise, M. W., & David, L. P. 2005a, ApJ, 625, L9
- Nulsen et al. (2005b) Nulsen, P. E. J., McNamara, B. R., Wise, M. W., & David, L. P. 2005b, ApJ, 628, 629
- O’Dea et al. (2009) O’Dea, C. P., Daly, R. A., Kharb, P., Freeman, K. A., & Baum, S. A. 2009, A&A, 494, 471
- Peterson & Fabian (2006) Peterson, J. R., & Fabian, A. C. 2006, Phys. Rep., 427, 1
- Ponman et al. (2003) Ponman, T. J., Sanderson, A. J. R., & Finoguenov, A. 2003, MNRAS, 343, 331
- Popesso et al. (2005) Popesso, P., Biviano, A., Böhringer, H., Romaniello, M., & Voges, W. 2005, A&A, 433, 431
- Rafferty et al. (2008) Rafferty, D. A., McNamara, B. R., & Nulsen, P. E. J. 2008, ApJ, 687, 899
- Rafferty et al. (2006) Rafferty, D. A., McNamara, B. R., Nulsen, P. E. J., & Wise, M. W. 2006, ApJ, 652, 216
- Randall et al. (2011) Randall, S. W., et al. 2011, The Astrophysical Journal, 726, 86
- Reynolds et al. (2002) Reynolds, C. S., Heinz, S., & Begelman, M. C. 2002, MNRAS, 332, 271
- Roychowdhury et al. (2004) Roychowdhury, S., Ruszkowski, M., Nath, B. B., & Begelman, M. C. 2004, ApJ, 615, 681
- Ruszkowski et al. (2004) Ruszkowski, M., Brüggen, M., & Begelman, M. C. 2004, ApJ, 611, 158
- Samuele et al. (2011) Samuele, R., McNamara, B. R., Vikhlinin, A., & Mullis, C. R. 2011, Evidence for Rapid Redshift Evolution of Strong Cluster Cooling Flows, accepted for publication in ApJ
- Sanderson et al. (2005) Sanderson, A. J. R., Finoguenov, A., & Mohr, J. J. 2005, ApJ, 630, 191
- Sanderson et al. (2003) Sanderson, A. J. R., Ponman, T. J., Finoguenov, A., Lloyd-Davies, E. J., & Markevitch, M. 2003, MNRAS, 340, 989
- Santos et al. (2008) Santos, J. S., Rosati, P., Tozzi, P., Böhringer, H., Ettori, S., & Bignamini, A. 2008, A&A, 483, 35
- Santos et al. (2010) Santos, J. S., Tozzi, P., Rosati, P., & Böhringer, H. 2010, A&A, 521, 64
- Saripalli & Subrahmanyan (2009) Saripalli, L., & Subrahmanyan, R. 2009, ApJ, 695, 156
- Sun (2009) Sun, M. 2009, ApJ, 704, 1586
- van Dokkum & Franx (2001) van Dokkum, P. G., & Franx, M. 2001, ApJ, 553, 90
- Vikhlinin et al. (2005) Vikhlinin, A., Markevitch, M., Murray, S. S., Jones, C., Forman, W., & Van Speybroeck, L. 2005, ApJ, 628, 655
- Vikhlinin et al. (1998) Vikhlinin, A., McNamara, B. R., Forman, W., Jones, C., Quintana, H., & Hornstrup, A. 1998, ApJ, 498, L21
- Vikhlinin et al. (2007) Vikhlinin, A., et al. 2007, Lack of Cooling Flow Clusters at z 0.5, Heating versus Cooling in Galaxies and Clusters of Galaxies, 48
- Vikhlinin et al. (2009) —. 2009, ApJ, 692, 1033
- Voigt & Fabian (2004) Voigt, L. M., & Fabian, A. C. 2004, MNRAS, 347, 1130
- Voit & Donahue (2005) Voit, G. M., & Donahue, M. 2005, ApJ, 634, 955
- Wise et al. (2004) Wise, M. W., McNamara, B. R., & Murray, S. S. 2004, ApJ, 601, 184
- Wu et al. (2000) Wu, K. K. S., Fabian, A. C., & Nulsen, P. E. J. 2000, MNRAS, 318, 889
- Zakamska & Narayan (2003) Zakamska, N. L., & Narayan, R. 2003, ApJ, 582, 162