Insights on the Formation, Evolution, and Activity of Massive Galaxies From Ultra-Compact and Disky Galaxies at
Abstract
We present our results on the structure and activity of massive galaxies at using one of the largest (166 with ) and most diverse samples of massive galaxies derived from the GOODS-NICMOS survey: (1) Sérsic fits to deep NIC3/F160W images indicate that the rest-frame optical structures of massive galaxies are very different at compared to . Approximately 40% of massive galaxies are ultra-compact ( kpc), compared to less than 1% at . Furthermore, most (%) systems at have a low Sérsic index , compared to at . We present evidence that the systems at likely contain prominent disks, unlike most massive systems. (2) There is a correlation between structure and star formation rates (SFR). The majority (%) of non-AGN massive galaxies at , with SFR high enough to yield a 5 (30Jy) 24 m detection have low . Such systems host the highest SFR. (3) The frequency of AGN is at . Most () AGN hosts have disky () morphologies. Ultra-compact galaxies appear quiescent in terms of both AGN activity and star formation. (4) Large stellar surface densities imply massive galaxies at formed via rapid, highly dissipative events at . The large fraction of disky systems suggests cold mode accretion complements gas-rich major mergers at . In order for massive galaxies at to evolve into present-day massive E/S0s, they need to significantly increase (, ). Dry minor and major mergers may play an important role in this process.
1 Introduction
Studies of high-redshift galaxies are essential for testing and constraining models of galaxy formation. Conventional wisdom suggests galaxies are assembled and shaped by a combination of mergers, smooth accretion, and internal secular evolution. Galaxies form inside cold dark matter halos that grow hierarchically through mergers with other halos and gas accretion (Somerville & Primack(1999); Cole et al. 2000; Steinmetz & Navarro 2002; Birnboim & Dekel 2003; Kereš et al. 2005; Dekel & Birnboim 2006; Dekel et al. 2009a; Dekel et al. 2009b; Kereš et al. 2005; Kereš et al. 2009; Brooks et al. 2009; Ceverino et al. 2010), while internal secular evolution (Kormendy & Kennicutt, 2004; Jogee et al. 2005) redistributes accreted material. Within the paradigm of hierarchical assembly, a number of issues remain. It is not known when and how the main baryonic components of modern galaxies (bulges, disks, and bars) formed, but the global stellar mass density rose substantially between , reaching of its present value by (Dickinson et al. 2003b; Drory et al. 2005; Conselice et al. 2007; Elsner et al. 2008; Pérez-González et al. 2008).
It is also not clear how high-redshift galaxies evolve into present-day galaxies. Complex baryonic physics such as mergers, gas dissipation, and feedback are all at work to an extent. There is also mounting evidence that cold-mode accretion (Birnboim & Dekel 2003; Kereš et al. 2005; Dekel & Birnboim 2006; Dekel et al. 2009a; Dekel et al. 2009b; Kereš et al. 2005; Kereš et al. 2009; Brooks et al. 2009; Ceverino et al. 2010) is important for building star-forming galaxies. This process is particularly effective in galaxies with halos of mass below such that cold-mode accretion dominates the global growth of galaxies at high redshifts and the growth of lower mass objects at late times.
High-redshift galaxies are different from local galaxies. Within the framework of hierarchical assembly, early, high-redshift galaxies are expected to be smaller, at a given mass, than their present-day counterparts. The size difference is predicted to be a factor of a few at (Loeb & Peebles 2003; Robertson et al. 2006; Khochfar & Silk 2006; Naab et al. 2007). Several recent studies using rest-frame optical data provide evidence for size evolution among massive galaxies (Guzman et al. 1997; Daddi et al. 2005; Trujillo et al. 2006, 2007; Zirm et al. 2007; Toft et al. 2007; Longhetti et al. 2007; Cimatti et al. 2008; Buitrago et al. 2008; van Dokkum et al. 2008, 2010; van der Wel et al. 2011). Aside from size evolution, there is some evidence that the nature of red galaxies changes at higher redshift. At , the red sequence primarily consists of old, passively evolving galaxies (Bell et al. 2004). Among extremely red galaxies (EROs) at , less than 40% are morphologically early types (Yan & Thompson 2003; Moustakas et al. 2004). It is well known that star formation rates were more intense at higher redshift (Daddi et al. 2007; Drory & Alvarez 2008), and a link has been found between star formation, size, and morphology at . Toft et al. (2007) and Zirm et al. (2007) find from NICMOS rest-frame optical imaging that blue star-forming galaxies are significantly more extended than red quiescent galaxies. Additionally, examples of rapidly star-forming galaxies (SFR yr-1) at , whose ionized gas kinematics are consistent with turbulent rotating disks, are found in the SINS survey (Förster Schreiber et al. 2009; Genzel et al. 2008; Shapiro et al. 2008).
Progress on understanding the evolution of massive galaxies at high redshift has been hindered by significant observational challenges. The deep optical surveys carried out by , such as the Hubble Ultra Deep Field (HUDF, Beckwith et al. 2006) and the Great Observatories Origins Deep Survey (GOODS, Giavalisco et al. 2004), trace rest-frame optical galaxy morphology only out to . At higher , bandpass shifting effects cause filters to trace progressively bluer bands, and optical filters trace rest-frame UV at . UV light traces massive young stars, but manages to set few constraints about the overall mass distribution, making it difficult to probe the structure and mass of galaxy components at early epochs.
Without high-resolution, deep, rest-frame optical imaging, it is not possible to robustly compare structural parameters in galaxies across redshift. NIR imaging is required to probe the rest-frame optical at . Unfortunately, deep NIR imaging with has been completed for a limited number of galaxies over relatively small fields and small volumes at , with most pointings being within the Hubble Deep Fields and the Hubble Ultra Deep Field due to the inefficiency of the NICMOS camera in covering large areas (e.g., Dickinson et al. 2004; Thompson et al. 2005; Zirm et al. 2007; van Dokkum et al. 2008). While ground-based NIR imaging surveys (e.g., Kajisawa et al. 2006; Retzlaff et al. 2010) efficiently cover wide fields at resolutions almost comparable to NICMOS, the depths reached are at least an order of magnitude shallower.
A large area, high-resolution, deep, space-based NIR survey would be bountiful for galaxy formation studies. The GOODS-NICMOS Survey (GNS; Conselice et al. 2011), covering 44 arcmin2 of the GOODS fields with NIC3, is a strong first effort. The GOODS-North and GOODS-South are among the best-studied regions in the sky and are a natural choice for such a survey. The GOODS fields already have deep data from (Giavalisco et al. 2004), IRAC/MIPS (Dickinson et al. 2003a), and Chandra (Giacconi et al. 2002; Alexander et al. 2003; Lehmer et al. 2005; Luo et al. 2008), among others. GNS consists of 60 pointings centered on massive ( ) galaxies at , observed to a depth of magnitudes. The value of GNS lies in the fact that the target fields were optimized to include massive galaxies selected by multiple methods in order to create an unbiased sample (see Conselice et al. 2011). There are additional massive galaxies in each field beyond the 60 main targets, so that there are 82 galaxies with at across all pointings. Thus, the GNS data contain one of the largest samples of very massive galaxies at high redshift with rest-frame optical imaging, and they robustly probe massive galaxies when the Universe was less than 1/3 of its current age, during the epoch of bulge and disk formation.
The goal of this work is to investigate the evolution of massive galaxies over with this unique sample. We take advantage of the existing rich ancillary data to derive star formation rates (SFR) from 24 m detections and look for AGN activity based on X-ray detections and mid-IR SEDs. We correlate rest-frame optical structural parameters with SFR to gain insight into how massive galaxies are expected to evolve.
The plan of this paper is as follows. We discuss the data and sample properties in §2. In §3 we describe the measurement of structural parameters, and in §3.2 we make a detailed comparison with galaxies of similar stellar mass. A detailed artificial redshifting experiment is conducted in §3.3.1 to explore the impact of instrumental and redshift-dependent effects on structural parameters. In 4, we measure star formation properties based on MIPS 24 m detections and discuss how they relate to structural properties. Estimates of the mass and fraction of cold gas in massive star-forming galaxies at are presented in 5. In 6, we use a variety of techniques (X-ray properties, IR power-law, and IR-to-optical excess) to identify AGN and consider how galaxy activity relates to galaxy structure. Finally, in §7 and §8, we discuss and summarize our results. All calculations assume a flat CDM cosmology with and km s-1 Mpc-1.
2 Data and Sample
2.1 Observations and Pointing Selections for GNS
Our data comes from the GOODS-NICMOS Survey (GNS; Conselice et al. 2011). GNS is a deep, 180-orbit survey with the NICMOS-3 camera in the F160W () band that probes optical light from galaxies between . The coverage extends over both GOODS fields and is divided between 60 pointings centered on massive galaxies at . Each pointing covers x and was observed to a depth of three orbits in nine exposures of seconds ( minutes per pointing). A total of sources were detected across an effective area of arcmin2. The limiting magnitude for an extended source with a diameter is =26.8 (AB). The NIC-3 images were drizzled with a pixfrac of 0.7 and output platescale of . The NIC3 camera is currently out of focus,and after detailed investigation (see §A), we find the point spread function (PSF) spans a full width half maximum (FWHM) of with a mean value of .
The 60 GNS pointings were planned by identifying massive galaxies having a photometric redshift of and stellar mass via three color selection criteria. The target galaxies include Distant Red Galaxies (DRGs, Papovich et al. 2006), Extremely Red Objects (EROs, Yan et al. 2004), and -selected galaxies (Daddi et al. 2004). All of these methods are designed to select red dusty or red passively evolving galaxies. DRGs have evolved stellar populations that are identified with (Vega mag). EROs are selected based on and NIR data via (3.6)/. This selection is sensitive to red populations that are either old or reddened, so EROs contain a mixture of young and old stellar populations. galaxies are selected based on the quantity . Galaxies with at are identified as star-forming galaxies. Redder and possibly more evolved galaxies are identified with and . The final pointings were designed to include at least one red massive galaxy and to also maximize the total number of additional galaxies (e.g., Lyman-break galaxies and sub-mm galaxies) within each pointing.
2.2 Our Sample of Massive Galaxies at z=1-3
The sample of massive galaxies that we work with in this paper is not limited to the original color-selected massive galaxies at defining the original 60 GNS pointings. Instead, our sample of massive galaxies at is derived from the set of all galaxies mapped with NIC3/F160W across the 60 fields, and for which a reliable stellar mass and photometric redshift was estimated by Conselice et al. (2011), based on SED fits to the NIC3/F160W and optical imaging. A detailed description of how these quantities were estimated is in Conselice et al. (2011), and we only briefly summarize the methodology here.
The source extraction catalog for the NICMOS images across the 60 pointings of the GNS survey contains sources with and . For those galaxies detected in the and NICMOS bands, we use the available photometric redshifts and stellar masses from Conselice et al. (2011). Photometric redshifts were determined by fitting template spectra to the data. Stellar masses were measured by fitting the magnitudes to a grid of SEDs generated from Bruzual & Charlot (2003) stellar population synthesis models, assuming a Salpeter IMF111 In §4 we use a Chabrier IMF for SFR estimates. Using a Chabrier IMF rather than a Salpeter IMF in estimating the stellar mass would lower the values by a factor of 0.25 dex or less.. The grid includes different colors, ages of stellar populations, metallicities, dust content, and star formation histories as characterized by exponentially declining models. In general, the stellar masses derived depend on the SED used and the assumptions used in the SED modeling, such as the IMF, the metallicity, the extinction law, and star formation history (e.g., Borch et al. 2006; Marchesini et al. 2009; Conselice et al. 2011). The typical uncertainty in stellar mass across the sample is a factor of .
In order to account for a small number (15) of additional massive ( ) red systems, which are undetected in the GOODS and therefore do not have viable stellar masses from the above techniques, we use available masses and redshifts (Buitrago et al. 2008; Bluck et al. 2009) based on deep ground-based data along with ACS data, where available. Photometric redshifts are determined with a mixture of techniques (e.g., neural networks and Bayesian techniques) described more fully in Conselice et al. (2007). Stellar masses were measured from these data with uncertainties of a factor of with the multi-color stellar population fitting techniques from Conselice et al. (2007, 2008). As with the larger sample described above, a stellar mass is produced by fitting model SEDs to the observed SED for each galaxy. A Salpeter IMF is assumed, and the SED grids are constructed from Bruzual & Charlot (2003) stellar population synthesis models.
From the sample of galaxies with photometric redshifts and stellar masses determined as described above, we define the sample of massive galaxies used in this paper. We restrict our analysis to the redshift interval over which our NIC3/F160W images probe the rest-frame optical light in order to avoid bandpass shifts into the rest-frame UV. This ensures that we measure all structural parameters in the rest-frame optical across , thereby reducing bandshift biases (see §3.1 for a quantitative estimate). Although the mass functions calculated for GNS by Mortlock et al. (2011) show that the mass completeness limit is at , we apply a higher mass cut of as our interest is specifically with the most massive galaxies.
Our final sample consists of the 166 (82) massive galaxies with ( ) and . This is the largest -based dataset with rest-frame optical imaging of massive galaxies over . The galaxies with from Buitrago et al. (2008) are part of the sample. The other previous NICMOS studies (e.g., Toft et al. 2007; Zirm et al. 2007; van Dokkum et al. 2008) each contain, at most, systems with . The full distributions of apparent and magnitude, stellar mass, and redshift for this sample are shown in Figure 1.
Figure 2 shows a comparison of the galaxy stellar mass function (SMF) of our GNS-based sample to the published SMF of other NIR-selected samples in the literature, such as the -selected samples of Fontana et al. (2006), Kajisawa et al. (2009) and Marchesini et al. (2009), as well as the IRAC-selected sample of Pérez-Gonzalez et al. (2008). This figure essentially shows that for the mass range ( ) relevant for the GNS-based sample used in our paper, there is good agreement between the SMF of our sample and those from these four studies. In particular, at , the top panel shows that there is very good agreement with our sample, Fontana et al. (2006), and Pérez-Gonzalez et al. (2008) for three different redshift bins between and . In the lower panel, at , the average SMF from Kajisawa et al. (2009) agrees with that of our sample within a factor of over . The SMF from our GNS-based sample and Marchesini et al. (2009) show good agreement at , and are slightly offset at z=1.3 to 2.0. The small offset may not be statistically significant if one includes all the sources of error. The error bars on the GNS mass functions include Poisson errors only. Marchesini et al. (2009) show that the dominant sources of error regarding stellar mass functions are cosmic variance and systematics from the assumptions used in the SED modeling. For a discussion of the SMF for lower mass ( ) galaxies, which are not included in the sample used in this paper, we refer the reader to Mortlock et al. (2011).
In our sample of 166, massive galaxies, spectroscopic redshifts are available for 44 galaxies ( of the sample). These 44 galaxies are all bright with and . Among these 44 galaxies, the median photometric redshift error is (Grützbauch et al. 2010), 7/44 () have , and none have .222 While figure 6 of Conselice et al. (2011) shows that of bright () galaxies with spectroscopic redshifts are catastrophic outliers in photometric redshift with , it should be noted that there are no catastrophic outliers with such large among the 44 galaxies with spectroscopic redshifts in our sample of massive () galaxies at . The outliers with in the GNS survey have stellar masses below the cutoff value of our sample or/and lie outside its redshift range. For the remaining 122/166 () of our sample galaxies without spectroscopic redshifts, photometric redshifts are used. Among these 122 galaxies, 60 () are fainter than , and the uncertainties in photometric redshifts may be larger than the median value of 0.071 cited above.
2.3 Properties and Selection Biases in the Sample
We estimate the number density of massive ( ) galaxies over to be Mpc-3 (see Conselice et al. 2011 for a detailed discussion of the number density of massive galaxies in the GNS sample). The corresponding stellar mass density is Mpc-3. The massive GNS galaxies are collectively 10-100 times more abundant than SMGs, which have space densities of Mpc-3 at (Blain et al. 2002). Rather, the number density is in agreement with published values (Daddi et al. 2005; 2007) for other passively evolving and star-forming galaxies at .
How does our sample break down in terms of the typical color-selection methods, which are usually used to identify massive high redshift galaxies? About 63% (104/166) of this final sample is listed in existing catalogs for DRG (Papovich et al. 2006), (Daddi et al. 2004), or ERO (Yan et al. 2004) galaxy populations. There are 8, 9, and 43 sources that are uniquely listed in one of the DRG, , or ERO galaxy catalogs, respectively. An additional 44 sources are listed in two or more of these catalogs. About 37% (62/166) sources were not previously identified as DRG, ERO, or galaxies.
What are the selection biases impacting our sample? General biases in the selection of massive galaxies in the GNS survey have been discussed in Conselice et al. (2011), and we only discuss below the points relevant for our sample.
The 60 GNS pointings were selected to include massive galaxies identified via three color methods (DRG, , and IERO). Combining all three color criteria, rather than using any single one, is already a step forward compared to many earlier studies because no single criterion would isolate a complete sample of massive galaxies (e.g., van Dokkum et al. 2006; Conselice et al. 2011). These three criteria all pick massive galaxies with red observed colors, but due to the range of criteria involved, they can pick both red dusty systems and red evolved stellar populations.
Another key step that makes our study less biased towards a specific type of massive galaxy is that our working sample at is neither limited to nor defined by the original color-selected massive galaxies. Rather, it is derived from all galaxies within the survey area that are bright enough to be mapped with NIC3/F160W and for which a reliable stellar mass and photometric redshift could be determined by Conselice et al. (2011), as outlined in 2.2. The first potential bias in this final sample is introduced by excluding galaxies that are undetected by NIC3/F160W. The second potential bias is introduced by excluding detected galaxies for which no reliable stellar mass and photometric redshift could be determined. For instance, ultra-dusty galaxies, may not be detected in enough of the optical bands to allow a photometric redshift to be reliably estimated.
We assess the impact of the second bias by estimating how many massive galaxies we might miss due to the lack of available photometric redshift and stellar masses. Of the 8300 sources detected by GNS, 1076 have no photometric redshift and stellar mass measurements. Most (68%) of these 1076 sources are fainter () than our sample of massive galaxies (Figure 1). Among GNS objects as bright () as our sample of massive galaxies, only 8.5%, or 349/4083 have no redshift or stellar mass measurements. Furthermore, not all 8.5% of these bright () sources will be massive, so that this fraction represents an upper limit on the sources we might not include in our sample due to the lack of a photometric redshift or stellar mass measurements.
We next discuss the impact of the first potential bias and the type of objects the GNS survey might not detect. It is relevant to ask whether we might miss galaxies with blue observed colors. We believe this is not the case for the following reasons. As discussed above, our working sample is not strongly biased against galaxies with blue observed colors because it is not limited to those massive galaxies selected by the three color methods (DRG, , and IERO) that preferentially pick galaxies with red observed colors. Secondly, Conselice et al. (2011) explicitly show that many galaxies with blue observed () colors, which would have been undetected by these color selections, do get included in this final sample of massive galaxies for the GNS survey. Nearly all known Lyman Break Galaxies or BX/BM objects (Reddy et al. 2008) at in the GNS fields are detected by the GNS NIC3/F160W imaging (Conselice et al. 2011).
In terms of rest-frame colors, rather than observed colors, it is also important to note that the galaxies detected by GNS at or include systems with both blue and red rest-frame colors. The rest-frame color ranges from about – 2.1 for galaxies in the stellar mass range – (Figure 3). The systems with blue rest-frame colors are preferentially at low masses, while GNS galaxies with at have preferentially red rest-frame colors, in the range of 1.0 to 1.7. These inherently red rest-frame colors of the massive galaxies at could be due to a combination of old stellar populations and dusty young star-forming regions. We checked that the colors are consistent with stellar population synthesis models (based on Bruzual & Charlot (2003) and assuming a Chabrier IMF, an exponentially declining star formation history with a 100 Myr e-folding time). We find that even without dust extinction color rises rapidly. Assuming solar metallicity, is already at an age of 0.5 Gyr and reaches at 2 Gyr. For the case with dust extinction and an optical depth of 1, is after 0.5 Gyr and after 2 Gyr.
3 Structural Properties of Massive Galaxies
3.1 Structural Decomposition
We characterize the massive GNS galaxies with structural decomposition. Ideally, one would like to fit multiple components (bulge, disk, bar, nuclear point source, etc.) in the decomposition, but the diameter (or full width half-maximum) of the PSF (corresponding to kpc at ) prevents such detailed decompositions333For the more extended galaxies multiple components (e.g., bulge and disk) decomposition was attempted with limited success and this is discussed in §7.1.. Instead, we choose to fit the 2D light distributions with only single Sérsic (1968) profiles, which have the form
| (1) |
where is the surface brightness at the effective radius and is a constant that depends on Sérsic index . Knowledge of the PSF is important for deriving structural parameters. We model the PSF (Appendix A) while taking into account both the variation in PSF with position on the NIC3 field and the dependence on the drizzle algorithm. We find a range in PSF FWHM of .
It is clear that a single Sérsic profile is not a complete indicator of overall galaxy structure. For instance, in detailed images of nearby galaxies, the best-fit index for a single Sérsic profile does not always correlate with the bulge Sérsic index obtained with 2D bulge-disk or bulge-disk-bar decomposition (Weinzirl et al. 2009). However, the single Sérsic index is on average a good way to separate disk-dominated galaxies from the class of luminous spheroidal and bulged-dominated galaxies (see §3.3.1), and in studies of high-redshift galaxies the criterion is often used to separate spirals or disk galaxies from ellipticals (e.g., Ravindranath et al. 2004; Bell et al. 2004; Jogee et al. 2004; Barden et al. 2005; Trujillo et al. 2007; Buitrago et al. 2008).
The NIC3/F160W images of the 166 sample galaxies were fit with a single Sérsic component using GALFIT (Peng et al. 2002). In each image, objects that were near, but not blended with, the primary source were masked out. For the fraction () of the primary galaxies that were blended or overlapping with another galaxy identified in the source extraction catalog, the blended sources were each fitted simultaneously with a separate Sérsic profile. Some fraction of primary galaxies appeared morphologically disturbed (, see Figure 4 and §3.2), but these were fitted with only a single Sérsic profile as they only counted as a single galaxy in the source extraction catalog.
Bandpass shifting causes the -band central wavelength to move from 4000-8000 over . The and bins used in Figure 5, for example, correspond to 5333-8000 (-band) and 4000-5333 (-band), respectively. Even with the bandpass shifting, comparing the structural parameters (, ) measured in these two bands to each other and to parameters of galaxies measured in rest-frame is a vast improvement over previous studies forced to compare the rest-frame UV at to the rest-frame optical at . The systematic effects resulting from -band changing from to -band over are small, as can be inferred from studies of nearby galaxies. Graham (2001) presents bulge-disk decompositions of local galaxies based on images in the and bands. The median ratio in -band/-band disk scalelength is 1.13, so that the disks are measured to be slightly larger in the B-band. If similar errors apply here, then the bias due to bandpass shifting is on the order of 10%.
Another important consideration is the effect of potential AGN on the structural fits. When fitting high resolution images of nearby galaxies, it is well known that fitting a galaxy that hosts a point source with a single Sérsic component will lead to an artificially high Sérsic index (typically ; e.g., Weinzirl et al. 2009; Pierce et al. 2010). If a point source is added to the Sérsic model, the index of the Sérsic component falls to more reasonable values. In the case of the massive GNS galaxies at , we expect that the low resolution (, corresponding to 2.5 kpc at ) of the NIC3/F160W images will reduce the effect of potential point sources on the structural decomposition. However, for completeness, we have fitted all the galaxies at in which a potential AGN was identified via a variety of techniques (6) with both a Sérsic component and a point source. The fractional luminosity of the point source components, or PSF/Total light ratio, ranges from 1-46%, with a median of 10%. As expected, including the point source produces generally small changes in (, ) and goes in the direction of lowering and enlarging . Overall, our results are not biased by the presence of AGN. In the rest of the paper, we therefore choose to use the structural parameters for a single Sérsic component fit.
3.2 Derived Structural Properties at
The results of the structural fits to the NIC3/F160W images of the 166 sample galaxies are shown in Table 1, Figure 4, Figure 5, and Figure 6.
Figure 4 shows examples of massive ( ) galaxies at with different ranges of Sérsic index and effective radius . The majority (; Table 1) of the massive GNS galaxies at have kpc. In such systems, structural features are generally hard to discern due to resolution effects, so that systems appear fairly featureless (top 4 rows of Figure 4). In the small fraction of massive galaxies at with large kpc, one can discern some structural features such as an elongated bar-like feature or a combination of a central condensation surrounded by a more extended lower surface brightness component, reminiscent of a bulge and disk (5th row). Row 6 contains morphologically disturbed systems. The fraction of such systems is small, only , but this is a lower limit given redshift-dependent effects such as degraded physical resolution and surface brightness dimming.
The lower two rows of Figure 5 shows the rest-frame optical Sérsic index and effective radius for the samples of massive galaxies at and . For comparison, the top row of Figure 5 also shows the rest-frame optical structural parameters for 0 galaxies of similar stellar mass taken from Allen et al. (2006), who performed a single component Sérsic fit to -band images of galaxies in the Millennium Galaxy Catalogue (MGC), a large ground-based imaging and spectroscopic survey over 37.5 deg2 (Liske et al. 2003; Driver et al. 2005). It is clear from Figure 5, Figure 6, and Table 1 that the massive galaxies at are strikingly offset toward lower (, ) compared to the massive 0 galaxies.
Firstly, we find that the majority ( for , and for ) of massive galaxies at have low 2, while the fraction at 0 is five times lower. We will present evidence in 7.1 that most of the massive systems with a low 2 harbor a massive disk component, so that our results point to the predominance of disk-dominated systems among massive galaxies at .
Secondly, we also find that massive galaxies at typically have smaller than massive galaxies at . In particular, 40% (% for and % for ) of massive galaxies at are ultra-compact ( kpc), compared to less than one percent at 0. The massive ultra-compact ( kpc), galaxies at have few counterparts among massive galaxies.
The population of galaxies with low and the population of ultra-compact ( kpc) galaxies show limited overlap. Only of the systems with low are ultra-compact and the remaining majority ( for , and for ) are extended ( kpc). Conversely, among the ultra-compact ( kpc) systems, nearly half ( for , and for ) have low .
Figure 7 further illustrates the striking difference between massive galaxies at and by comparing their effective radius and their mean rest-frame optical surface brightness within . The value of was measured from the extinction-corrected rest-frame -band light within and is defined as:
| (2) |
where is the extinction-corrected, rest-frame apparent magnitude and and is the correction for surface brightness dimming. The MGC galaxies at are corrected only for Galactic extinction, while for the GNS galaxies the correction includes Galactic and internal extinction. The mean rest-frame optical surface brightness can be 2.0 to 6.0 magnitudes brighter for the massive galaxies at than for massive galaxies. This is due to their smaller sizes and likely differences in the age of the stellar populations. The high mean rest-frame optical surface brightness of the massive galaxies at translates into high mean stellar mass densities, and suggests that highly dissipative events played an important role in their formation (see 7).
It is worth noting that the use of deeper images for the 0 galaxies could make the large offset in (, ) at versus even stronger. The MGC -band images have a median sky background of 22 mag/arcsec2. Low surface brightness halos may be detected around some of the galaxies in deeper exposures. This is true for some massive elliptical and cD galaxies, and in these cases the (, ) are significantly boosted if the halo is region is also fitted (Kormendy et al. 2009).
How do these results compare with earlier studies? While many of the earlier studies focused on small samples, this work is a step forward because of the improved number statistics that come with an unbiased and complete sample of massive galaxies. The observed apparent size evolution in our data generally agrees with results reported in other studies of massive galaxies (e.g., Daddi et al. 2005; Trujillo et al. 2007; Zirm et al. 2007; Toft et al. 2007; Buitrago et al. 2008; van Dokkum et al. 2008; 2010; Williams et al. 2010).
The ratio in of high-redshift galaxies with respect to galaxies, or , can be modeled as a power law in redshift of the form , where and are constants. Using the massive ( ) MGC galaxies as the normalization, we measure and for different subsamples of the massive galaxies and summarize the results in Table 2. For all galaxies the slope is -1.30 for a fit over . For disk-like galaxies is also -1.30, and for galaxies is -1.52. For non-AGN host galaxies with detected above the detection limit (see §4), is -1.21, while for non-AGN host galaxies not detected by the slope is substantially steeper (-1.67).
These results are comparable to the findings of earlier studies. Buitrago et al. (2008) show for massive ( ) galaxies over that varies from -0.8 for disk-like galaxies to -1.5 for spheroidal galaxies. Williams et al. (2010) find is -0.88 for all massive () galaxies over . van Dokkum et al. (2010) find a slope of -1.27 for massive ( ) galaxies over z=0-2, which is a good match to our slope (-1.30) for massive ( ) galaxies of all over . Compared to massive galaxies, the implied mean size evolution is a factor of from and a factor of from . In order to determine whether this apparent size evolution is real, one needs to address a number of systematic effects, as outlined in the next section.
3.3 Impact of Systematic Effects on Structural Properties
In the previous section we found that the massive galaxies at are strikingly offset toward lower (, ) compared to the massive 0 galaxies. It is relevant to ask whether the large fraction of low (, ) systems we observe among massive galaxies at , compared to massive galaxies at 0 is real or due to a number of systematic effects. We address the most important effects in the main text and include the others in Appendix B. We consider the issues listed below:
-
1.
Is it possible that the distribution of (, ) for massive galaxies at and at is intrinsically similar, but that some selection effects at is making us preferentially detect the compact low systems, thereby causing an artificial excess of the latter? We argue that this is very unlikely because even if we take all the massive compact low systems at , and appropriately scale them for the difference in number density between and , we still would fall way short of reproducing the observed number densities of compact low systems. The number density of massive ( ) galaxies at is approximately 30% that at . If we take the most compact ( kpc) and low systems at , and scale this number by 30%, we find a much lower number density ( gal Mpc-3), than the observed no density ( gal Mpc-3) at for such compact systems.
-
2.
Can redshift-dependent systematic effects cause structural parameters, such as the high Sérsic index of massive galaxies at 0, to ‘degrade’ into the regime of low values, measured in the systems. We address this issue in 3.3.1.
-
3.
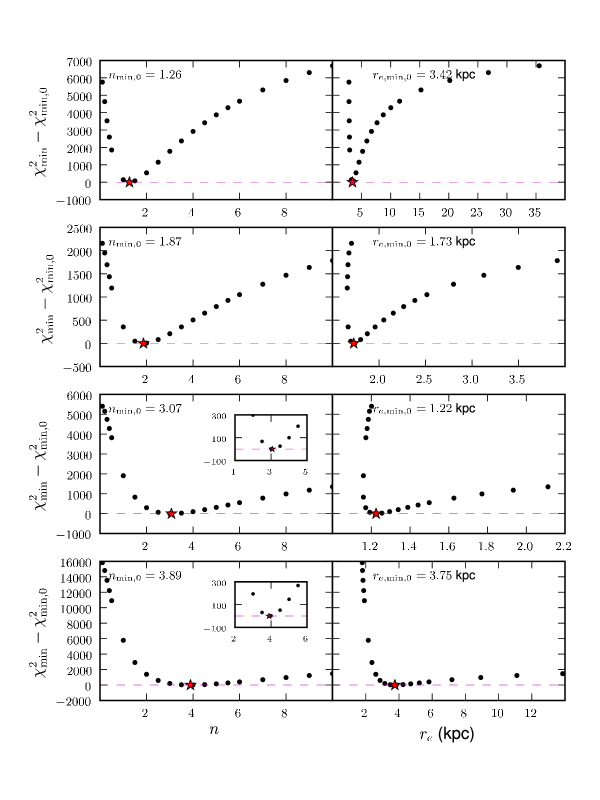
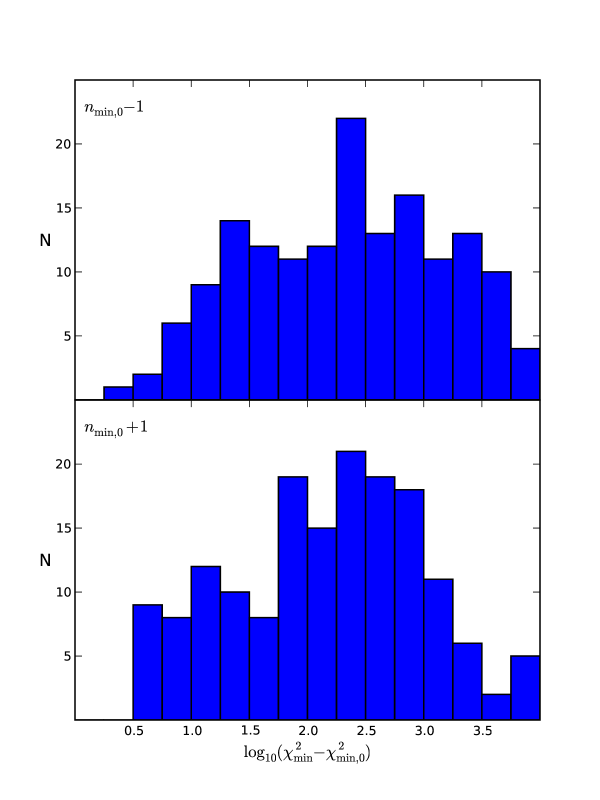
How robust are our fits to the NIC3/F610W images of the galaxies? Could some of the galaxies with a best-fit Sérsic index have similarly good fits with much higher ? We show in Appendix B.1 and Appendix B.2 that this is unlikely. We are confident that the fraction of systems is not being overestimated.
-
4.
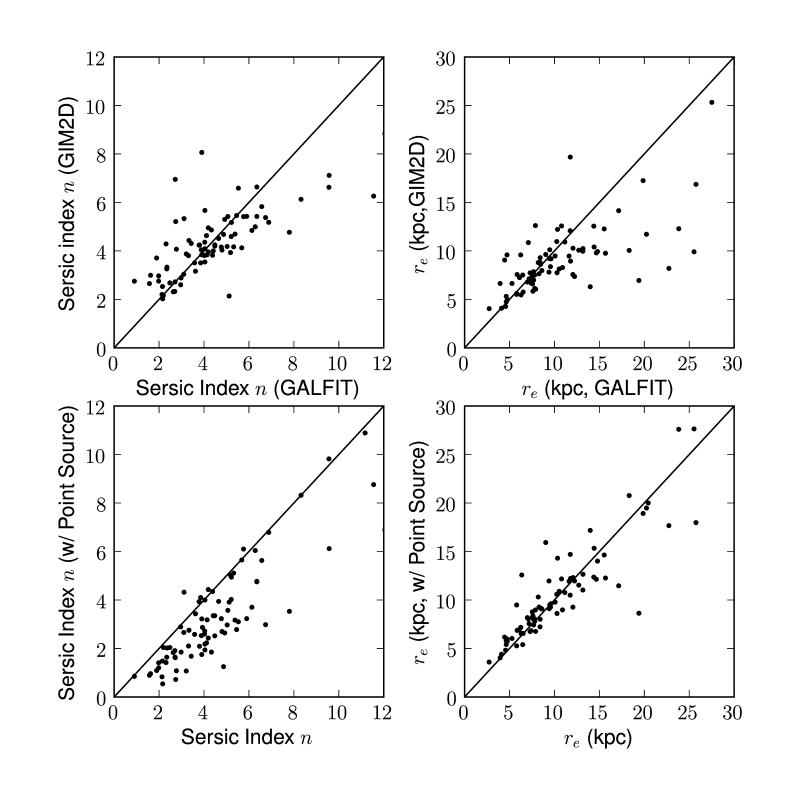
Can the offset in (, ) between the galaxies and the 0 galaxies be caused by systematic differences between the fitting techniques applied by us to the NIC3/F610W images of galaxies and the fitting techniques used by Allen et al. (2006) on the -band images of the massive 0 galaxies in MGC? We conduct additional tests (see Appendix B.3) and conclude that this is also not the case.
3.3.1 Artificial Redshifting
We next investigate whether redshift-dependent systematic effects could potentially cause the offset in (, ) shown in Figure 5 between massive galaxies at 0 and , by causing the (, ) of massive 0 galaxies to ‘degrade’ into the regime of low and low exhibited by the systems.
Ideally one would investigate this question by artificially redshifting the entire MGC subsample of 385 massive 0 galaxies shown in Figure 5 out to , and re-decomposing the redshifted galaxies. However, this is extremely time consuming, and, furthermore, many of the galaxies do not have high quality SDSS images which are needed for redshifting software (FERENGI; Barden et al. 2008) to work. We therefore decide to artificially redshift a smaller, but representative sample S1 of 255 galaxies. S1 consists of 42 massive ( ) MGC galaxies combined with 213 nearby () massive galaxies having high quality and well-resolved SDSS imaging. We ensure the (, ) of the 255 galaxies in S1 match those of the entire subsample of MGC galaxies shown in Table 1, Figure 8, and Figure 9. We also ensure that the distribution of Hubble types of sample S1 matches those of the MGC subsample; the MGC subsample contains E/S0 galaxies versus Spirals, while sample S1 is E/S0 galaxies and Spirals. Many of the galaxies in S1 are well studied and include E, S0, and Sabc galaxies from Barden et al. (2008), E galaxies in Kormendy et al. (2009), as well as S0s and bulge-dominated spirals from Eskridge et al. (2002).
We used FERENGI (Barden et al. 2008) to artificially redshift the SDSS images (tracing rest-frame UV-to-optical light) of galaxies, out to , and re-observe them with the NIC3 F160W filter to the same depth as the GNS survey. During this process, FERENGI mimics the effects of surface brightness dimming, instrumental resolution, transmission efficiency, and PSF effects. It also corrects for other geometrical effects of cosmological redshift by appropriately re-binning input images for the desired redshift and platescale.
Specifically, during artificial redshifting, as is standard convention, FERENGI assumes surface brightness dimming at the rate of for the bolometric luminosity of the full redshifted rest-frame optical SED. For galaxies where only part of this redshifted rest-frame optical SED falls within the NIC3/F160W filter bandwidth, the observed flux per unit wavelength relates to the rest-frame luminosity per unit wavelength at redshift via a dependence (e.g., Weedman 1986). The exact surface brightness dimming in such a case will be set by the integral of over the filter-detector response function and depends on the detailed shape of the SED (e.g., Hogg 1999; Hogg et al. 2002). In practice, when using the FERENGI software, the relevant degree of surface brightness dimming is automatically applied when FERENGI convolves the redshifted images with the NIC3 F160W PSF and then re-observes the redshifted SED with the NIC3 F160W () filter-detector, while taking into account the filter-detector characteristics, such as bandwidth and transmission efficiency. An exposure time of three-orbits (8063 seconds) and a resolution of /pixel is assumed to mimic the GNS survey. A sky background equal to the mean sky background of the GNS NIC3 images (0.1 counts/second) was added to the redshifted images. Poisson noise, sky noise, and read noise (29 for NIC3) were then added to the redshifted images.
During artificial redshifting of local galaxies, it is standard procedure to incorporate surface brightness evolution (Barden et al. 2008) because galaxies at higher redshifts have been observed to have higher mean surface brightness after applying the standard correction for the geometrical effect of cosmological surface brightness dimming. For instance, Lilly et al. (1998) find that surface brightness for disk-dominated galaxies of similar properties increases on average by 0.8 magnitudes by . Barden et al. (2005) find from the GEMS ACS survey that galaxies with show a brightening of magnitude in rest-frame -band by . Labbé et al. (2003) find a disk-like galaxy with spectroscopic redshift to have a rest-frame -band surface brightness magnitudes brighter than nearby galaxies. Finally in our own study, the mean surface brightness within of massive galaxies at is 2 to 6 magnitudes higher than that of massive galaxies at 0, with a mean offset of magnitudes (Figure 7).
In our experiment of artificially redshifting massive galaxies from 0 to , we applied a conservative value of 2.5 magnitudes of surface brightness evolution. This value is motivated by several considerations: a) 2.5 magnitudes of surface brightness evolution is on the conservative side as many of the massive galaxies at show even more evolution (Figure 7). Thus, using this value will not lead to overoptimistic recovery of faint features during the experiment; b) The adopted 2.5 magnitudes of evolution out to corresponds to one magnitude of brightening per unit redshift. This rate of brightening is comparable to those seen in studies out to (Lilly et al. 1998; Barden et al. 2005; Labbé et al. 2003); c) Using the Bruzual & Charlot (2003) models, one can show that the passive evolution of a single stellar population from to , assuming an exponentially declining star formation history associated with an e-folding time of 100 Myr, will lead the rest-frame luminosity to decline by 2.5 to 3 magnitudes, depending on the chosen metallicity.
While we believe that 2.5 magnitudes of surface brightness evolution is a conservative and reasonable value to use during the artificial redshfiting experiment, for the sake of completeness, we have also tested the effect of applying a surface brightness evolution (brightening) of 0, 1.25, 2.5, and 3.75 magnitudes between and . There is a discernible difference in the recovered morphology and structural parameters between 0 and 1.25 magnitudes of brightening, but less difference between 1.25, 2.5, or 3.75 magnitudes of brightening. More details on the use of zero surface brightness evolution are given in point 4 at the end of this section.
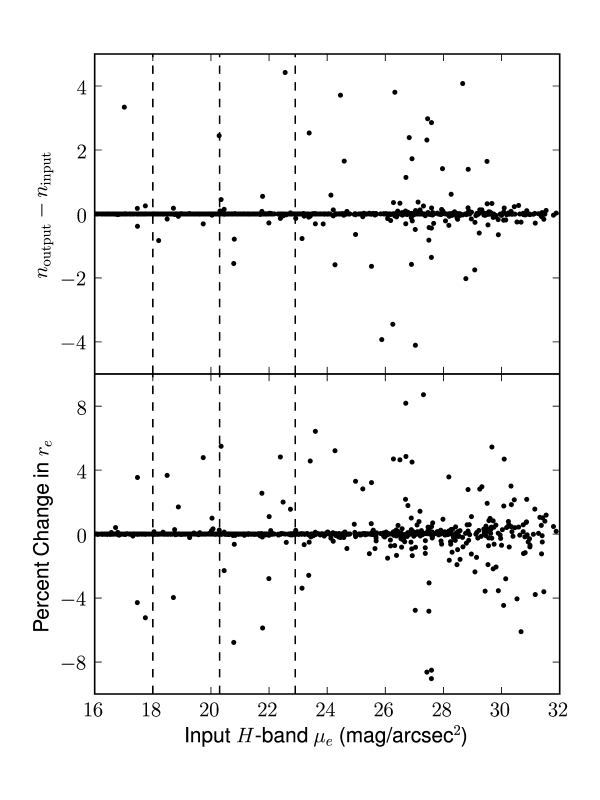
After artificially redshifting S1 from to , we fit both the original galaxy images and their redshifted counterparts with single Sérsic profiles. We compare the rest-frame optical structural parameters in the original and redshifted images in order to assess the influence of redshift-dependent systematic effects (e.g., surface brightness dimming, loss of spatial resolution) and see how well the structural parameters are recovered. We also compare the redshifted distribution of (, ) to the one actually observed in the GNS massive galaxies to assess whether they are similar. Note that the structural parameters are measured at 0 from -band images, while at they are measured from the artificially redshifted images in the NIC3/F160W band so that all parameters are measured in the rest-frame blue optical light, thereby avoiding bandpass shifting problems. Our main results are outlined below.
-
1.
Figure 8 shows the (, ) distribution obtained by redshifting the sample S1 (magenta points in row 1) of 255 massive galaxies to 2.5 (blue points in row 2). This redshifted distribution of (, ) is still significantly offset from those observed in the massive GNS galaxies at (red points in row 2).
This difference is shown more quantitatively in Figure 9 where results in discrete bins of and are compared. The massive galaxies at (red line) includes % of systems with low , while the corresponding fraction for the redshifted sample (blue line) is %. Similarly, for the distribution of the massive galaxies at , % have kpc, while the redshifted sample has %. We therefore conclude that cosmological and instrumental effects are not able to account for the large offset shown in Figure 8 and Figure 9 between the (, ) distributions of the massive galaxies at and those at 0.
-
2.
It is very interesting to look at how the structural parameters of galaxies of different morphological types change during the redshifting. Figure 10 compares the rest-frame optical structural parameters in massive E, S0, and spirals at 0 to the structural parameters recovered after these galaxies were artificially redshifted.
From Figure 10, one can see that is recovered to better than a factor of 1.5 for the vast majority of redshifted E/S0 and spirals of early-to-late Hubble types. In the case of a small fraction of 0 galaxies with highly extended halos or disks and associated large , the recovered at can be nearly a factor of two lower than the original at 0. Inspection of the surface brightness profiles shows that this effect primarily happens because surface brightness dimming prevents the outer lower surface brightness components of the galaxies from being adequately recovered after redshifting.
It is striking that even after redshifting out to , practically none of the massive galaxies fall into the regime of kpc (shown as shaded areas) inhabited by the ultra-compact systems, which make up 40% (% for and % for ) of the massive galaxies at (see 3.2). Thus, these massive ultra-compact ( kpc) systems at appear to truly have no analogs among massive galaxies, in terms of their size, structure, and optical surface brightness.
The top row of Figure 10 shows the distribution of Sérsic index before and after redshifting out to . The recovered Sérsic index can be lower or higher than the original at , but is recovered to better than a factor of two in all cases. The shaded area in the plots represents the regime of where the majority ( for and % for ) of massive GNS galaxies at lie (Table 1). It is interesting to note that massive E and S0s, which are spheroid-dominated and bulge-dominated systems, do not typically lie in the regime, before or after redshifting. In contrast, a large fraction of spirals with intermediate-to-late Hubble types444The Hubble types are based on the bulge-to-total light ratio (), which we measured with bulge-disk and bulge-disk-bar decomposition of 0 -band images. populate the regime, both before and after redshifting. Disk features on large and small scales (e.g., outer disk or disky pseudobulge) lead to an overall single Sérsic index for the entire galaxy. It is possible that similar disk features are responsible at least in part, for the low values shown by the majority () of the massive GNS galaxies at . We discuss this point further in §7.
-
3.
One important question is whether the use of deeper images of the 0 galaxies would change the conclusion of the redshfiting experiment. In the present experiment, we used SDSS -band images, which have an exposure time of 54 seconds and a typical sky background of 22 mag/arcsec2. Deeper exposures of nearby galaxies may potentially detect an outer low surface brightness halo (if such a halo exists), which is missed in the SDSS images, and in that case lead us to measure larger (, ) at 0 with a Sérsic fit. Such halos can be found in very local massive elliptical and cD galaxies, where the measured (, ) can increase significantly if the halo is included in the fit (Kormendy et al. 2009). However, such low surface brightness halos will be dimmed out and not recovered during the artificial redshifting of these deep images, so that the (, ) parameters recovered at will be similar to those we presently obtain from the SDSS images. The net effect will be that using deeper images of local massive galaxies during the artificial redshifting will at most raise the (, ) at 0, but not at . Thus the difference in the (, ) at compared will be unchanged (for systems without halos) or amplified (for systems with such halos). Our overall conclusion from the redshifting experiment regarding degradation of the profiles to and kpc would remain unchanged or be even stronger.
-
4.
Finally, as one additional test, we repeated the redshifting experiment assuming zero surface brightness evolution, rather than 2.5 magnitudes of brightening, out to . Even in this case there is still a large offset in the (, ) distributions of the redshifted sample S1 compared to the massive GNS galaxies. Specifically, the fraction of systems with low (%) is still significantly less than that for massive GNS galaxies at (%). Likewise, there are still few systems with kpc (%) compared to the high fraction (%) found at . Thus, even without surface brightness evolution it is still true that cosmological and instrumental effects are not able to account for the large offset between massive galaxies at versus 0.
4 Star Formation Activity
4.1 Matching GNS Galaxies to MIPS 24 m Counterparts
The GOODS Legacy Program (Dickinson et al. 2003a; Dickinson et al. in preparation) provides deep MIPS 24 m observations of the GOODS fields. In the discussion below, we only consider MIPS 24 m counterparts with Jy, the flux limit. The MIPS images have a PSF diameter of ( 42 kpc at ), versus the NIC3/F160W PSF of . MIPS 24 m counterparts of the massive GNS galaxies were identified by selecting the closest MIPS 24 m source within a maximum matching radius of . We initially find 84/166 massive GNS galaxies with MIPS 24 m counterparts with Jy and further refine these matches below.
There are several potential problems with the above procedure. Firstly, it allows for the situation where a given MIPS 24 m source could be matched to several massive GNS galaxies. This would happen if some massive GNS galaxies were crowded within a radius of a few arcseconds so that the MIPS source would be within of all of them. This situation occurs for 2/84 () of massive galaxies with a MIPS counterpart. We reject these two cases, reducing the number of unique and secure matches from 84 to 82.
A second possible caveat is that within the large MIPS 24 m PSF of diameter, there may be several other NIC3/F160W sources, in addition to the main massive GNS galaxy to which the MIPS source is matched. These extra NIC3/F160W sources may even be lower mass galaxies not in our sample of massive ( ) galaxies. In such a scenario, all the extra NIC3 sources could potentially contribute to the MIPS 24 m flux, and assigning all the 24 m flux of the MIPS counterpart to the nearest massive GNS galaxy would overestimate the 24 m flux of this galaxy. In order to assess the extent of this potential problem, we proceed as follows. For the MIPS 24 m counterpart assigned previously to each massive GNS galaxy, we determine how many extra NIC3/F160W sources with , in addition to the massive GNS galaxy, lie within a circle of diameter (i.e., the PSF diameter) centered on the MIPS source. Of the 82 massive GNS galaxies with a secure MIPS 24 m counterpart, 30 involve cases where there are extra NIC3 sources, along with the massive GNS galaxy, inside the MIPS PSF diameter.
Next, we estimate the relative expected contributions of the massive GNS galaxy and the extra NIC3/F160W sources to the overall 24 m flux by using the stellar mass ratio of the main massive GNS galaxy (e.g., ) and of the contaminating source (e.g., ), scaled by a function that takes into account the different redshifts of the two sources. Specifically, for the two sources with stellar mass and , having redshifts and and luminosity distances and , the stellar mass ratio is scaled by . In 8 of 30 cases, the contribution of the extra NIC3 contaminating sources to the overall 24 m flux is that of the main GNS galaxy, and spans to . We reject these latter 8 cases rather than try to correct for the contamination, which in all cases is distributed across two or more nearby galaxies. For the remaining 22 cases, the contamination by extra NIC3/F160W sources is and we deem that our afore-described procedure of assigning all the 24 m flux of the MIPS counterpart to the massive GNS galaxy is reasonable.
Therefore, in summary, 74/166 (%) massive ( ) GNS galaxies have a reliable MIPS 24 m counterpart (with Jy) whose entire flux is assigned to the massive GNS galaxy. In contrast, 82/166 (%), massive GNS galaxies do not have a reliable MIPS counterpart with Jy and in these cases we can only measure upper limits on their SFR. Table 3 lists the fraction of massive GNS galaxies with a MIPS 24 m counterpart as a function of redshift.
4.2 Star Formation Rates
In order to estimate the SFR, the total IR luminosity () over 8–1000 m is first estimated from the observed 24 m flux (corresponding to rest-frame wavelengths of 6–12 m over ) by using SED templates from Chary & Elbaz (2001). Using solely 24 m flux density to measure works well for inferred galaxies at , but is overestimated by a factor of in more luminous galaxies (e.g., Papovich et al. 2007). Early results from Herschel (e.g., Elbaz et al. 2010; Nordon et al. 2010; D. Lutz, private communication) suggest that at , the SFRs extrapolated from 24 m fluxes may overestimate the true SFR, typically by a factor of 2 to 4 and possibly as much as a factor of 10. This overestimate could be due to a rise in the strength of PAH features, changes in the SEDs, or AGN contamination at . Murphy et al. (2009) find that estimates of from 24 m flux density alone are incorrect because the templates used are based on local galaxies with smaller PAH equivalent widths than galaxies of similar luminosity at high-redshift. We account for this discrepancy by making a correction for galaxies with inferred using
| (3) |
where is the infrared luminosity inferred solely from 24 m flux density (R. Chary, private communication). The upper-left and upper-right panels of Figure 11 show the distribution of 24 m flux and the inferred .
The obscured star formation rate can be calculated using the expression
| (4) |
from Bell et al. (2007). This calculation is based on a Chabrier IMF (Chabrier 2003) and assumes that the infrared emission is radiated by dust that is heated primarily by massive young stars. Uncertainties in the SFR estimates are a factor of or higher for individual galaxies.
If an AGN is present, then SFRIR only gives an upper limit to the true SFR. In 6, we adopt several techniques to identify AGN candidates in the sample and estimate the mean SFR for galaxies with and without a candidate AGN (see Table 3). The upper-right panel of Figure 11 shows for AGN and non-AGN, and the bottom panels show SFRIR. The AGN candidates dominate the tail of highest and SFRIR. Among the HyLIRGs555HyLIRGs are defined to have , 9/11 () turn out to be AGN. After excluding the AGN candidates, the mean is a factor of times lower, while the mean SFRIR is reduced a factor of to , and the difference rises with redshift (Table 3).
How do our measurements of SFRIR compare with UV-based SFR derived in other studies of high-redshift galaxies? The left panel of Figure 12 plots SFRIR versus for the massive ( ) GNS galaxies at with 24 m flux above the limit (30 Jy). We demonstrate that the SFR derived at for non-AGN are in approximate agreement with the UV-based SFR from Daddi et al. (2007). Drory & Alvarez (2008) parameterize SFR as a function of mass and redshift for a wide range in stellar mass ( ). In the right panel of Figure 12, the black line shows average SFR versus redshift for a galaxy as calculated by Drory & Alvarez (2008). The mean SFRIR for massive non-AGN GNS galaxies, with SFRIR above the limit, are higher by a factor of over , with the offset worsening with redshift. This disagreement with mean SFRIR is not just a bias caused by the requirement that SFRIR exceed the limit, which selects the most intense star-forming systems at each redshift. Even if the upper limits on SFRIR are included, our SFRIR do not show the same break and flattening seen at by Drory & Alvarez (2008). Finally, Bauer et al. (2011) measure dust-corrected UV-based SFR (SFRUV,corr) for galaxies in GNS over . Among massive ( ) galaxies, SFRUV,corr can differ by as much as a factor of 10, but for higher SFRIR the difference is typically a factor of .
4.3 Relation Between Star Formation and Structure
Figure 13 shows the distribution of SFRIR among systems of different . On the LHS panel, galaxies with SFRIR below the 5 detection limit are shown as downward pointing arrows. The potential AGN candidates identified in 6 are coded separately as is likely overestimating the true SFR in the galaxy. For the histograms on the RHS panel, the y-axis shows the fraction of massive GNS galaxies in each redshift bin, while on the x-axis, we plot the actual value of SFRIR for systems with SFRIR above the 5 detection limit (indicated by the vertical line), and the upper limit for the other systems.
The massive galaxies at display several interesting relations between their star formation activity and structure, as characterized by the Sérsic index . Firstly, among the non-AGN massive ( ) galaxies at , the fraction of galaxies with low having SFRIR high enough to produce a 24 m flux above the 5 detection limit is (53.4%), which is significantly higher than the corresponding fraction () for systems with . Secondly, among the non-AGN massive ( ) galaxies at with SFRIR above the 5 detection limit, the majority (84.6 %) have low , while none have . The corresponding numbers for the redshift bin are % and %, respectively. Thirdly, the RHS panel of Figure 13 shows that the high SFR tail in each redshift bin is populated primarily by systems. While the disky systems have a wide range of SFRIR (21 to 626 yr-1 at , 53 to 1466 yr-1 at ), they include the systems of the highest SFR at both and . Thus, the systems with low seem to be more actively star-forming than the systems of high .
Most ( of systems with low are extended ( kpc) so that a relation is also expected between SF activity and size. We thus investigate next the relationship between SFR and effective radius . The distribution of SFRIR for different ranges is shown in Figure 14. The same convention as for Figure 13 is adopted, with upper limits being plotted for galaxies with SFRIR below the 5 detection limit, and only non-AGN systems being plotted on the RHS panel. We find that among the non-AGN massive ( ) galaxies at , the fraction of ultra-compact ( kpc) objects with SFRIR above the 5 detection limit is only % compared to the fraction (32.4 %) for the whole sample. Thus, among non-AGN massive galaxies over , the ultra-compact ( kpc) galaxies show a deficiency by a factor of of systems with SFRIR above the detection limit, compared to the whole sample. At , the deficiency is a factor of . Furthermore, as illustrated by the RHS panel of Figure 14, although there are some ultra-compact ( kpc) galaxies with high SFRIR, on average, the mean SFRIR of the and is significantly lower than that of more extended galaxies.
5 Constraints On Cold Gas Content
The high estimated SFRIR found in §4 suggest that copious cold gas reservoirs are present to fuel the star formation. For the massive GNS galaxies with SFRIR measurements above the 5 detection limit, we assume half of SFRIR lies within the circularized rest-frame optical half-light radius from single component Sérsic fits, and thereby estimate that the deprojected SFR per unit area as
| (5) |
In galaxies that AGN host candidates, is likely overestimating the true SFR in the galaxy (see 4). If potential AGN candidates are included, ranges from yr-1 kpc-2, with a mean value of yr-1 kpc-2 over . After excluding the potential AGN candidates ranges from yr-1 kpc-2, with a mean value of yr-1 kpc-2. This range is comparable to that seen in BzK/normal galaxies, ULIRGS, and submillimeter galaxies (e.g., see Daddi et al. 2010b).
We use a standard Schmidt-Kennicutt law (Kennicutt 1998), with a power-law index of 1.4 and a normalization factor of , to estimate the cold gas surface density from . The results are uncertain by at least a factor of because different relations between molecular gas surface density and SFR surface density have been suggested for various types of star-forming systems over a broad range of redshifts (Kennicutt 2008; Gnedin & Kravtsov 2010; Daddi et al. 2010b; Genzel et al. 2010; Tacconi et al. 2010). If potential AGN candidates are included, the resulting implied cold gas surface density
| (6) |
ranges from pc-2, with a median value of pc-2 over (Figure 15). The corresponding values after excluding AGN candidates are pc-2, with a median value of pc-2 (Figure 15). These values are again comparable to those observed in BzK/normal galaxies, ULIRGS, and submillimeter galaxies (e.g., see Daddi et al. 2010b).
In the subsequent discussion, we only cite values obtained after excluding AGN candidates, but Figure 15 also shows the values for the full sample of galaxies. Next we estimate the cold gas fraction relative to the baryonic mass within . For each galaxy, we use the above cold gas surface density to estimate the total cold gas mass within the circularized rest-frame optical half-light radius,
| (7) |
ranges from , with a mean value of (Figure 15). The baryonic mass () within is taken to be the sum of cold gas mass and stellar mass within , and we assume that the latter term is half of the total stellar mass of the galaxy.
The cold gas fraction () within the circularized rest-frame optical half-light radius is defined as
| (8) |
The cold gas fraction () ranges from %, with a mean of over (Figure 15). Figure 16 shows how varies as a function of stellar mass and redshift, both with and without the AGN candidates. For galaxies with above the 5 detection limit, the mean (without AGN candidates) rises from to to across the three redshift bins. In comparison, for galaxies, the mean cold gas fraction is to . The error bars are large and there is considerable overlap between the two mass ranges. Still, the highest cold gas fractions within the circularized rest-frame optical half-light radius at a given redshift are found among the less massive galaxies, consistent with downsizing.
Our inferred cold gas fractions () within the circularized rest-frame optical half-light radius can be higher or lower than the total cold gas fraction of the galaxy, depending on whether the molecular gas is centrally concentrated or extended, respectively. While bearing this caveat in mind, we note that our inferred values for are consistent with previous direct measurements of the total cold gas fraction at high-redshift. Daddi et al. (2008, 2010a) report gas fractions of 50-65% in massive ( ) IR-selected galaxies at . Tacconi et al. (2010) also measure cold gas fraction from CO observations of high-redshift galaxies at . For stellar masses spanning , they find cold gas fractions in the range of %.
6 AGN in massive galaxies at
6.1 Frequency of AGN
We use a variety of techniques (X-ray properties, IR power-law, IR-to-optical excess, and mid-IR colors) to identify Active Galactic Nuclei (AGN) among the massive GNS galaxies because selection based on X-ray emission alone may fail at high redshift in the case of Compton-thick AGN where much of the soft X-ray emission is Compton scattered or absorbed by thick columns of gas ( cm-2; Brandt et al. 2006). We briefly summarize here and in Table 4 the number of AGN identified by each of the selection methods666The mid-IR selection criteria of Lacy et al. (2004) and Stern et al. (2005) were investigated but considered unreliable. Contamination from high-redshift star-forming galaxies drastically reduces their accuracy (e.g., Donley et al. 2008). Applying these methods at would add more false-positives than true AGN..
-
1.
X-ray counterparts to the massive GNS sources were searched for in the CDF-N and CDF-S catalogs of Alexander et al. (2003) and Luo et al. (2008), as well as the ECDF-S catalogs of Lehmer et al. (2005). A total of 33/166 massive GNS galaxies had counterparts within across all catalogs.
-
2.
Following Alonso-Herrero et al. (2006) and Donley et al. (2008), we look for AGN power-law emission over using SEDs from the IRAC bands at 3.6, 4.5, 5.8, and 8.0 m. The IRAC SEDs were fit with a power-law SED (). There are only 3/166 sources with power-law index that are considered power-law galaxies (PLGs) and obscured AGN candidates.
-
3.
Heavily obscured AGN may be present in highly reddened, IR-excess galaxies. Fiore et al. (2008) identify obscured AGN candidates in IR-bright, optically faint, red galaxies over using the criteria and . We search for such IR-bright, optically faint systems with in our sample of massive galaxies. -band flux is determined by linear interpolation between the and -band fluxes. We find 25 sources meeting this criteria, of which 16 are new AGN candidates not identified via the above two methods.
Among the 166 massive GNS galaxies at , the AGN fraction is 49/166 or . When the results are broken down in terms of redshift, the AGN fraction rises with redshift, increasing from at to at . The percentage of AGN among all massive GNS galaxies is higher than at , where it is reported that less than 15% of the total 24 m emission at is in X-ray luminous AGN (e.g., Silva et al. 2004; Bell et al. 2005; Franceschini et al. 2005; Brand et al. 2006).
6.2 Relation Between AGN Activity and Structure
We summarize the properties of the AGN host candidates and discuss their implications in terms host galaxy structure.
Figure 17 shows the single Sérsic versus . Most () of the AGN hosts at have kpc and are not ultra-compact. AGN appear to be found preferentially in the more extended galaxies. Indeed, at , the AGN fraction in ultra-compact galaxies is times lower than in extended galaxies ( versus ). At the deficiency is a factor of . Thus, the ultra-compact galaxies are more quiescent in terms of both AGN activity and SFR activity (see §4).
Furthermore, a significant fraction of these AGN () have disky () morphologies. Over half () of the AGN candidates are both disky and not ultra-compact. Similar statistics apply over . The disky nature of AGN hosts at has been measured previously by Schawinski et al. (2011). From decomposition of the rest-frame optical light for 20 AGN imaged with WFC3, they measure a mean Sérsic index of 2.54 and a mean effective radius of kpc. Their results for (, ) are consistent with our results for in Table 4 and Figure 17. Furthermore, Kocevski et al. (2011, in prep.) find from visual classification of rest-frame optical morphologies that of X-ray selected AGN ( erg s-1) at reside in galaxies with visible disks; only reside in pure spheroids.
If the disky AGN host candidates host massive black holes, then massive black holes are present in galaxies that are not dominated by a massive spheroid. In the local Universe, nearly all massive galaxies are believed to host a central supermassive black hole (Kormendy 1993; Magorrian et al. 1998; Ferrarese & Merritt 2000; Gebhardt et al. 2000; Marconi & Hunt 2003), and the black hole mass is tightly related to the bulge stellar velocity dispersion (Ferrarese & Merritt 2000; Gebhardt et al. 2000). This has led to the suggestion that the black hole and bulge or spheroid probably grew in tandem (e.g., Cattaneo & Bernardi 2003; Hopkins et al. 2006). The presence at of luminous and potentially massive black holes in high mass galaxies that do not seem to have a prominent bulge or spheroid may be at odds with this picture.
7 Discussion
7.1 Do Massive Galaxies With at Host Disks?
We have shown in §3.2 that the majority ( for , and for ) of massive galaxies at have low 2, while the fraction at is five times lower. We also demonstrated via artificial redshifting experiments and extensive tests ( and the Appendix) that this difference between and is real and not driven primarily by systematic effects. Furthermore, most () of these with low massive galaxies at are extended with kpc, rather than being ultra-compact.
What is the nature of the large population of galaxies with low at ? We present below different lines of evidence which suggest that many of these massive galaxies at with , particularly the extended ( kpc) systems, likely host a significant disk component.
-
1.
Some insight into the interpretation of values can be gleaned by considering massive galaxies at . As discussed in 3.3.1 and illustrated in Figure 10, massive E and S0s, which are spheroid-dominated and bulge-dominated systems, are predominantly associated with , both at and after artificially redshifting to . In contrast, spiral galaxies of intermediate to low bulge-to-total ratios, often have an overall low Sérsic index (Figure 10) because they have a disk component, such as an outer disk or a central disky pseudobulge (e.g., Kormendy & Kennicutt 2004; Jogee 1999; Jogee et al 2005), which contributes significantly to the total blue light of the galaxy. An extension of these arguments to suggests the large fraction of massive galaxies at with low 2 is driven, at least partially, by the presence of an outer disk or central disky pseudobulge.
-
2.
We next consider the relationship between disk structure and projected ellipticity . The top panels of Figure 18 show the deconvolved ellipticity determined by GALFIT for the massive ( ) galaxies at with and . The lower left and right panels of Figure 18 show the distributions of deconvolved ellipticity determined by GIM2D of similarly massive spiral (Sabc and Sd/Irr) and E/S0777The MGC catalog assigns the ’E/S0’ Hubble type and unfortunately does not allow us to identify Es separately. galaxies in the MGC catalog.
The projected ellipticity distribution of massive galaxies at with is quite different from that of massive E/S0 galaxies. For local E/S0s, the distribution of drops sharply at and there are few systems at . In contrast, for the massive galaxies at with , the distribution continues to rise out to . There is also a significant fraction () of systems with having above 0.5, specifically in the range of 0.5 to 0.75. In effect, a Kolmogorov-Smirnov (KS) test ( Table 5) shows that the galaxies at with have a 0% KS-test probability of coming from the same distribution as local massive E/S0s in MGC. These comparisons suggest that the massive galaxies at with are very different from local bulge-dominated and spheroid-dominated E/S0s.
Among the massive systems with at , are ultra-compact ( kpc). Thus, our conclusion complements the results of van der Wel et al. (2011) who analyze WFC3 images of a small sample of 14 massive ( ), quiescent, and compact ( kpc) galaxies at and report that most () are disk-dominated systems They find that 5 of 14 galaxies are flat in projection and have an ellipticity .
What is the nature of the massive galaxies at with ? Figure 18 and the KS tests in Table 5 show that the massive galaxies at with are more similar to massive Sd/Irr (KS probability of 23.5% and ) and to massive Sabc spirals (KS probability of 4.8% and ) than to massive E/S0s. However, the similarity to massive late-type spirals at is clearly limited, since most massive galaxies at with have smaller half-light radii ( primarily below 7 kpc; Figure 5) than any of the massive systems. It is possible that they host less extended and thicker disks than present-day massive spirals.
Another possibility is that the massive galaxies at with might be related to clump-cluster and chain galaxies (Cowie et al. 1995; van den Bergh et al. 1996; Elmegreen et al. 2005, 2009a, 2009b). Such galaxies very often host disk structures (Elmegreen et al. 2009a), and many of them appear to represent a population of highly clumped disk galaxies viewed at different orientations (Elmegreen et al. 2008; Elmegreen et al. 2005). While clumpy disks may be among the massive GNS galaxies with low , we cannot identify them due to resolution effects. Finally, we note that in principle a low Sérsic index could be the result of a merger that has not fully coalesced. However, as noted in §3.2 most massive GNS galaxies do not visually appear to be made of multiple distorted systems in early phases of mergers. Artificial redshifting of present-day interacting systems show that our GNS images should be able to resolve systems in early phases of merging, such as NGC4568 and NGC 3396, but would be unlikely to resolve late merger phases, such as Arp 220 into two separate systems.
-
3.
Another line of evidence for massive galaxies at with potentially thick disks comes from the SINS survey (Genzel et al. 2008; Shapiro et al. 2008; Förster Schreiber et al. 2009), which provides ionized gas kinematics of star-forming galaxies and finds examples of clumpy, turbulent, and geometrically thick systems having high velocity dispersions ( km/s). About of such systems show rotating disks kinematics. Furthermore, Förster Schreiber et al. (2011) find from NIC2 imaging that five star-forming galaxies with rotating disk kinematics are well-characterized with shallow Sérsic profiles. Compared to these SINS galaxies, the massive GNS galaxies at are more massive on average.
-
4.
In this work (3.1), we fitted the NIC3/F160W images of the massive galaxies at with single Sérsic components, rather than separate bulge and disk components because the low resolution (PSF FWHM of corresponding to kpc at ) of the images prevent reliable multiple component decomposition for all the galaxies, particularly the fairly compact ones. However, for the galaxies with large kpc we attempted a bulge-plus-disk decomposition following the techniques outlined in Weinzirl et al. (2009). The decomposition was reliable only for the more extended systems within this group and yielded bulge-to-total light ratios below 0.4, indeed suggesting the presence of a significant disk component among massive galaxies at with .
-
5.
It is also interesting to note that most ( 72% for ) of these massive galaxies at with low are extended ( kpc) rather than ultra-compact systems. This is in itself does not prove that disk components exist in low systems, but it is suggestive of such a picture. Furthermore, we found in 4.3 that at , the disky systems have a wide range of SFRIR and include systems of the highest SFRIR. This result is generally consistent with the idea that the systems with are actively star-forming and host copious amounts of gas (§5), which tends to settle in disk-like configurations.
-
6.
For completeness, we note that in principle the presence of a massive disk component is not the only way to produce a low Sérsic index in massive galaxies at . For the ultra-compact ( kpc) massive galaxies with , it has been argued that such systems could be somewhat like a massive elliptical, which has a bright high surface brightness central component surrounded by a very extended low surface brightness envelope. If the low surface brightness envelope is somehow not detected by the NIC3/F160W images, then the latter could yield a lower , as the wings of the surface brightness profile would be effectively clipped. However, this scenario does not seem likely since our artificial redshifting experiments (3.3.1) show that massive Es are not degraded into ultra-compact systems. Furthermore, Szomoru et al. (2010) confirm the absence of a low surface brightness halo in an ultra-compact, massive galaxy at from extremely deep ( mag arcsec-2) WFC3 imaging.
In summary, based on all the above tests and arguments, we conclude that the massive galaxies at with , particularly the more extended systems with kpc, likely host a massive disk component, which contributes significantly to the rest-frame blue light of the galaxies.
7.2 Formation of Massive Galaxies By
How do the massive galaxies with ultra-compact ( kpc) and low disky structures form by ? The surface brightness in the rest-frame -band of the massive galaxies at is on average 4.5 magnitudes brighter than massive galaxies (Figure 7). This implies a large mass surface density of young-to-intermediate-age stars had to built up in less than a few Gyr. Implied stellar mass surface densities exceed several pc-2 even for conservative mass-to-light ratios. This implies that rapid and highly dissipative gas-rich events must have led to the formation of these massive galaxies by . Both gas accretion and wet major mergers at are likely to have played an important role because at such high redshifts, the short dynamical timescales associated with mergers, and the short cooling time associated with gas accretion imply that both mechanisms would lead to a rapid buildup of cold gas. The latter can in turn lead to rapid star formation and dense stellar remnants (e.g., Wuyts et al. 2009; Wuyts et al. 2010; Khochfar & Silk 2011; Bournaud et al. 2011).
A further constraint on the formation pathway is provided by the structure of the massive galaxies at . We have shown in §3.2 that as much as % of the massive galaxies at have a low , and we further argued in §7.1 that most of these systems with at likely host a massive disk component. Major mergers of low-to-moderate gas fraction (e.g., ) will typically produce merger remnants with a de Vaucouleurs type profile and a Sérsic index (Naab, Khochfar, & Burkert 2006; Naab & Trujillo 2006). Mergers with moderate-to-high gas fractions are expected to produce lower Sérsic that are still in general . For instance, Figure 14 of Hopkins et al. (2009) show the Sérsic index of major merger remnants for a range of orbits and a range of progenitors with gas fractions spanning from 10-100%. Although some massive () remnants with arise in mergers with , most remnants of gas-rich () mergers have a Sérsic index . Furthermore, Rothberg & Joseph (2004) find from -band imaging of 52 merger remnants that (26/51) have , (19/51) have , and only a small fraction (, 6/51) have . Thus, when considering isolated gas-rich major mergers, namely those not fed by cold streams, it is challenging to produce a population of merger remnants where of the systems have .
The challenge of producing a large population of disky () systems with high SFRs from isolated gas-rich major mergers may be an indication that the accretion of cold gas along cosmological filaments ((Birnboim & Dekel 2003; Kereš et al. 2005; Dekel & Birnboim 2006; Dekel et al. 2009a; Dekel et al. 2009b; Kereš et al. 2005; Kereš et al. 2009; Brooks et al. 2009; Ceverino et al. 2010) may be particularly important in the build-up of massive galaxies by . As merger remnants at acquire gas via cold-mode accretion, a gas disk is expected to form (Khochfar & Silk 2009a; Burkert et al. 2010). Depending on the angular momentum of the accreted gas, it can settle into a compact disk component or into an outer extended disk. Burkert et al. (2010) discuss a scenario where turbulent rotating disks can form, segregating into compact ( kpc) dispersion-dominated () systems and more extended ( kpc), rotation-dominated () disks. The formation of a gas disk via cold-mode accretion and its subsequent conversion into a stellar disk, would lower the overall Sérsic index of the massive galaxies at , making them more in line with the observed values.
However, many key questions remain unanswered. Can theoretical models account for the observed fractions of massive galaxies with low , as well as the fraction of galaxies with ultra-compact ( kpc) sizes? Can the relation between structure, SFR, and AGN activity discussed in §4.3 and §6.2, as well as the range in SFR at a given stellar mass, be accounted for? We will address these questions in a future paper (Jogee et al., in preparation) where we perform detailed comparisons to different theoretical scenarios.
7.3 Transformation of Massive Galaxies at Into Present-Day E and S0s
Next we discuss the transformation of massive galaxies at into their more massive present-day descendants, which are primarily E and S0s. During this transformation, the massive galaxies will need to significantly increase since the majority (%) of massive galaxies at have low 2, while the corresponding fraction among massive systems at 0 is five times lower (Table 1 and Figure 5). Similarly, the galaxies will also need to significantly raise , since approximately 40% of massive galaxies at are in the form of ultra-compact ( kpc) galaxies compared to less than 1% at 0 (Table 1 and Figure 5). In general, the massive galaxies must experience a substantial growth in by up to a factor of , a dimming in rest-frame optical surface brightness within by up to 6 magnitudes (Figure 7), and their must increase to . An increase in (, ) and a dimming in can be achieved via several pathways.
A natural pathway to produce large changes in (, , ) is a dry major merger of two disk systems. This produces a remnant with , a higher , and a lower surface brightness within than the progenitors (Naab, Khochfar, & Burkert 2006; Naab & Trujillo 2006; Naab et al. 2009). In this case, the change in is produced by the transformation of galaxies with disks into systems dominated by spheroids or bulges. This type of transformation must take place from to in many of the massive galaxies because % of them at have , which we argued is indicative of a massive disk in many cases (§7.1). In contrast the E/S0s at 0 are dominated by spheroids or bulges.
Other lines of evidence support the idea that dry major mergers play a role in making the most massive 0 ellipticals. The most massive local ellipticals are found to harbor cores (missing light), which are believed to be scoured by binary black holes that form in dry major mergers (Kormendy et al. 2009). From a study of the tidal features associated with bulge-dominated early-type galaxies, van Dokkum (2005) concludes that today’s most luminous ellipticals form through mergers of gas-poor, bulge-dominated systems. Kriek et al. (2008) focus on massive red-sequence galaxies at with little or no ongoing star formation, finding that the changes in color and number density of galaxies on the high-mass end ( ) of the red sequence from to the present are better explained by a combination of passive evolution and red mergers that induce little star formation, rather than by passive evolution alone.
While dry major mergers play a role in the evolution of massive galaxies, it remains debated whether they can account for the full size and mass evolution of massive galaxies. From a theoretical standpoint, the predicted dry major merger rate appears to be too low. From simulations, Khochfar & Silk (2009b) find that only between of massive ( ) galaxies have had a dry major merger in the last Gyr at any redshift . Hopkins et al. (2010) find from semi-empirical models that the importance of major mergers in bulge formation scales with galaxy stellar mass. Namely, an galaxy with at will experience only one dry major merger at . Shankar et al. (2010) calculate that the frequency of dry mergers increases with final stellar mass, and they find that by massive () early-type galaxies undergo on average dry major merger since their formation.
From an observational standpoint, direct measurements of the dry major merger rate at are highly uncertain. Bell et al. (2006) suggest that present-day spheroidal galaxies with on average have undergone anywhere between 0.5 and 2 dry major mergers since . The analysis carries large uncertainties as it is based on a small number () of observed dry major mergers. Several observational studies report that between 16% to 35% of massive ( ) galaxies have undergone a major merger since (e.g., Jogee et al. 2009; Lotz et al. 2008; Conselice et al. 2009), but it should be noted that most of the major mergers in the above studies are star-forming systems, and there are very few dry major mergers. Robaina et al. (2010) find that galaxies with have undergone, on average, only 0.5 mergers since 0.7 involving progenitor galaxies that are both more massive than . Hammer et al. (2009) focus on starbursts with disturbed ionized gas morphologies and kinematics at 0.65, and they argue based on modeling that Gyr ago 46% of the galaxy population was involved in major mergers, most of which were gas-rich. Kaviraj et al. (2011) find that theoretically and empirically determined major merger rates at are too low by factors of a few to account for the fraction of disturbed systems they find among morphologically classified early-type massive ( ) galaxies at . They suggest that the overall evolution of massive early type galaxies, particularly the low-level star formation activity, may be heavily influenced by minor merging at late epochs. At higher redshifts , higher major merger rates are reported than at (e.g., Conselice et al. 2003), but the frequency of dry major mergers is claimed to be low (Williams et al. 2011).
An alternate pathway that could be at least as important as major mergers consists of consecutive dry minor mergers or accretion of externally formed stars such that stellar mass is cumulatively added to the outskirts of a compact galaxy (e.g., Naab et al. 2009; Feldman et al. 2010). Naab & Trujillo (2006) show that successive minor mergers can, on average, raise the Sérsic index of the merger remnant about as effectively as major mergers. Furthermore, it is claimed from simulations and analytical arguments that dry minor mergers produce a much larger increase in size () and a larger fall in average stellar mass densities within than do dry major mergers (Naab et al. 2009; Bezanson et al. 2009). Shankar et al. (2011) find in simulations that massive ( ) galaxies grow primarily by dry minor mergers, especially at . Oser et al. (2010; 2011) use cosmological simulations to study 40 individual massive galaxies with present-day stellar masses of . They find that massive galaxies at are dominated by “in situ” star formation fueled by in-falling cold gas within the galaxy. As cold-mode accretion becomes inefficient at , accretion of externally created stars (i.e., stellar satellites) dominates at . For galaxies of present-day stellar mass , the average number-weighted merger mass-ratio is 1:16, while the average mass-weighted merger mass-ratio is 1:5. In other words, the mass growth since is dominated by minor mergers with a mass ratio of 1:5. The importance of stellar accretion increases with galaxy mass and toward lower redshift, and it substantially raises the galaxy stellar mass and size. For systems with present-day stellar mass , a size evolution of up to a factor of occurs from to . However, one strong caveat of these simulations is that all their massive ( ) galaxies at are ultra-compact ( kpc), while observations (see Fig. 5) show a large fraction of such massive galaxies at are extended ( kpc), with a wide range in star formation rate. The increase of size and mass induced by minor mergers in these simulations is qualitatively in agreement with our results on size evolution for the ultra-compact systems and also with the inside-out growth reported by van Dokkum et al. (2010) from stacking deep rest-frame -band images of massive galaxies over the redshift range of 0.6 to 2.0.
However, many questions remain unresolved. While dry minor mergers appear to be effective at inducing significant evolution in mass and size from to in the simulations of Oser et al. (2010; 2011), it is unclear if they can really drive the large change in Sersic index required by the observations. Furthermore, these simulations focus only on ultra-compact ( kpc) galaxies, and are not representative of the large dominant population of more extended galaxies at . Finally, it is not clear whether minor mergers can account for the changes in effective surface brightness between and . We will evaluate these issues more thoroughly with a detailed comparison to models in a subsequent paper (Jogee et al. in preparation).
8 Summary
We present a study of the structure, activity, and evolution of massive galaxies at using deep ( limiting magnitude of =26.8 AB for an extended source of diameter ), high resolution (PSF) NIC3/F160W images from the GOODS-NICMOS Survey (GNS), along with complementary ACS, IRAC and MIPS, and Chandra X-ray data. One of the strengths of our study is that the NIC3/F160W data provide rest-frame optical imaging over for one of the largest (166 galaxies with and 82 with ), most diverse, and relatively unbiased samples of massive galaxies at studied to date. Our main results are summarized below.
1. Structure of massive galaxies at rest-frame optical wavelengths: We analyze the rest-frame optical structure of the massive galaxies by fitting single Sérsic profiles to the 2D light distribution in the NIC3/F160W images. We find that the rest-frame optical structures of the massive galaxies are very different at compared to 0, with their Sérsic index and half-light radius being strikingly offset toward lower values compared to 0. (Table 1 and Figure 5). Through extensive tests and artificial redshifting experiments we conclude that the offset in (, ) between massive galaxies at and is real and not primarily driven by systematic effects related to the fitting techniques instrumental effects, or redshift-dependent effects (e.g., cosmological surface brightness dimming and the loss of spatial resolution). In effect, we find a large population of ultra-compact ( kpc) systems, as well as a dominant population of systems with low disky morphologies at . We further describe these populations below.
We find that approximately 40% (% for and % for ) of the massive galaxies at are in the form of ultra-compact ( kpc) galaxies compared to less than 1% at 0 (Table 1 and Figure 5). These ultra-compact galaxies are practically unmatched among massive galaxies, and their surface brightness in the rest-frame optical can be 4-6 magnitudes brighter (Figure 7).
Secondly, we find that the majority ( for , and for ) of massive galaxies at have low 2, while the corresponding fraction among massive systems at 0 is five times lower. Most () of these massive galaxies at with low have kpc, and therefore complement the ultra-compact galaxies. We further explore the meaning of a Sérsic index at , and present evidence that most of the massive galaxies with at , particularly the extended ( kpc) ones, likely host a prominent disk, unlike the majority of massive galaxies at . Our evidence is based on rest-frame optical morphologies, ellipticities, artificial redshifting experiments, as well as bulge-to-total ratios from bulge-plus-disk decompositions of extended systems.
2. Star formation rates: We estimate star formation rates using IR luminosities (8-1000 m) derived from the 24 m flux for massive GNS galaxies having a secure MIPS 24 m counterpart and a 24 m flux exceeding the 5 detection limit of 30 Jy. AGN host candidates are excluded because the inferred IR luminosities overestimate the true star formation rate.
We find a strong link between galaxy structure and SFR. Among the non-AGN massive ( ) galaxies at with SFRIR high enough to yield a 5 (30 Jy) 24 m detection, the majority (84.6 %) have low . While the disky systems have a wide range of SFRIR (53 to 1466 yr-1 at ), they include the systems of the highest SFRIR at both and . In contrast, the massive ultra-compact objects at are less likely by a factor of to have SFRIR above the detection limit, compared to the whole sample of non-AGN massive galaxies.
3. AGN activity: Using a variety of techniques (X-ray properties, IR power-law, and IR-to-optical excess) to identify AGN, we find that 49/166 () of the massive galaxies at are AGN candidates. The AGN fraction rises with redshift, increasing from at to at (Table 4).
We find a relationship between host galaxy structure and AGN activity that complements the relationship between SFR and structure. Among massive galaxies at , AGN appear to be found preferentially in galaxies that are not ultra-compact, as evidenced by the fact that most () AGN hosts have kpc. In fact, at , the AGN fraction in ultra-compact galaxies is times lower than in extended galaxies ( versus ). Thus, ultra-compact galaxies appear quiescent in terms of both SFR and AGN activity. In terms of their Sérsic index , a large fraction () of AGN hosts at have disky () morphologies.
4. Cold gas content: We apply a standard Schmidt-Kennicutt law (Kennicutt 1998) to the SFRIR of the non-AGN host candidates. The high estimated SFRIR suggest that copious cold gas reservoirs are present. We estimate that the average cold gas surface density in non-AGN hosts ranges from to pc-2 at , with a median value of pc-2 (Figure 15). The implied cold gas fraction within the rest-frame optical half-light radius ranges from to , with a mean of at (Figure 15). The highest gas fractions at a given redshift are found among the less massive galaxies, consistent with downsizing.
5. Formation of massive galaxies by : The massive galaxies at already have an average rest-frame optical surface brightness within that can be up to 3-6 magnitudes brighter than massive galaxies. The associated high stellar mass densities imply that massive galaxies at must have formed via rapid, highly dissipative events at . Both gas-rich major mergers and gas accretion at are viable as their associated short dynamical timescales and short gas cooling times at would lead to a rapid buildup of mass. However, the large fraction (%) of massive galaxies at with and disky morphologies suggest that cold-mode accretion at must have played an important role in the build-up of massive galaxies by , since it may be challenging to have such a large fraction of of merger remnants with low from isolated gas-rich major mergers.
6. Transformation of massive galaxies at into present-day E and S0s: In order for massive galaxies at to evolve into massive systems (which are primarily E and S0s), they need to radically change their rest-frame optical structure and distributions of (, ). In particular they need to raise well above 2, increase by an average factor of 3-4, and dim the average rest-frame optical surface brightness. Dry major mergers can induce changes in galaxy size, Sérsic index, and stellar surface density, but they may be too rare to account for all the needed evolution. Successive dry minor mergers have been shown to influence galaxy size, Sérsic index, and stellar surface density in a similar direction. We suggest the transformation of massive galaxies into galaxies will occur through a combination of dry major mergers, minor mergers. We will investigate in the relative importance and efficiency of these mechanisms in a future paper.
References
- Alexander et al. (2005) Alexander, D. M., Bauer, F. E., Chapman, S. C., Smail, I., Blain, A. W., Brandt, W. N., & Ivison, R. J. 2005, ApJ, 632, 736
- Alexander et al. (2003) Alexander, D. M., et al. 2003, AJ, 126, 539
- Allen et al. (2006) Allen, P. D., Driver, S. P., Graham, A. W., Cameron, E., Liske, J., & de Propris, R. 2006, MNRAS, 371, 2
- Alonso-Herrero et al. (2006) Alonso-Herrero, A., et al. 2006, ApJ, 640, 167
- Barden et al. (2008) Barden, M., Jahnke, K., Haüßler, B. 2008, ApJS, 175, 105
- Barden et al. (2005) Barden, M., et al. 2005, ApJ, 635, 959
- Bauer et al. (2011) Bauer, A. E., Conselice, C. J., Pérez-González, P. G., Grützbauch, R., Bluck, A. F. L., Buitrago, F., Mortlock, A., 2011, MNRAS, in press, arXiv:1106.2656
- Beckwith et al. (2006) Beckwith, S. V. W., et al. 2006, AJ, 132, 1729
- Bell et al. (2006) Bell, E. F., Phleps, S., Somerville, R. S., Wolf, C., Borch, A., & Meisenheimer, K. 2006, ApJ, 652, 270
- Bell et al. (2007) Bell, E. F., Zheng, X. Z., Papovich, C., Borch, A., Wolf, C., & Meisenheimer, K. 2007, ApJ, 663, 834
- Bell et al. (2004) Bell, E. F., et al. 2004, ApJL, 600, L11
- Bell et al. (2005) Bell, E. F., et al. 2005, ApJ, 625, 23
- Bell et al. (2006) Bell, E. F., et al. 2006, ApJ, 640, 241
- Bezanson et al. (2009) Bezanson, R., van Dokkum, P. G., Tal, T., Marchesini, D., Kriek, M., Franx, M., & Coppi, P. 2009, ApJ, 697, 1290
- Binney & Merrifield (1998) Binney, J. & Merrifield, M. 1998, Galactic Astronomy (Princeton: Princeton Univ. Press)
- Birnboim & Dekel (2003) Birnboim, Y., & Dekel, A. 2003, MNRAS, 345, 349
- Blain et al. (2002) Blain, A. W., Smail, I., Ivison, R. J., Kneib, J.-P., & Frayer, D. T. 2002, Phys. Rep., 369, 111
- Bluck et al. (2009) Bluck, A. F. L., Conselice, C. J., Bouwens, R. J., Daddi, E., Dickinson, M., Papovich, C., & Yan, H. 2009, MNRAS, 394, L51
- Borch et al. (2006) Borch, A., Meisenheimer, K., Bell, E. F., et al. 2006, A&A, 453, 869
- Bournaud et al. (2011) Bournaud, F., Dekel, A., Teyssier, R., Cacciato, M., Daddi, E., Juneau, S., & Shankar, F. 2011, arXiv:1107.1483
- Brand et al. (2006) Brand, K., et al. 2006, ApJ, 644, 143
- Brandt et al (2006) Brandt et al. 2006, in Physics of Active Galactic Nuclei at all Scales, ed. D. Alloin, R. Johnson, & P. Lira (Berlin: Springer), 185
- Brooks et al. (2009) Brooks, A. M., Governato, F., Quinn, T., Brook, C. B., & Wadsley, J. 2009, ApJ, 694, 396
- Bruzual & Charlot (2003) Bruzual, G., & Charlot, S. 2003, MNRAS, 344, 1000
- Buitrago et al. (2008) Buitrago, F., Trujillo, I., Conselice, C. J., Bouwens, R. J., Dickinson, M., & Yan, H. 2008, ApJL, 687, L61
- Burkert et al. (2010) Burkert, A., et al. 2010, ApJ, 725, 2324
- Cattaneo & Bernardi (2003) Cattaneo, A., & Bernardi, M. 2003, MNRAS, 344, 45
- Ceverino et al. (2010) Ceverino, D., Dekel, A., & Bournaud, F. 2010, MNRAS, 404, 2151
- Chabrier (2003) Chabrier, G. 2003, ApJL, 586, L133
- Chary & Elbaz (2001) Chary, R., & Elbaz, D. 2001, ApJ, 556, 562
- Cimatti et al. (2008) Cimatti, A., et al. 2008, A&A, 482, 21
- Cole et al. (2000) Cole, S., Lacey, C. G., Baugh, C. M., & Frenk, C. S. 2000, MNRAS, 319, 168
- Conselice (2009) Conselice, C. J. 2009, MNRAS, 399, L16
- Conselice et al. (2003) Conselice, C. J., Bershady, M. A., Dickinson, M., & Papovich, C. 2003, AJ, 126, 1183
- Conselice et al. (2008) Conselice, C. J., Rajgor, S., & Myers, R. 2008, MNRAS, 386, 909
- Conselice et al. (2011) Conselice, C. J., et al. 2011, MNRAS, 226
- Conselice et al. (2007) Conselice, C. J., et al. 2007, MNRAS, 381, 962
- Cowie et al. (1995) Cowie, L. L., Hu, E. M., & Songaila, A. 1995, AJ, 110, 1576
- Daddi et al. (2004) Daddi, E., Cimatti, A., Renzini, A., Fontana, A., Mignoli, M., Pozzetti, L., Tozzi, P., & Zamorani, G. 2004, ApJ, 617, 746
- Daddi et al. (2008) Daddi, E., Dannerbauer, H., Elbaz, D., Dickinson, M., Morrison, G., Stern, D., & Ravindranath, S. 2008, ApJL, 673, L21
- Daddi et al. (2005) Daddi, E., et al. 2005, ApJ, 626, 680
- Daddi et al. (2007) Daddi, E., et al. 2007, ApJ, 670, 156
- Daddi et al. (2010) Daddi, E., et al. 2010a, ApJ, 713, 686
- Daddi et al. (2010) Daddi, E., et al. 2010b, ApJL, 714, L118
- Dekel & Birnboim (2006) Dekel, A., & Birnboim, Y. 2006, MNRAS, 368, 2
- Dekel et al. (2009) Dekel, A., Sari, R., & Ceverino, D. 2009a, ApJ, 703, 785
- Dekel et al. (2009) Dekel, A., et al. 2009b, Nature, 457, 451
- Dickinson et al. (2003) Dickinson, M., Giavalisco, M., & GOODS Team 2003a, in The Mass of Galaxies at Low and High Redshift, ed. R. Bender & A. Renzini (Heidelberg: Springer-Verlag), 324
- Dickinson et al. (2003) Dickinson, M., Papovich, C., Ferguson, H. C., & Budavári, T. 2003b, ApJ, 587, 25
- Dickinson et al. (2004) Dickinson, M., et al. 2004, ApJL, 600, L99
- Donley et al. (2008) Donley, J. L., Rieke, G. H., Pérez-González, P. G., & Barro, G. 2008, ApJ, 687, 111
- Driver et al. (2005) Driver, S. P., Liske, J., Cross, N. J. G., De Propris, R., & Allen, P. D. 2005, MNRAS, 360, 81
- Drory & Alvarez (2008) Drory, N., & Alvarez, M. 2008, ApJ, 680, 41
- Drory et al. (2005) Drory, N., Salvato, M., Gabasch, A., Bender, R., Hopp, U., Feulner, G., & Pannella, M. 2005, ApJL, 619, L131
- Elbaz et al. (2010) Elbaz, D., et al. 2010, A&A, 518, L29
- Elmegreen et al. (2008) Elmegreen, B. G., Bournaud, F., & Elmegreen, D. M. 2008, ApJ, 688, 67
- Elmegreen et al. (2009) Elmegreen, B. G., Elmegreen, D. M., Fernandez, M. X., & Lemonias, J. J. 2009a, ApJ, 692, 12
- Elmegreen et al. (2009) Elmegreen, D. M., Elmegreen, B. G., Marcus, M. T., et al. 2009b, ApJ, 701, 306
- Elmegreen et al. (2005) Elmegreen, D. M., Elmegreen, B. G., Rubin, D. S., & Schaffer, M. A. 2005, ApJ, 631, 85
- Elsner et al. (2008) Elsner, F., Feulner, G., & Hopp, U. 2008, A&A, 477, 503
- Eskridge et al. (2002) Eskridge, P. B., et al. 2002, ApJS, 143, 73
- Feldmann et al. (2010) Feldmann, R., Carollo, C. M., Mayer, L., Renzini, A., Lake, G., Quinn, T., Stinson, G. S., & Yepes, G. 2010, ApJ, 709, 218
- Ferrarese & Merritt (2000) Ferrarese, L., & Merritt, D. 2000, ApJL, 539, L9
- Fiore et al. (2008) Fiore, F., et al. 2008, ApJ, 672, 94
- Fontana et al. (2006) Fontana, A., Salimbeni, S., Grazian, A., et al. 2006, A&A, 459, 745
- Förster Schreiber et al. (2009) Förster Schreiber, N. M., et al. 2009, ApJ, 706, 1364
- Förster Schreiber et al. (2011) Förster Schreiber, N. M., Shapley, A. E., Erb, D. K., Genzel, R., Steidel, C. C., Bouché, N., Cresci, G., & Davies, R. 2011, ApJ, 731, 65
- Franceschini et al. (2005) Franceschini, A., et al. 2005, AJ, 129, 2074
- Gebhardt et al. (2000) Gebhardt, K., et al. 2000, ApJL, 539, L13
- Genzel et al. (2008) Genzel, R., et al. 2008, ApJ, 687, 59
- Genzel et al. (2010) Genzel, R., et al. 2010, MNRAS, 407, 2091
- Giacconi et al. (2002) Giacconi, R., et al. 2002, ApJS, 139, 369
- Giavalisco et al. (2004) Giavalisco, M., et al. 2004, ApJL, 600, L93
- Gnedin & Kravtsov (2010) Gnedin, N. Y., & Kravtsov, A. V. 2010, ApJ, 714, 287
- Graham (2001) Graham, A. W. 2001, AJ, 121, 820
- Grützbauch et al. (2010) Grützbauch, R., Chuter, R. W., Conselice, C. J., Bauer, A. E., Bluck, A. F. L., Buitrago, F., & Mortlock, A. 2010, MNRAS, in press, arXiv:1011.4846
- Guzman et al. (1997) Guzman, R., Gallego, J., Koo, D. C., Phillips, A. C., Lowenthal, J. D., Faber, S. M., Illingworth, G. D., & Vogt, N. P. 1997, ApJ, 489, 559
- Hammer et al. (2009) Hammer, F., Flores, H., Puech, M., et al. 2009, A&A, 507, 1313
- Häussler et al. (2007) Häussler, B., et al. 2007, ApJS, 172, 615
- Hogg (1999) Hogg, D. W. 1999, arXiv:astro-ph/9905116
- Hogg et al. (2002) Hogg, D. W., Baldry, I. K., Blanton, M. R., & Eisenstein, D. J. 2002, arXiv:astro-ph/0210394
- Hopkins et al. (2009) Hopkins, P. F., Cox, T. J., Dutta, S. N., Hernquist, L., Kormendy, J., & Lauer, T. R. 2009, ApJS, 181, 135
- Hopkins et al. (2006) Hopkins, P. F., Hernquist, L., Cox, T. J., Robertson, B., & Springel, V. 2006, ApJS, 163, 50
- Hopkins et al. (2010) Hopkins, P. F., et al. 2010, ApJ, 715, 202
- Jogee (1999) Jogee, S. 1999, Ph.D. Thesis,
- Jogee et al. (2005) Jogee, S., Scoville, N., & Kenney, J. D. P. 2005, ApJ, 630, 837
- Jogee et al. (2009) Jogee, S., et al. 2009, ApJ, 697, 1971
- Jogee et al. (2004) Jogee, S., et al. 2004, ApJL, 615, L105
- Kajisawa et al. (2009) Kajisawa, M., Ichikawa, T., Tanaka, I., et al. 2009, ApJ, 702, 1393
- Kajisawa et al. (2006) Kajisawa, M., et al. 2006, PASJ, 58, 951
- Kaviraj et al. (2011) Kaviraj, S., Tan, K.-M., Ellis, R. S., & Silk, J. 2011, MNRAS, 411, 2148
- Kennicutt (1998) Kennicutt, R. C., Jr. 1998, ApJ, 498, 541
- Kennicutt (2008) Kennicutt, R. C., Jr. 2008, in Astronomical Society of the Pacific Conference Series, Vol. 390, Pathways Through an Eclectic Universe, ed. J. H. Knapen, T. J. Mahoney, & A. Vazdekis, 149
- Kereš et al. (2009) Kereš, D., Katz, N., Fardal, M., Davé, R., & Weinberg, D. H. 2009, MNRAS, 395, 160
- Kereš et al. (2005) Kereš, D., Katz, N., Weinberg, D. H., & Davé, R. 2005, MNRAS, 363, 2
- Khochfar & Silk (2006) Khochfar, S., & Silk, J. 2006, ApJL, 648, L21
- Khochfar & Silk (2009) Khochfar, S., & Silk, J. 2009a, ApJL, 700, L21
- Khochfar & Silk (2009) Khochfar, S., & Silk, J. 2009b, MNRAS, 397, 506
- Khochfar & Silk (2011) Khochfar, S., & Silk, J. 2011, MNRAS, 410, L42
- Kocevski et al. (2011) Kocevski, D. D., et al. 2011, ApJ submitted, arXiv:1109.2588
- Kormendy et al. (2009) Kormendy, J., Fisher, D. B., Cornell, M. E., & Bender, R. 2009, ApJS, 182, 216
- Kormendy (1993) Kormendy, J. in the Nearest Active Galaxies (eds Beckman, J., Colina, L., & Netzer, H.) 197-218 (Consejo Superior de Investigaciones Cientificas, Madrid, 1993)
- Kormendy & Kennicutt (2004) Kormendy, J., & Kennicutt, R. C., Jr. 2004, ARAA, 42, 603
- Kriek et al. (2008) Kriek, M., van der Wel, A., van Dokkum, P. G., Franx, M., & Illingworth, G. D. 2008, ApJ, 682, 896
- Krist (1995) Krist, J. 1995, Astronomical Data Analysis Software and Systems IV, 77, 349
- Labbé et al. (2003) Labbé, I., et al. 2003, ApJL, 591, L95
- Lacy et al. (2004) Lacy, M., et al. 2004, ApJS, 154, 166
- Lehmer et al. (2005) Lehmer, B. D., et al. 2005, ApJS, 161, 21
- Lilly et al. (1998) Lilly, S., et al. 1998, ApJ, 500, 75
- Liske et al. (2003) Liske, J., Lemon, D. J., Driver, S. P., Cross, N. J. G., & Couch, W. J. 2003, MNRAS, 344, 307
- Loeb & Peebles (2003) Loeb, A., & Peebles, P. J. E. 2003, ApJ, 589, 29
- Longhetti et al. (2007) Longhetti, M., et al. 2007, MNRAS, 374, 614
- Lotz et al. (2008) Lotz, J. M., Davis, M., Faber, S. M., et al. 2008, ApJ, 672, 177
- Luo et al. (2008) Luo, B., et al. 2008, ApJS, 179, 19
- Magorrian et al. (1998) Magorrian, J., et al. 1998, AJ, 115, 2285
- Marchesini et al. (2009) Marchesini, D., van Dokkum, P. G., Förster Schreiber, N. M., et al. 2009, ApJ, 701, 1765
- Marconi & Hunt (2003) Marconi, A., & Hunt, L. K. 2003, ApJL, 589, L21
- Mortlock et al. (2011) Mortlock, A., Conselice, C. J., Bluck, A. F. L., Bauer, A. E., Grützbauch, R., Buitrago, F., & Ownsworth, J. 2011, MNRAS, 413, 2845
- Moustakas et al. (2004) Moustakas, L. A., et al. 2004, ApJL, 600, L131
- Murphy et al. (2009) Murphy, E. J., Chary, R.-R., Alexander, D. M., Dickinson, M., Magnelli, B., Morrison, G., Pope, A., & Teplitz, H. I. 2009, ApJ, 698, 1380
- Naab et al. (2006) Naab, T., Khochfar, S., & Burkert, A. 2006, ApJL, 636, L81
- Naab et al. (2007) Naab, T., Johansson, P. H., Ostriker, J. P., & Efstathiou, G. 2007, ApJ, 658, 710
- Naab et al. (2009) Naab, T., Johansson, P. H., & Ostriker, J. P. 2009, ApJL, 699, L178
- Naab & Trujillo (2006) Naab, T., & Trujillo, I. 2006, MNRAS, 369, 625
- Nordon et al. (2010) Nordon, R., et al. 2010, A&A, 518, L24
- Oser et al. (2010) Oser, L., Ostriker, J. P., Naab, T., Johansson, P. H., & Burkert, A. 2010, ApJ, 725, 2312
- Oser et al. (2011) Oser et al. 2011, ApJ, in press, arXiv:1106.5490
- Papovich et al. (2006) Papovich, C., et al. 2006, ApJ, 640, 92
- Papovich et al. (2007) Papovich, C., et al. 2007, ApJ, 668, 45
- Peng et al. (2002) Peng, C. Y., Ho, L. C., Impey, C. D., & Rix, H.-W. 2002, AJ, 124, 266
- Pérez-González et al. (2008) Pérez-González, P. G., Rieke, G. H., Villar, V., et al. 2008, ApJ, 675, 234
- Pérez-González et al. (2008) Pérez-González, P. G., et al. 2008, ApJ, 675, 234
- Pierce et al. (2010) Pierce, C. M., et al. 2010, MNRAS, 405, 718
- Ravindranath et al. (2004) Ravindranath, S., et al. 2004, ApJL, 604, L9
- Reddy et al. (2008) Reddy, N. A., Steidel, C. C., Pettini, M., Adelberger, K. L., Shapley, A. E., Erb, D. K., & Dickinson, M. 2008, ApJS, 175, 48
- Retzlaff et al. (2010) Retzlaff, J., Rosati, P., Dickinson, M., Vandame, B., Rité, C., Nonino, M., Cesarsky, C., & GOODS Team 2010, A&A, 511, A50
- Robaina et al. (2010) Robaina, A. R., Bell, E. F., van der Wel, A., Somerville, R. S., Skelton, R. E., McIntosh, D. H., Meisenheimer, K., & Wolf, C. 2010, ApJ, 719, 844
- Robertson et al. (2006) Robertson, B., Cox, T. J., Hernquist, L., Franx, M., Hopkins, P. F., Martini, P., & Springel, V. 2006, ApJ, 641, 21
- Rothberg & Joseph (2004) Rothberg, B., & Joseph, R. D. 2004, AJ, 128, 2098
- Schawinski et al. (2011) Schawinski, K., Treister, E., Urry, C. M., Cardamone, C. N., Simmons, B., & Yi, S. K. 2011, ApJL, 727, L31
- Sersic (1968) Sersic, J. L. 1968, Cordoba, Argentina: Observatorio Astronomico, 1968
- Shankar et al. (2010) Shankar, F., Marulli, F., Bernardi, M., Boylan-Kolchin, M., Dai, X., & Khochfar, S. 2010, MNRAS, 405, 948
- Shankar et al. (2011) Shankar, F., Marulli, F., Bernardi, M., Mei, S., Meert, A., & Vikram, V. 2011, MNRAS submitted, arXiv:1105.6043
- Shapiro et al. (2008) Shapiro, K. L., et al. 2008, ApJ, 682, 231
- Silva et al. (2004) Silva, L., Maiolino, R., & Granato, G. L. 2004, MNRAS, 355, 973
- Simard et al. (2002) Simard, L., et al. 2002, ApJS, 142, 1
- Somerville & Primack (1999) Somerville, R. S., & Primack, J. R. 1999, MNRAS, 310, 1087
- Steinmetz & Navarro (2002) Steinmetz, M., & Navarro, J. F. 2002, NewA, 7, 155
- Stern et al. (2005) Stern, D., et al. 2005, ApJ, 631, 163
- Szomoru et al. (2010) Szomoru, D., et al. 2010, ApJL, 714, L244
- Tacconi et al. (2010) Tacconi, L. J., et al. 2010, Nature, 463, 781
- Thompson et al. (2005) Thompson, R. I., et al. 2005, AJ, 130, 1
- Toft et al. (2007) Toft, S., et al. 2007, ApJ, 671, 285
- Trujillo et al. (2007) Trujillo, I., Conselice, C. J., Bundy, K., Cooper, M. C., Eisenhardt, P., & Ellis, R. S. 2007, MNRAS, 382, 109
- Trujillo et al. (2006) Trujillo, I., et al. 2006, ApJ, 650, 18
- van den Bergh et al. (1996) van den Bergh, S., Abraham, R. G., Ellis, R. S., Tanvir, N. R., Santiago, B. X., & Glazebrook, K. G. 1996, AJ, 112, 359
- van der Wel et al. (2011) van der Wel, A., et al. 2011, ApJ, 730, 38
- van Dokkum (2005) van Dokkum, P. G. 2005, AJ, 130, 2647
- van Dokkum et al. (2006) van Dokkum, P. G., et al. 2006, ApJL, 638, L59
- van Dokkum et al. (2008) van Dokkum, P. G., et al. 2008, ApJL, 677, L5
- van Dokkum et al. (2010) van Dokkum, P. G., et al. 2010, ApJ, 709, 1018
- Weedman (1986) Weedman D. W. 1986. Quasar Astronomy, pp. 60-62. Cambridge: Cambridge University Press
- Weinzirl et al. (2009) Weinzirl, T., Jogee, S., Khochfar, S., Burkert, A., & Kormendy, J. 2009, ApJ, 696, 411
- Williams et al. (2011) Williams, R. J., Quadri, R. F., & Franx, M. 2011, ApJL, 738, L25
- Williams et al. (2010) Williams, R. J., Quadri, R. F., Franx, M., et al. 2010, ApJ, 713, 738
- Wuyts et al. (2010) Wuyts, S., Cox, T. J., Hayward, C. C., Franx, M., Hernquist, L., Hopkins, P. F., Jonsson, P., & van Dokkum, P. G. 2010, ApJ, 722, 1666
- Wuyts et al. (2009) Wuyts, S., et al. 2009, ApJ, 700, 799
- Yan et al. (2004) Yan, H., et al. 2004, ApJ, 616, 63
- Yan & Thompson (2003) Yan, L., & Thompson, D. 2003, ApJ, 586, 765
- Zirm et al. (2007) Zirm, A. W., et al. 2007, ApJ, 656, 66
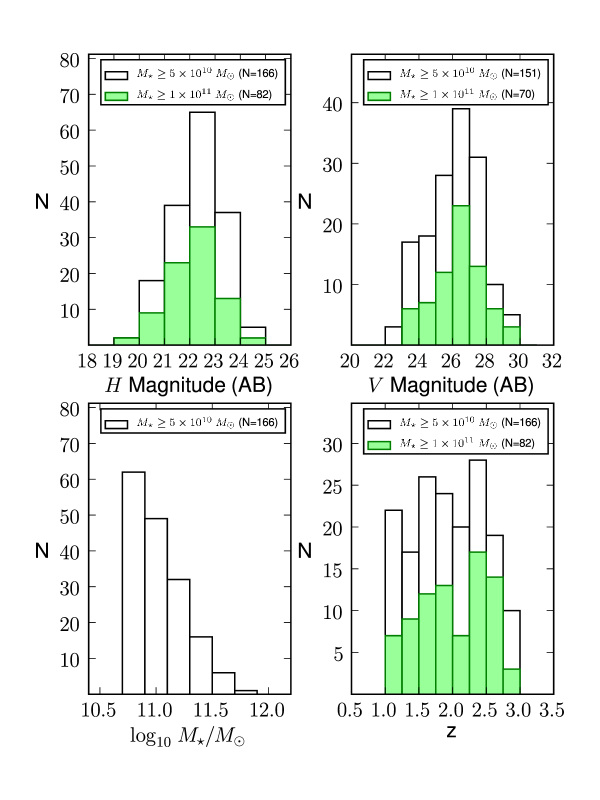
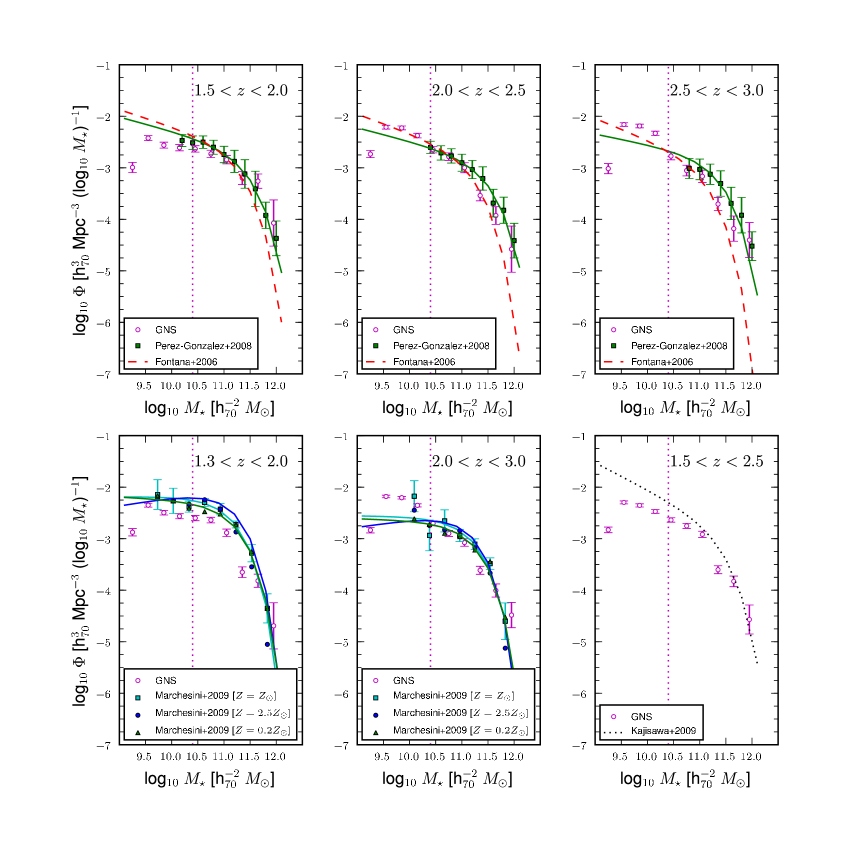
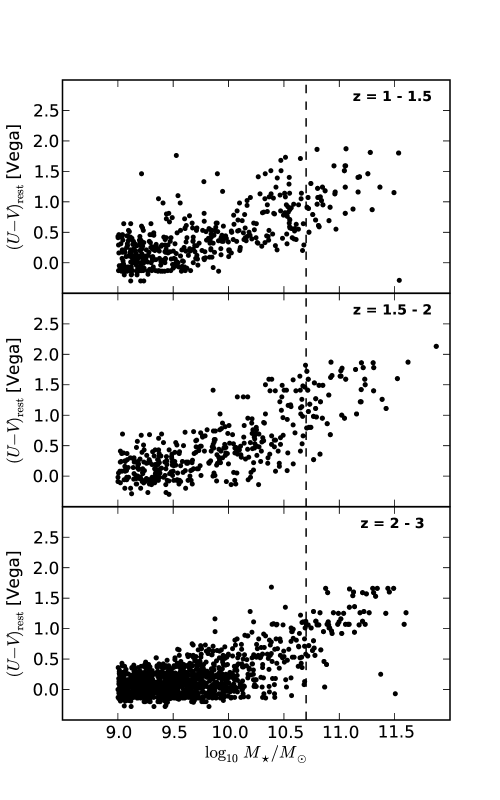
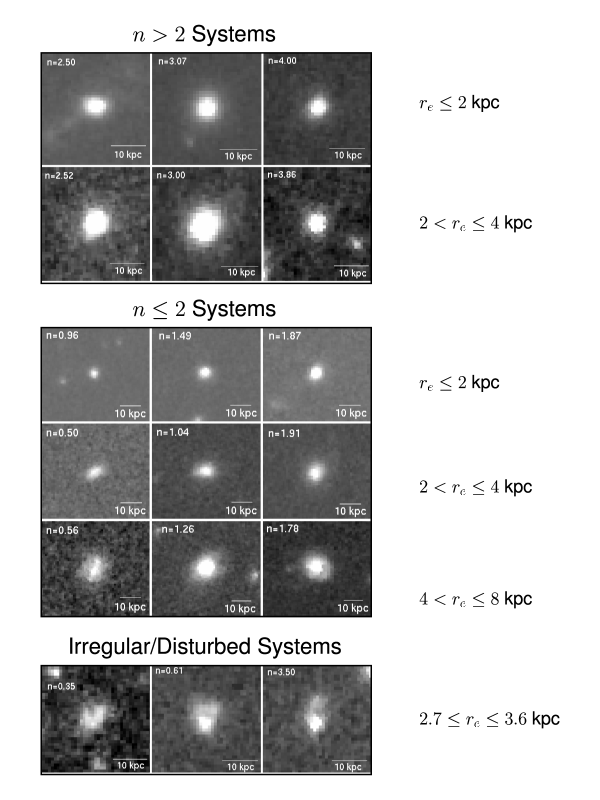
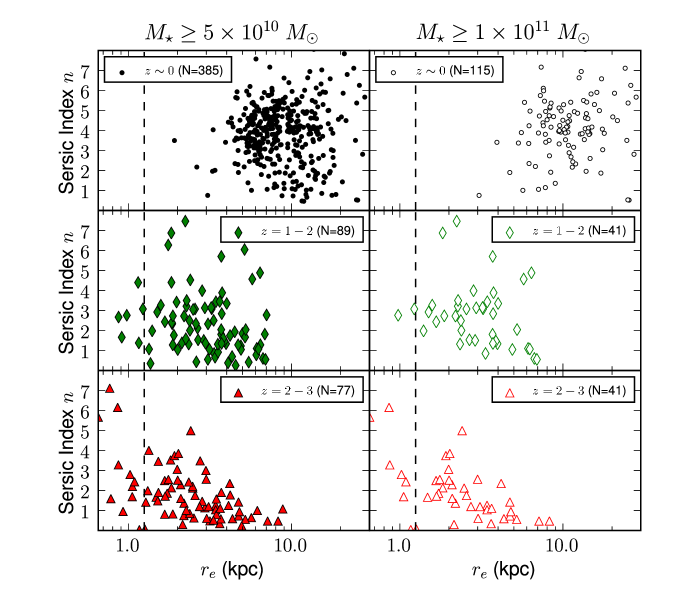
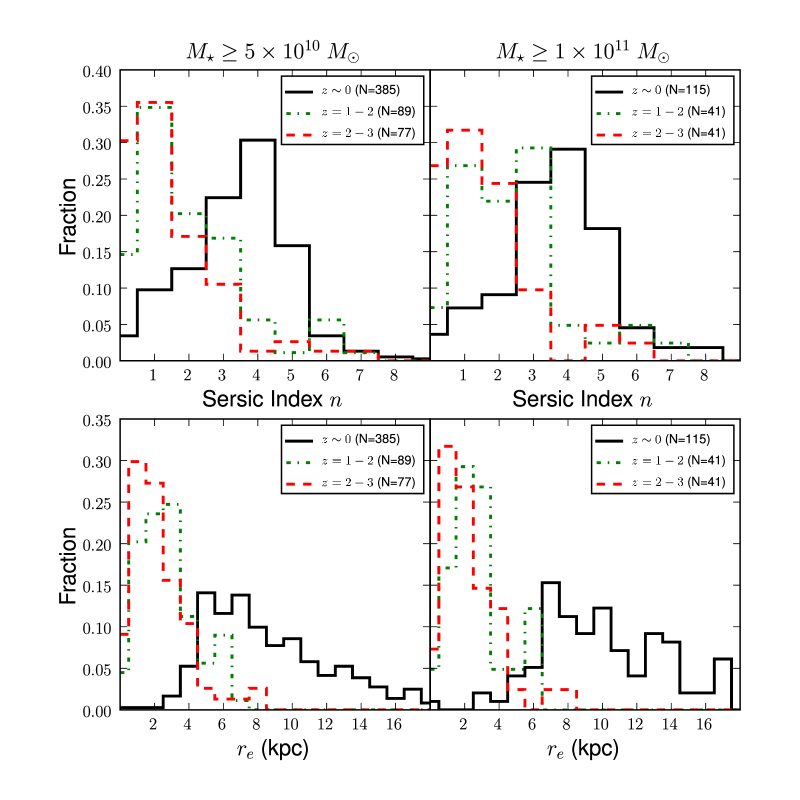
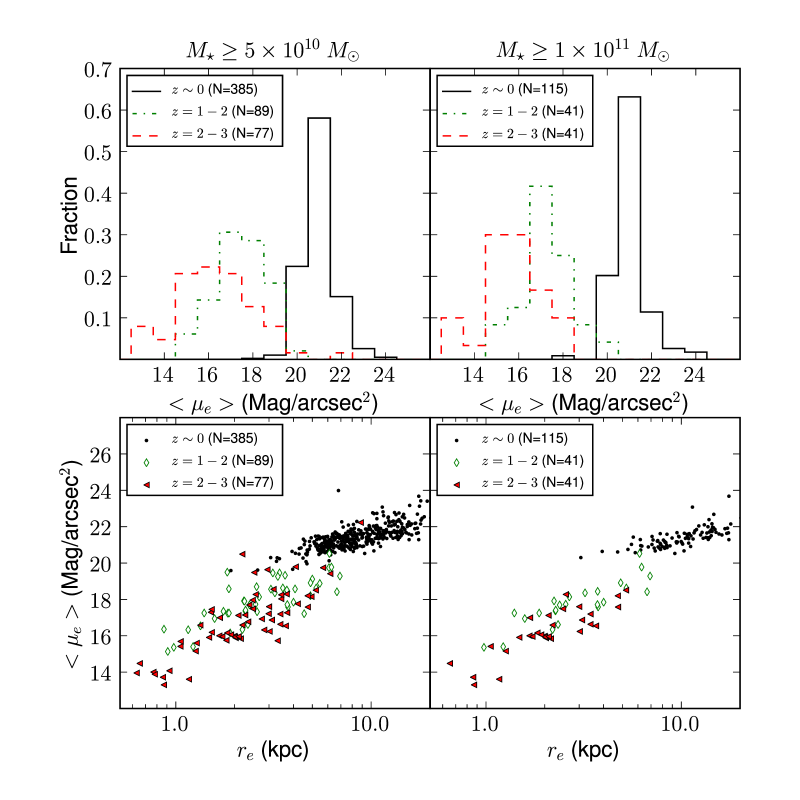
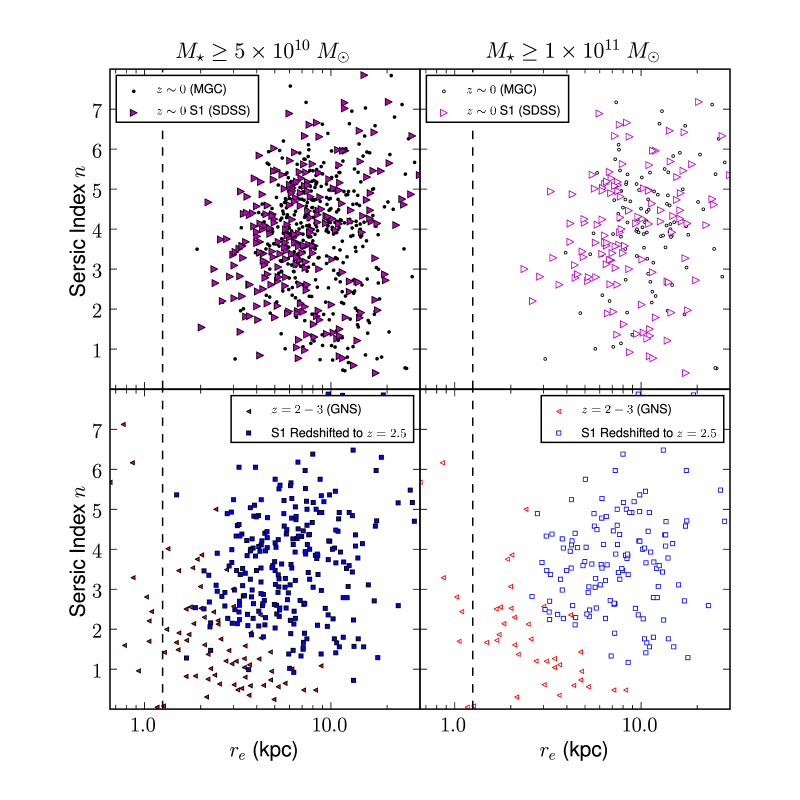
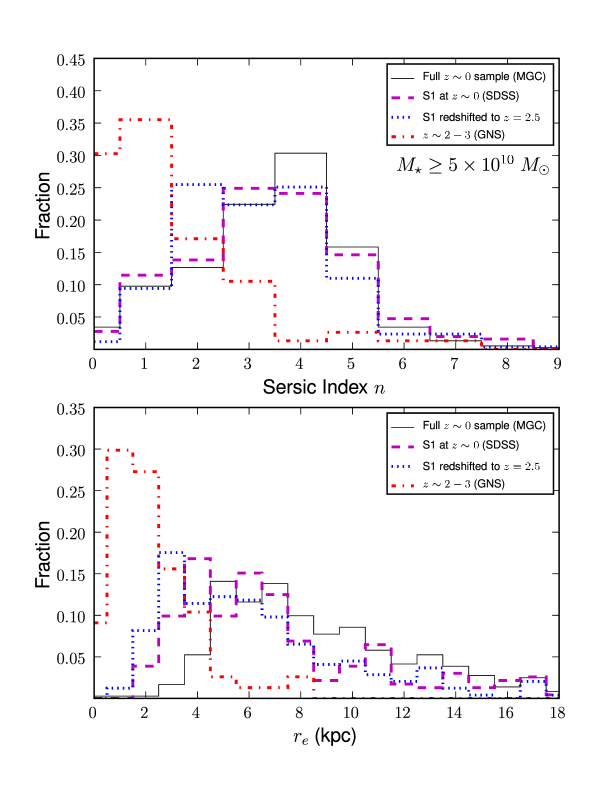
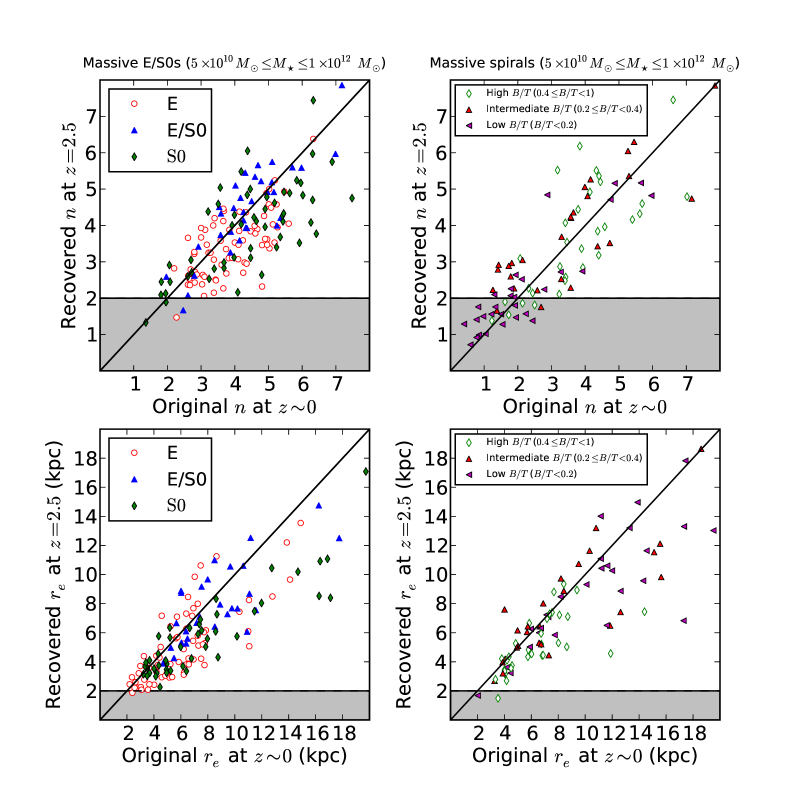
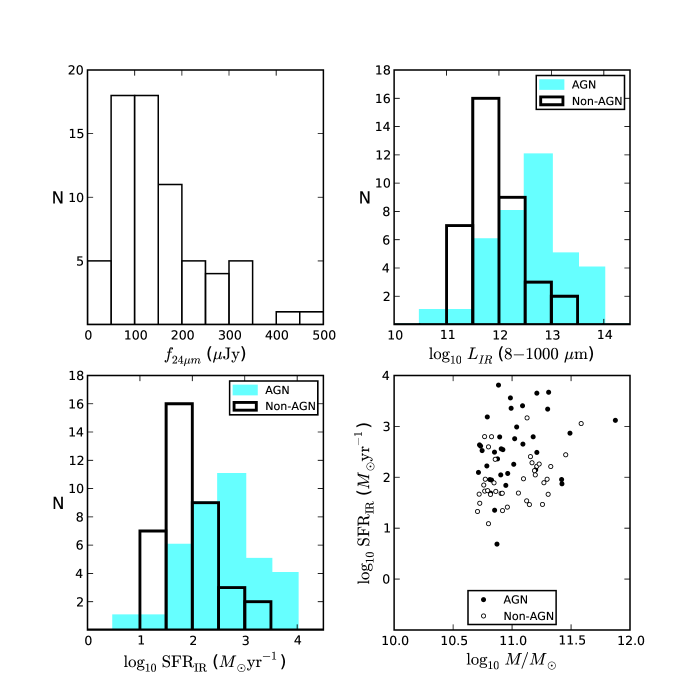
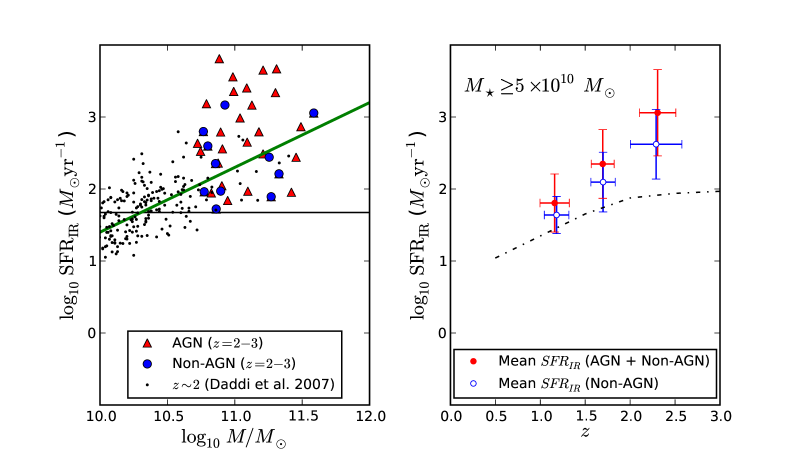
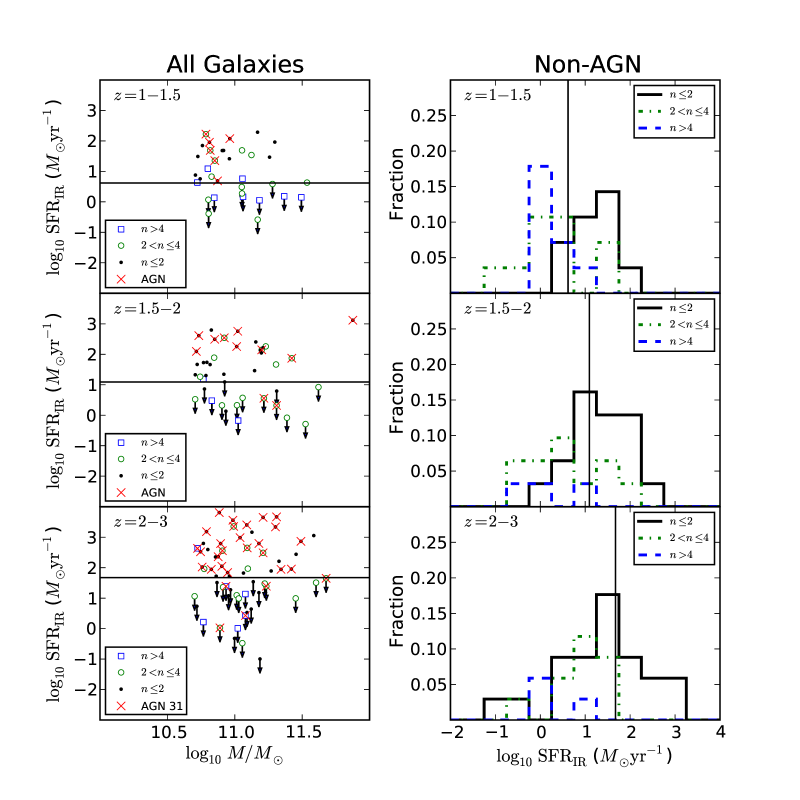
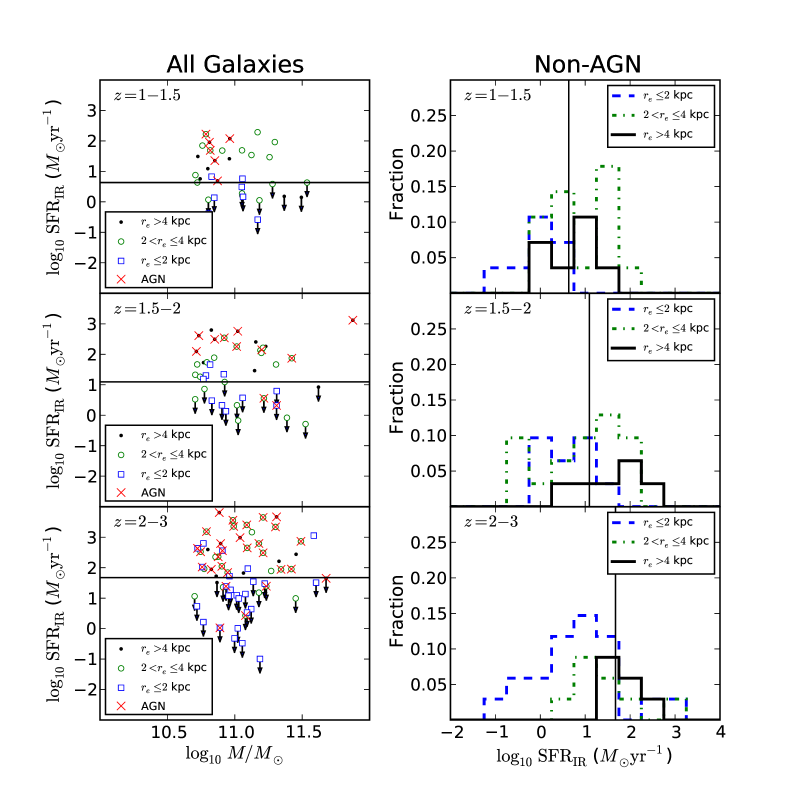
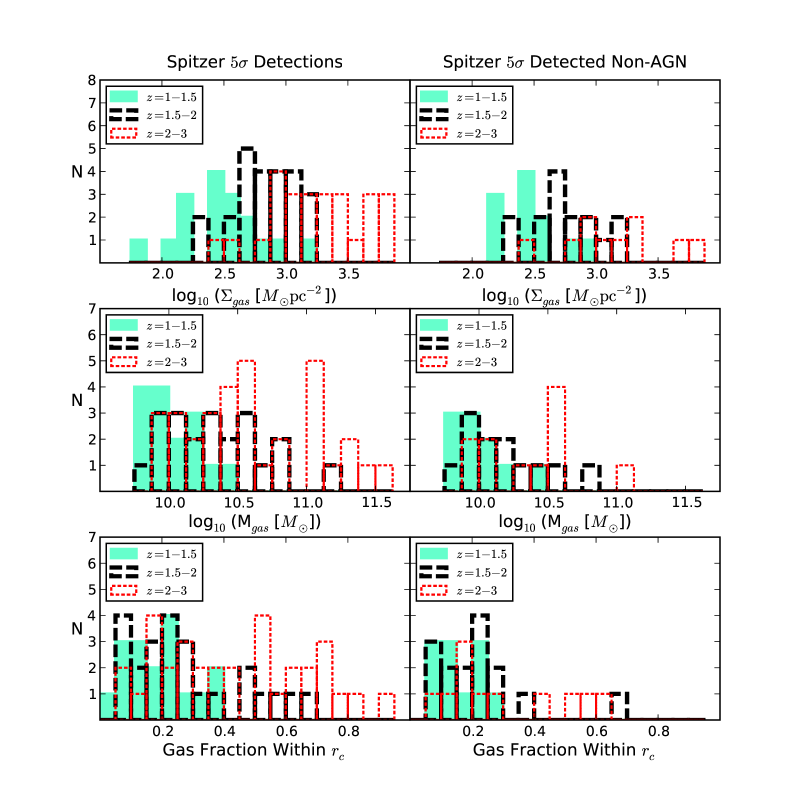
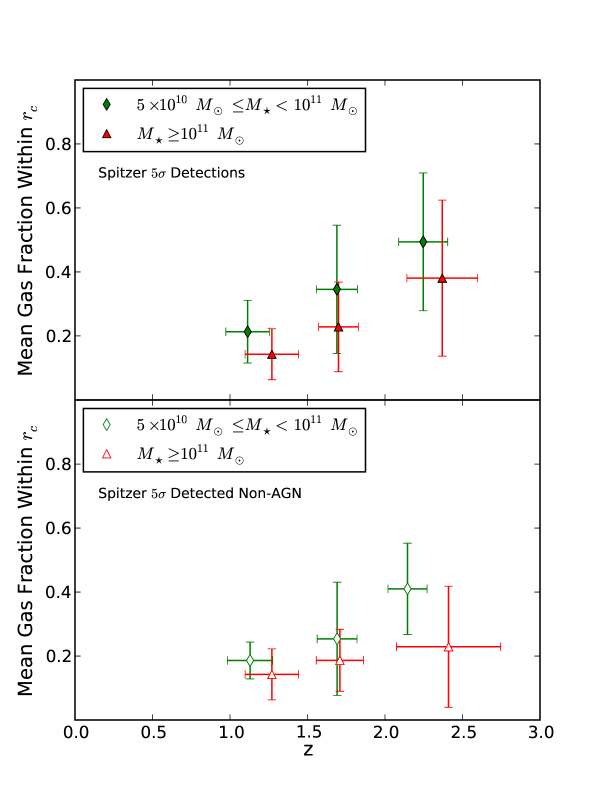
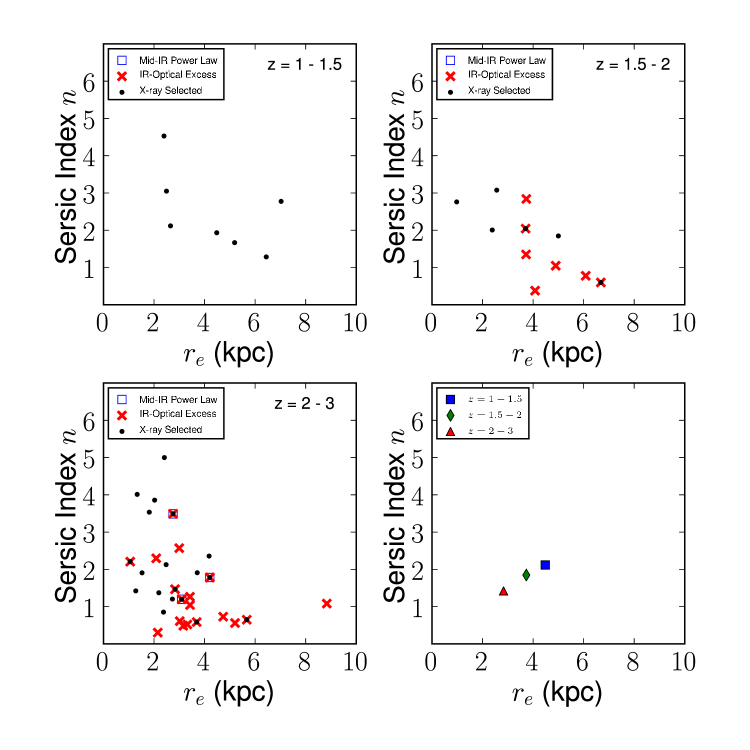
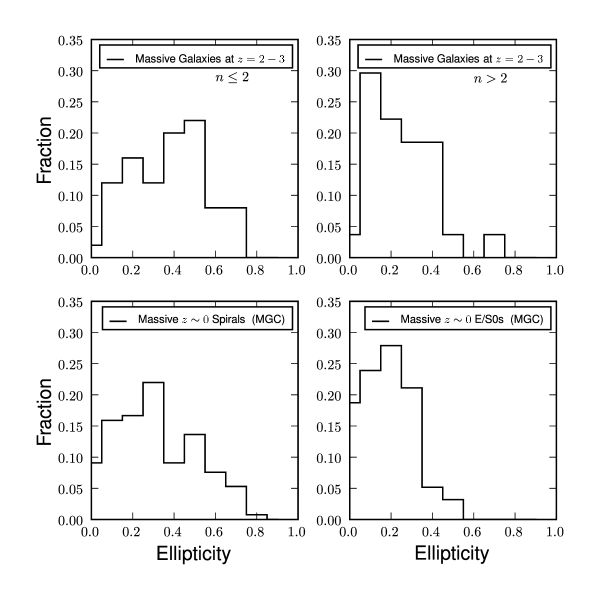
v Morphology () All 64.9 % 35.1 % 18.2 % () All 49.4 % 50.6 % 30.3 % () All 13.0 % 87.0 % 74.3 % E/S0 0.8 % 64.9 % 58.7 % Sabc 10.4 % 20.8 % 14.8 % Sd/Irr 1.82 % 1.30 % 0.78 % () All 58.5 % 41.5 % 17.1 % () All 34.1 % 65.9 % 43.9 % () All 10.4 % 89.6 % 80.9 % E/S0 1.7 % 72.2 % 67.0 % Sabc 6.09 % 13.9 % 12.2 % Sd/Irr 2.61 % 3.48 % 1.74 % Morphology kpc kpc kpc () All 39.0 % 42.9 % 18.2 % () All 24.7 % 48.3 % 27.0 % () All 0.52 % 1.8 % 97.7 % E/S0 0.26 % 1.8 % 63.6 % Sabc 0.00 % 0.0 % 31.2 % Sd/Irr 0.26 % 0.00 % 2.86 % () All 39.0 % 41.5 % 19.5 % () All 22.0 % 56.1 % 22.0 % () All 0.87 % 1.74 % 97.39 % E/S0 0.00 % 1.7 % 72.2 % Sabc 0.00 % 0.00 % 20.0 % Sd/Irr 0.87 % 0.00 % 5.22 %
Note. — Rows 1-12: For a given redshift (Column 1), morphology (Column 2), and stellar mass range, Columns 3, 4, and 5 list the fraction of galaxies in three separate bins of Sérsic index . Rows 13-24: Same as the above except that Columns 3, 4, and 5 reflect bins of half-light radius .
| Sample | ||
|---|---|---|
| (1) | (2) | (3) |
| All | 1.15(0.30) | -1.30(0.24) |
| 1.11(0.32) | -1.30(0.29) | |
| 1.20(0.31) | -1.52(0.26) | |
| Non-AGN hosts with high SFRIR1 | 1.15(0.33) | -1.22(0.30) |
| Non-AGN hosts with low SFRIR2 | 1.67(0.33) | -1.67(0.28) |
Note. — 1 Non-AGN hosts with 24 m flux above the 5 limit (30 Jy). 2 Non-AGN hosts with 24 m flux below the 5 limit (30 Jy).
| SFRmin | Fraction with Jy | Mean SFR (AGN non-AGN) | Mean SFR (Non-AGN) | |
|---|---|---|---|---|
| ( yr-1) | (%) | ( yr-1) | ( yr-1) | |
| (1) | (2) | (3) | (4) | (5) |
| 4.29 | 43.6 % | 63.8 12.9 | 44.0 | |
| 12.4 | 48.0 % | 222.8 58.5 | 128.9 | |
| 47.2 | 42.9 % | 1145.6 274.5 | 418.8 |
Note. — Column 2 estimates the detection limit on SFR given the limit on of 30 Jy. The expected SFRIR at 30 Jy is determined by linear regression of the distribution of versus SFRIR in each redshift bin. Column 3 lists the percentage of massive GNS galaxies with Jy. Column 4 shows the mean SFR among all galaxies having Jy. Column 5 shows the mean SFR among all galaxies without any evidence for AGN activity (see §6.1). The error bars in Column 4 and Column 5 represent the standard error on the mean.
| Total Number | X-ray AGN | PLG | IR Excess AGN | AGN Fraction | Median | Median | |
|---|---|---|---|---|---|---|---|
| (kpc) | |||||||
| (1) | (2) | (3) | (4) | (5) | (6) | (7) | (8) |
| 7 | 7 | 0 | 0 | 17.9 % | 2.12 | 4.48 | |
| 11 | 6 | 0 | 5 | 22.0 % | 1.85 | 3.73 | |
| 31 | 20 | 3 | 11 | 40.3 % | 1.42 | 2.83 |
| Sample 1 | Sample 2 | Probability | KS Test D |
|---|---|---|---|
| (%) | |||
| (1) | (2) | (3) | (4) |
| MGC E/S0 | 0 | 0.489 | |
| MGC Spiral (Sabc + Sd/Irr) | 4.78 | 0.221 | |
| MGC Sd/Irr | 23.5 | 0.317 | |
| MGC E/S0 | 34.3 | 0.184 | |
| MGC Spiral (Sabc + Sd/Irr) | 14.0 | 0.237 | |
| MGC Sd/Irr | 15.8 | 0.370 |
Note. — Columns 1 and 2 list the two samples for which ellipticity was compared in each KS test. Column 3 lists the probability that Sample 1 and Sample 2 are drawn from the same distribution. Column 4 lists the Kolmogorov-Smirnov statistic specifying the maximum separation between the cumulative ellipticity distribution functions for Sample 1 and Sample 2.
Appendices
Appendix A PSF Modeling
Knowledge of the PSF is important to assess data quality and for deriving structural parameters. NIC3 is out of focus, so the PSF can deviate from the theoretically expected one. PSF convolution with GALFIT is commonly performed with a user-provided bright, unsaturated star. Not all of the GNS tiles contain suitably bright, unsaturated stars. It is not advisable to adopt a set of PSF stars from a subset of pointings because the NIC3 PSF depends on position within the NIC3 field and is also subject to interpolation artifacts introduced by drizzle that are dependent on the adopted dither pattern (J. Krist, private communication).
As a result, the best available option for handling PSF convolution is to make synthetic NIC3 PSFs with Tiny Tim (Krist 1995). For each galaxy, Tiny Tim PSFs were generated for all the galaxy’s positions in the individual, undrizzled exposures. Telescope breathing was accounted for with each PSF by refining the Tiny Tim parameters to match the Pupil Alignment Mechanism (PAM) value recorded in the headers of the undrizzled frames. Blank, zero-valued frames retaining the WCS information of the undrizzled frames were made. The synthetic PSFs were inserted into the blank frames precisely where each galaxy would be in the individual frames. The blank frames were drizzled together in the same way as the data with a pixfrac of 0.7 and a final output platescale of /pixel. This process was repeated for all 166 massive () galaxies in our sample.
This approach accounts both for variation in PSF with position on the NIC3 field and for the dependence on the drizzle algorithm. The range of FWHM in the final drizzled synthetic PSFs is ,888The range in PSF FWHM comes from differing positions in the NIC3 field and the PAM values used to create the synthetic PSFs. with a mean value of . The mean PSF diameter of the science images () is 2.5 kpc at , under the adopted cosmology.
Appendix B Extra Tests on Systematic Effects
B.1 Tests on Robustness of Fits and Parameter Coupling
How robust are the results that a dominant fraction of the massive galaxies at have a low and that a large fraction are ultra-compact? In particular, how non-degenerate are the fits? Could some of the galaxies with an have similarly good fits with higher ?
First, one should note that the errors quoted by GALFIT on the structural parameters cannot be used to assess the robustness of the fits because the errors quoted by GALFIT underestimate the true parameter errors (Häussler et al. 2007), which are dominated by the systematics of galaxy structure, and in particular, by parameter coupling and degeneracy.
The task of assessing the coupling between model parameters is complicated when models have a large number of free parameters. The single Sérsic profiles fit to the NICMOS galaxy images have 7 free parameters (centroid, luminosity, , , axis ratio, and position angle). While GALFIT selects a best-fit by minimizing for a given set of input guesses, it is not clear whether the minimized is an absolute minimum or local minimum. Investigating the values for all combinations of fit parameters over the full multi-dimensional parameter space is prohibitively time consuming and computationally expensive. Instead, we will adopt a simpler approach of focusing on strong coupling between and , and exploring how varies as these parameters are moved away from the initial solution picked by GALFIT.
One important point should be noted when using changes in , or , for fits to different models. When errors are normally distributed, the multi-dimensional ellipsoids for a given contour can be associated with a statistical confidence level (e.g., corresponds to a 68% confidence level). However, since the errors in the GALFIT models are not normally distributed, but are instead dominated by the systematics of galaxy structure, this means that we cannot a priori assign a confidence level to a given . As outlined in the test below, we can still use the shape of as a function of or as a guide to the quality of fit in the sense that sharp rises in as is varied away from the best-fit value are taken as indicative of poorer fits. But, we cannot a priori say how much poorer the fits are in a statistical sense. This is a well-known and hard problem in structural fitting. We will return to this point in section B.2.
We carry out the test below for all galaxies in our sample We denote as , the value of obtained when GALFIT fits the galaxy with and as free parameters. The associated best-fit parameters are and . We then fit single Sérsic profiles with fixed at discrete values (0.5-10), while allowing all other parameters to freely vary. The initial inputs to these fits were the same as those used to generate the model in which is a free parameter. We let GALFIT find the best-fit for each of these fixed models by minimizing , and we record for each such best-fit the following quantities: the fixed value of , the best-fit value of , and the associated minimum in called . We then evaluate how the difference - varies as a function of and , as we move to values away from and .
The test was carried out for all galaxies. Figure B1 shows the results of the test for four representative galaxies with . The first column of Figure B1 shows how (-) changes when is varied away from at discrete values (0.5-10) and GALFIT is allowed to vary all other parameters to get a best-fit that yields . The second column shows the corresponding best-fit for that . Red stars in the plots denote and , which are associated with . The shape of - is asymmetric for and . The coupling between and means ( - ) varies in a similar way with both and .
We can see that in Figure B1, the absolute minimum values occur at the and values, which GALFIT picked when it was allowed to freely fit the galaxies without fixing . Shifting away from (denoted by the red stars) by can increase by several 10s or 100s of units. While only 4 representative galaxies are shown in Figure B1, we show results for the whole sample in Figure B2. This figure illustrates that the distribution of ( - ) for (top panel) and (bottom panel), and demonstrates for the whole sample, generally changes substantially when is shifted away from . We draw two primary conclusions from Figure B1:
-
1.
For galaxies with (rows 3 and 4), - rises sharply at lower , suggesting that lower values are unlikely to yield a good fit for such systems. At , - rises less sharply, but the rise is still substantial as demonstrated in by the high-magnification inset plots in rows 3 and 4 of column 1.
-
2.
The most important point to take from Figure B1 is that for galaxies with (as in rows 1 and 2), - rises rapidly at higher , thereby making it unlikely that a higher would provide a similarly good fit. Thus, we have a great degree of confidence that we are not highly overestimating the number of galaxies in the sample.
B.2 Recovery of Parameters From Simulated Images
Section §B.1 tests how well parameters are recovered in real galaxies, but we cannot a priori assign a confidence level to a given because the errors in the GALFIT models are not normally distributed. However, we can run an extra complementary test where we use simulated idealized galaxies whose (, ) are a priori known. The drawback of using idealized galaxies as opposed to the real galaxies fitted in §3.1 is that the former lack the complexity of real galaxies, since they are simply generated from GALFIT models and exactly described by a functional form, such as a Sersic model with a specified (, ). However, the advantage is that we do know the (, ) values a priori and can therefore compare these values to those obtained once these idealized galaxies are inserted into frames with noise properties corresponding to the NIC3 GNS images of our sample galaxies at .
This test is performed by simulating 1000 galaxy images, each with a unique set of Sérsic parameters: surface brightness at the effective radius , effective radius , Sérsic index , axis ratio b/a, and position angle PA. The parameters are chosen randomly from uniform distributions spanning the parameter space of the observed galaxies. The ranges in , , , b/a, and PA are 16 to 32 mag/arcsec2, to , 0.5 to 10, 0.3 to 1.0, and -90 to 90 degrees, respectively. The chosen range in input mimics the effect of surface brightness dimming, and the range in ensures the simulated objects span the angular size of the real GNS galaxies. The simulated galaxies were created with GALFIT and convolved with a drizzled PSF image. They were set within a sky background equivalent to the mean NIC3 sky background within GNS (0.1 counts/sec). Source noise, sky noise, and read noise (29 ) were added to the frames.
The simulated images were then re-fit with GALFIT to derive (, ). Initial guess parameters for (, , , b/a, PA) were generated randomly from uniform distributions spanning mag/arcsec2 in , in , indices in , 0.3 to 1 in b/a, and -90 to 90 degrees in PA. Figure B3 shows the recovery in (, ) plotted against surface brightness. The dashed vertical lines represent the minimum, median, and maximum for the observed massive galaxies. Figure B3 shows (, ) are well recovered across the full range in observed . The recovery as a function of severely degrades only at several mag/arcsec2 fainter than observed . In of cases, and are recovered to within 10% of their input values for the range of observed among the massive galaxies in our sample.
B.3 Tests on MGC Fits
The structural parameters for the massive galaxies at 0, are derived by Allen et al. (2006) by using the GIM2D code (Simard et al. 2002) to fit single Sérsic component to the MGC -band images. We derived the structural parameters for the massive galaxies at , by using the GALFIT code (Peng et al. 2002) on the NIC3/F610W images (3.1). One might wonder whether the dramatic shift in Figure 5 of the galaxies toward lower (, ) compared to the the 0 MGC galaxies may be caused by systematic differences between the fitting techniques used by us versus those by Allen et al. (2006). This would be the case only if the fits by Allen et al. (2006) give systematically higher (, ) than ours for the same galaxies. As we show below this is not the case.
In order to address this issue, we have applied GALFIT to a subset of -band MGC images and compared our resulting structural parameters to the GIM2D-based results given in the MGC catalogue. The comparison (top row of Figure B4) shows that the GIM2D-based fits of Allen et al. (2006) are not biased to higher (, ) compared to our GALFIT-based fits for the 0 MGC galaxies. In fact, for large , the GIM2D-based values may even be lower. in many cases.
These results are consistent with extensive comparisons of single component Sérsic fits from GALFIT and GIM2D conducted by Häussler et al.(2007) on both simulated and real galaxy data. They concluded that both codes provide reliable fits with little systematic error for galaxies with effective surface brightnesses brighter than that of the sky, as long as one is not dealing with highly crowded fields.
Another possible source of difference between the structural parameters of the 0 and massive galaxies might be the fact that Allen et al. (2006) fitted the 0 massive galaxies with only a single Sérsic component, and did not include an extra point source component in galaxies with evident nuclear sources. It seems unlikely that the much larger fraction of higher (, ) systems at 0 in Figure 5 is mainly driven by this effect. To illustrate this, we have fitted the 0 MGC galaxies in the top row of Figure B4 with a combination of a single Sérsic component and a point source model using GALFIT. The bottom row of Figure B4 shows the results. The values of are not changed systematically. The Sérsic index is lowered by the addition of the point source, but only 20% of the sources with in the single Sérsic fit have after including the point source. Since not all 0 MGC galaxies in Figure 5 will have nuclear sources, the fraction of sources impacted will be even less. We thus conclude that the presence of a point source in some of the 0 MGC galaxies and the inclusion of such a point source in the model fits, are not sufficient to shift the 0 MGC galaxies into the parameter space occupied by the massive galaxies in Figure 5.