Present address: ]ISIR-SANKEN, Osaka Univ., Japan.
Magnetically-Driven Ferroelectric Atomic Displacements in perovskite like YMnO3
Abstract
Magnetically-driven ferroelectric atomic displacements of the order of 10 have been observed in orthorhombic (perovskite like) YMnO3 by a single-crystal synchrotron x-ray diffraction. The refined polar structure shows the characteristic bond alternation driven by the exchange striction in staggered Mn-O-Mn arrays with type ordering, giving rise to a spontaneous polarization along -axis. First-principles calculations based on the Berry phase method as well as on the experimentally refined crystal structure can reproduce the observed polarization value.
pacs:
75.80.+q, 77.80.-e, 61.05.cpI Introduction
A strong coupling among spin, charge, and lattice degrees of freedom is a key requirement for future spintronic devices. Magnetoelectric multiferroics is one such example satisfying this demand S-W. Cheong, and M. Mostovoy, Nature Materials 6, 13 (2007); Y. Tokura, and S. Seki, Adv. Mater. 22, 1554 (2010), as typified by the magnetic-order-induced polarization in orthorhombic (perovskite like) MnO3 (: Tb and Dy) and Ni3V2O8 with a cycloidal spin order Kimura2003 ; Kenzelmann2005 ; Lawes2005 . The relation between cycloidal spin structure and electric polarization has been extensively discussed in terms of spin current Katsura2005 or by the inverse Dzyaloshinskii-Moriya model Mostovoy2006 ; Sergienko2006a ; Jia2006 , both of which consider the spin-orbit coupling as the relevant interaction. Subsequently, first-principles calculations using the density functional theory (DFT) were performed to explain the actual value of the spontaneous polarization in a quantitative mannerXiang2008 ; Malashevich2008 .
In displacement-type ferroelectrics, where the electric polarization had been attributed to the displacements of the constituent ions in early days, an essential contribution of the quantum Berry phase of valence electrons was revealed by accurate structural analysis and first-principles calculation Cohen1992 ; Zhong1994 ; Kuroiwa2001 . Therefore, also in the multiferroic system, the collaboration between the theoretical calculation and the crystal structural analysis will give critical information to the microscopic origin of the ferroelectric polarization. Nevertheless, little has been clarified for the crystal structures of the ordered phases in multiferroics, primarily due to the extremely small lattice displacements driven by the magnetic order as reflected in the small polarizations, typically 1 C/cm2. For a typical multiferroic TbMnO3, the intensities of the x-ray superlattice reflections with a wavenumber 2 (: wavenumber of spin modulation), which appear depending on the type of spin helix Arima2007 , are four orders of magnitude smaller than that of the strong fundamental reflections. These are contrastive to the cases of conventional displacement-type ferroelectrics BaTiO3 and PbTiO3 with large polarization (several tens of C/cm2).
Among the origins of spin-driven ferroelectricity, lattice striction induced by the symmetric spin exchange has also been of great interest because of the potentially large polarization Sergienko2006b ; S-W. Cheong, and M. Mostovoy, Nature Materials 6, 13 (2007), which can be ascribed to the larger energy scale of the exchange interaction irrelevant to Dzyaloshinskii-Moriya interaction (spin-orbit coupling). Typical examples of exchange-striction-driven ferroelectrics are orthorhombic (perovskite like) MnO3 (= Y and Ho-Lu) showing the -type (-type) spin order Munoz2002 , Ca3(Co,Mn)2O6 Choi2008 , and GdFeO3 Tokunaga2009 . As for the orthorhombic MnO3, the existence of the enhanced polarization of about 6 C/cm2 has been proposed in the -type phase by the first-principles calculations based on the Berry phase method and theoretically optimized crystal structure Picozzi2007 ; Yamauchi2008 . Recently, the polarization in the -type phase has been confirmed for polycrystalline samples to be much larger than those of the helimagnetic phase, but the value appears one order of magnitude smaller than the calculated value Lorenz2007 ; Ishiwata2010 . Such discrepancy should be solved by knowing the accurate crystal structure of the multiferroic state as well as by comparing the experimental values with the result of the first-principles band-theoretical calculation. In this context, the orthorhombic MnO3 with the -type order is an ideal system to study the microscopic origin of the magnetically-driven ferroelectricity from the structural viewpoint; the advantages are that (i) the lattice displacements are expected to be relatively large because the polarization is particularly large among the magnetically-driven multiferroics, (ii) extensive reports regarding to the multiferroic properties have been accumulated for the series of the orthorhombic MnO3. In this paper, we report the observation of the atomic displacements in the ferroelectric phase of orthorhombic YMnO3 by means of synchrotron x-ray diffraction for the single crystalline sample. The atomic displacements with alternating Mn-O-Mn bond angles were found to produce polarization along the -axis (in the Pbnm setting) in the -type phase. By a first-principles calculation, we can quantitatively reproduce the experimentally observed polarization value for appropriate values of on-site Coulomb interaction .
II Experimental and computational procedures
Single crystals of orthorhombic YMnO3 were synthesized by a high-pressure treatment (1573 K and 5.5 GPa) on the precursor sample of hexagonal YMnO3 with using a cubic-anvil-type high-pressure apparatus. Details of the crystal growth of orthorhombic YMnO3 under high pressure will be reported elsewhere Ishiwata2011 . Although the as-prepared crystals with a dimension up to 500 m were twinned with alternating the - and -axes, the typical single-domain size was as large as 100 200 m. While measurements of the polarization and the dielectric permittivity were carried out on a twinned crystal, the magnetic susceptibility, infrared reflectivity and synchrotron x-ray diffraction were measured for twin-free small crystals.
For measurements of the dielectric permittivity and the electric polarization, gold electrodes were deposited on both faces of the rectangular crystal with dimensions of 200 240 200 m3. As a poling procedure, an electric field of up to 12 kVcm was applied at 40 K, followed by cooling to 2 K, and then the electric field was turned off. Displacement current was measured with increasing temperature at a rate of 5 Kmin, and was integrated as a function of time to obtain the polarization. For the measurement, electric field was perpendicular to the -axis and slanted at an angle of approximately 33.5∘ from the - (-) axis for the major (minor) twin domain; this was confirmed by a polarizing microscope. (The actual twin domain boundaries are observed along [1 1 0] or [1 -1 0] directions.) The reduction of the polarization value due to this misorientation is corrected by multiplying the observed raw data by 1.2 (). Magnetic susceptibility was measured in a heating run at a magnetic field of 1 kOe with using a SQUID (Superconducting Quantum Interference Device) magnetometer. A Fourier-transform spectrometer (Bruker IF66v/S) combined with a microscope (Hyperion) and a HgCdTe detector was used for infrared spectroscopy.
Synchrotron x-ray diffraction experiments were performed on BL02B1 at SPring-8, Japan. The photon energy of the incident x-rays was tuned at 34.91 keV. X-ray beams were shaped into a square of 300300 m2 by a collimator, which was large enough to irradiate the whole sample. A single crystal was crushed into cubes with a typical dimension of about 50 m. The absorption coefficient for 34.91 keV is calculated to be 47.4 cm-1. Therefore, was about 0.25, which certified that the absorption effect was small enough for the empirical absorption correction Higashi1995 . A large cylindrical imaging plate was utilized to measure diffracted intensities. The temperature was controlled by a helium gas stream cryostat. Rapid-Auto program (Rigaku Corp. and MSC.) was used to obtain an F-table. Diffraction data were collected up to the resolution of 0.2 Å. SIR2004 Sir2004 and CRYSTALSTRUCTURE (Rigaku Corp. and MSC.) programs were used for analyzing the crystal structure from the F-table.
As for first-principles calculations, we performed DFT simulations using the VASP code Kresse1996 within the GGA+ Anisimov1997 formalism with various values. In addition, we used the Heyd-Scuseria-Ernzerhof (HSE) screened hybrid functional method, HSE which mixes the exact non-local Fock exchange and the density-functional parametrized exchange. The HSE is known to improve the evaluation of the Jahn-Teller distortion, with respect to GGA+ approaches HSEslv . The cut-off energy for the plane-wave expansion of the wavefunctions was set to 400 eV and a -point shell of (2, 3, 4) was used for the Brillouin zone integration according to Monkhorst-Pack special point mesh. Spin-orbit interaction is not taken into account.
III Results and discussion
III.1 Magnetic and dielectric properties
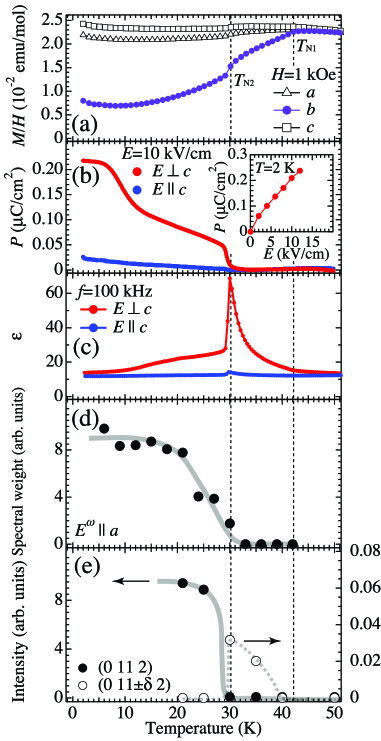
The temperature dependence of various physical properties of YMnO3 measured on the single crystal is shown in Fig. 1. Two kink-like anomalies are clearly observed at =42 K and =30 K, respectively, in magnetization along the -axis, while they are barely discerned along the - and -axes (Fig. 1(a)), corresponding to the magnetic phase transitions from the paramagnetic to the sinusoidal and then to the -type structures with spins pointing almost along the -axis Munoz2002 ; Lorenz2007 ; comment1 . In the -type phase, the ferroelectric polarization perpendicular to the -axis appears, as accompanied with a discontinuous jump of the dielectric permittivity at , as shown in Figs. 1(b) and (c). In contrast, the anomaly of along the -axis is hardly discernible and the polarization along the -axis is very small. These results indicate that ferroelectric polarization lies within the -plane in the -type phase. While the polarization value at 2 K is not saturated at a poling field of 12 kV/cm as shown in the inset, the sample showed a breakdown for higher poling fields. Nevertheless, the genuine value of polarization at 2 K is expected to be at least 0.24 C/cm2.
III.2 Infrared reflectivity
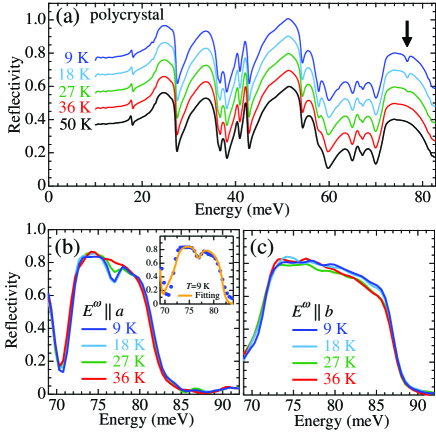
Figure 2(a) shows far-infrared reflectivity spectra of a polycrystalline sample. A lot of phonon modes are observed due to the orthorhombic distortion of the lattice from the cubic perovskite structure, where three infrared-active phonon modes, i. e. stretching, bending and external modes, are identified. A clear anomaly is observed around 77 meV below as indicated by an arrow. According to Ref. Kim2006, , a Raman-active mode at 77 meV gains the infrared activity due to the lowering of the symmetry in the ferroelectric phase. By using an as-grown single-crystal surface with a dimension of 50100 m2, the polarization of each phonon mode was clearly decomposed, as shown in Figs. 2(b) and (c). The anomaly at 77 meV is observed only for below indicating that the new optical phonon (oxygen stretching) mode is related to the loss of glide-plane normal to the -axis. Therefore, the spectral weight of the mode can be a measure of the magnitude of the ferroelectric lattice displacement. To deduce the temperature dependence of the spectral weight, we fitted the reflectivity spectra above 65 meV for the configuration by three Lorentz oscillators described as (see the inset of Fig. 2(b)). Here, , , and are spectral weight, eigenfrequency, and inverse of lifetime of the oscillator, respectively. Because of the ambiguity of the absolute value of the reflectivity in this measurement, the scale factor for absolute reflectivity is another fitting parameter. The parameters (, , and ) of two phonon modes were fixed to the value obtained by the fitting above . The parameters of the Raman-active phonon mode were obtained for each temperature below . The intensity of this mode increases with decreasing temperature below and does not vary much below around 20 K, as shown in Fig. 1(d), indicating the saturation of the lattice displacement.
III.3 Synchrotron x-ray diffraction and crystal structure analysis
| site | ||||
|---|---|---|---|---|
| Y1 | 2 | 0.61103(7) | 0.83569(3) | 1/2 |
| Y2 | 2 | 0.64624(7) | 0.66579(3) | 0 |
| Mn | 4 | 0.12942(10) | 0.74832(4) | 0.24935(5) |
| O1 | 4 | 0.4273(3) | 0.57846(18) | 0.3044(2) |
| O2 | 2 | 0.0168(3) | 0.7118(2) | 1/2 |
| O3 | 2 | 0.2409(4) | 0.7868(2) | 0 |
| O4 | 4 | 0.8291(3) | 0.92158(18) | 0.1971(2) |
| (Å2) | (Å2) | (Å2) | (Å2) | (Å2) | (Å2) | |
|---|---|---|---|---|---|---|
| Y1 | 0.00094(3) | 0.00169(2) | 0.00156(4) | -0.00020(3) | 0 | 0 |
| Y2 | 0.00201(4) | 0.00169(3) | 0.00142(4) | 0.00007(3) | 0 | 0 |
| Mn | 0.001510(10) | 0.002200(10) | 0.001450(10) | 0.000270(10) | 0.000040(10) | 0.000170(10) |
| O1 | 0.0031(3) | 0.0033(2) | 0.0039(3) | 0.0009(2) | -0.0002(2) | -0.00016(16) |
| O2 | 0.0024(4) | 0.0045(3) | 0.0024(3) | 0.0001(3) | 0 | 0 |
| O3 | 0.0039(4) | 0.0033(2) | 0.0024(3) | 0.0008(3) | 0 | 0 |
| O4 | 0.0028(2) | 0.0038(2) | 0.0030(2) | 0.0000(2) | -0.0004(2) | -0.00037(15) |
| site | ||||
|---|---|---|---|---|
| Y | 4 | 0.017610(10) | 0.084830(10) | 1/4 |
| Mn | 4 | 1/2 | 0 | 0 |
| O1 | 4 | 0.61224(8) | 0.96229(7) | 1/4 |
| O2 | 8 | 0.29892(5) | 0.32844(5) | 0.05366(3) |
| (Å2) | (Å2) | (Å2) | (Å2) | (Å2) | (Å2) | |
|---|---|---|---|---|---|---|
| Y | 0.001800(10) | 0.001680(10) | 0.001700(10) | 0.000090(10) | 0 | 0 |
| Mn | 0.001800(10) | 0.002210(10) | 0.001660(10) | -0.000250(10) | -0.000020(10) | 0.000230(10) |
| O1 | 0.00349(7) | 0.00389(7) | 0.00259(5) | -0.00060(6) | 0 | 0 |
| O2 | 0.00325(5) | 0.00361(5) | 0.00357(4) | 0.00049(4) | -0.00031(3) | -0.00029(3) |
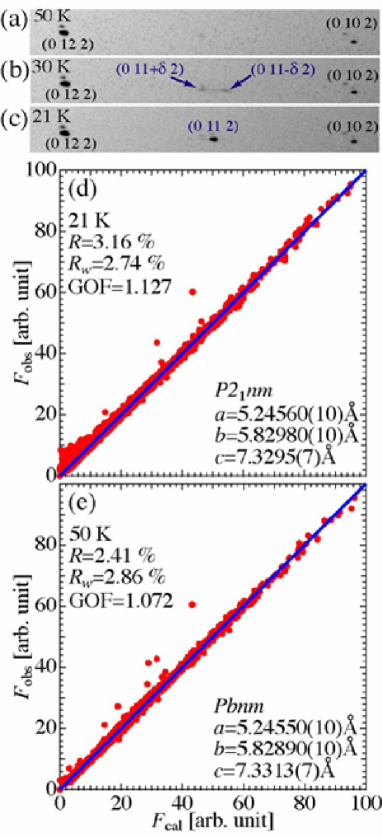
Synchrotron x-ray oscillation photographs for the respective phases are displayed in Figs. 3(a), (b), and (c). At 50 K above , only fundamental Bragg reflections for Pbnm symmetry are observed (Fig. 3(a)). In the sinusoidal phase, two incommensurate reflections of (0 11 2) appear, as indicated by arrows in Fig. 3(b) (=0.08 at 30 K). The intensity and -value increases and decreases with decreasing temperature, respectively. As shown in Fig. 3(c), at 21 K in the -type phase, the two incommensurate reflections merge into a reflection (0 11 2), which is forbidden in the original Pbnm symmetry comment1 . As shown in Fig. 1(e), the integrated intensity of the additional peaks shows a second-order phase-transition like temperature dependence in the sinusoidal phase with the incommensurate modulation, while exhibiting a first-order-like sudden variation in intensity and value (=0.08 to =0) upon the transition from the sinusoidal to the -type phase.
By using the data sets of synchrotron x-ray diffraction, we performed crystal structure analyses in the -type (i.e. ferroelectric) and the paramagnetic (i.e. paraelectric) phases, respectively. The comparisons between observed and calculated structure factors are shown in Figs. 3(d) and (e). At 21 K in the ferroelectric phase, 37305 reflections were observed, and 10500 of them were independent. 54 parameters were used for the refinement. The lattice parameters , , and are 5.24560(10) Å, 5.82980(10) Å, and 7.3295(7) Å, respectively. Because the forbidden reflections of (0 ): = with Pbnm setting are observed, the plausible space group is P21nm (No. 31), a maximal non-isomorphic subgroup of Pbnm. The disappearance of -glide reflection allows a uniform atomic displacement along the -axis. In the structure analysis, the flack parameter Flack1988 is estimated as 0.503(18), indicating that the volume fractions of two kinds of ferroelectric domains are nearly equal. The reliability factors are = 3.16%, =2.74%, GOF(Goodness of fit)=1.127. At 50 K in the paraelectric phase, 15409 reflections were observed, and 5668 of them were independent. 29 parameters were used for the refinement. The lattice parameters are as follows: =5.24550(10) Å, =5.82890(10) Å, =7.3313(7) Å. The space group is Pbnm (No. 62). The reliability factors are = 2.41%, =2.86%, GOF=1.072. The crystal parameters at 21 K in the ferroelectric phase and at 50 K in the paraelectric phase are summarized in Tables 1 and 2, respectively.
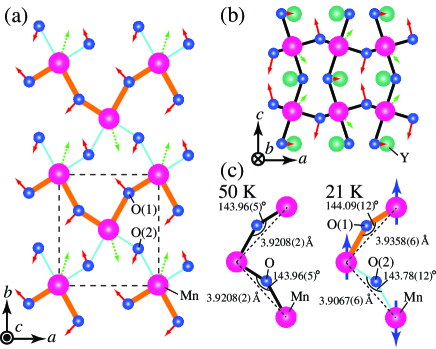
The crystal structure analyses indicated the atomic displacements of Mn and O ions within the -plane and the -plane in the ferroelectric phase as shown by arrows in Figs. 4(a) and (b), respectively. Here, the positions of Y ions are fixed. The displacements of Mn ions along the -axis are observed to be uniform, while those along the - and -axes are staggered. The shifts of O ions along the -axis are also uniform but opposite to those of Mn ions. The components of the O displacement along the - and -axes entirely cancel out, similarly to those of Mn ions. These uniform atomic displacements of Mn and O ions along the -axis and the associated variation of electron wave functions generate the ferroelectric polarization parallel to the -axis. The observed atomic displacements along the -axis are as small as 0.0041(7) Å for Mn ion and 0.0020(16) and 0.0030(16) Å for two inequivalent O sites, respectively. These values are one or two orders of magnitude smaller than those of conventional displacement-type ferroelectrics, BaTiO3 and PbTiO3 Kuroiwa2001 . From the point charge model with nominal ionic charges (Y; 3+, Mn; 3+, O; 2-) and these values of atomic displacement along the -axis, ferroelectric polarization value is calculated to be approximately 0.5 C/cm2, which is in the same order as the experimentally observed value. Changes of the Mn-O-Mn bond angles and the distance between neighboring Mn ions are detailed in Fig. 4(c). At 50 K, there is only one kind of Mn-O-Mn bond with an angle of 143.96(5)∘ in basal -plane. By contrast, at 21 K, there are two inequivalent bonds of Mn-O(1)-Mn and Mn-O(2)-Mn in -plane, whose bond angles, 144.09(12)∘ and 143.78(12)∘, are slightly larger and smaller than that of Mn-O-Mn in the paraelectric phase, respectively. In other words, an alternating bond structure emerges along the -axis in the ferroelectric phase, as shown in Fig. 4(a).
The mechanism of the polarization generation has been proposed to be a symmetric-exchange striction that provides the gain of magnetic exchange energy. So as to minimize the total nearest-neighbor exchange energy mediated by the local ferromagnetic double-exchange interaction, the bond angles for ferromagnetic (antiferromagnetic ) Mn spin arrangement become large (small), because the transfer integral of electron increases (decreases) for the larger (smaller) Mn-O-Mn angle Yamauchi2008 ; Mochizuki2010 . The result of the present x-ray structure analysis is in accord with the basic idea of the exchange-striction model.
III.4 Theoretical calculation
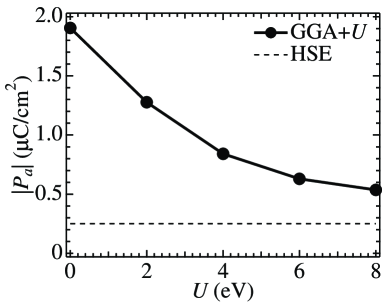
For a more detailed discussion, we performed first-principles simulations of the YMnO3 electronic structure. In this paper, since the optimization of the geometry - in terms of atomic positions - is a rather delicate issue (see comment below), we stick to the experimentally refined crystal structure, as now available from the detection of atomic displacements of 10-3 Å order. The calculated ferroelectric polarization using the Berry phase method King1993 for the experimental structure points to direction, and the absolute value is plotted versus the Hubbard parameter in Fig. 5. The value decreases from 1.8 to 0.5 C/cm2 when increasing from 0 to 8 eV. The reduction of is mainly due to the reduction of hopping, in turn linked to the reduction of the -related double-exchange interaction. The polarization value is rather strongly affected by the value, which is, unfortunately, experimentally not known for YMnO3. It is however experimentally reported that is in the range 57.5 eV in the case of a similar compound, LaMnO3 Saitoh1995 ; Park1996 , so that the value can be considered to be 0.50.8 C/cm2. In order to overcome the problems related to the arbitrary choice of the Hubbard parameter, we performed hybrid-functional (HSE) calculations and obtained an even smaller value of 0.25 C/cm2. As for the comparison with experiments, we remark that theoretical values are larger than the observed values 0.08 C/cm2 at 21 K and 0.24 C/cm2 at 2 K. One possible origin for this discrepancy is the insufficiency of the poling field in the experiment (see the inset of Fig. 1 (b)). The corrected value of the ferroelectric polarization observed for the polycrystalline sample is approximately 0.5 C/cm2 near 2 KIshiwata2010 in agreement with the theoretically predicted order of magnitude. This improvement, compared to earlier studies Picozzi2007 ; Yamauchi2008 is due to the use of experimental structure parameters; the bond angle difference is experimentally determined to be 0.3∘, while previous bare-DFT calculations were based on 3∘ of bond angle difference, obtained from the theoretical optimized crystal structure. Despite some advances in the comparison between theory and experiments, several issues remain to be solved, in particular related to the geometry optimization of the crystal structure. Density functional theory, while capturing Mn-O-Mn bond-angles and Mn-Mn bond-lengths alternating features, indicated Picozzi2007 ; Yamauchi2008 opposite direction of Mn and O displacements along the -axis as compared with the experimentally refined structure. While the magnitude of the relaxation effects depends on the value, the sign is the same for every , as well as when using hybrid-functionals approaches. These results are probably related to the overestimate of - hybridization for (more itinerant) electrons and/or to the underestimate of the interaction between (more localized) spins. It is possible that magnetostrictive effects related to states, expected to produce opposite trends for the Mn-O-Mn angles (i.e. larger angles for antiparallel Mn spins), are not properly described within all DFT, DFT+ or HSE approaches. Finally, the assumption of a fully collinear spin structure might also play a role in the theory-experiments comparison. We therefore hope that our work will stimulate further theoretical activities aimed at quantitatively reproducing the correct experimental crystal structure and magnetostrictive effects in orthorhombic manganites.
IV Summary
In summary, we have performed measurements of the magnetic susceptibility, electric polarization, electric permitivity, infrared reflectivity, and synchrotron x-ray diffraction to investigate the multiferroic nature of orthorhombic YMnO3 by using the single crystal. The results indicate that the ferroelectric phase transition with the polarization along the -axis takes place concurrently with the E-type magnetic phase transition. In the ferroelectric phase, the phonon anomaly and forbidden reflection are respectively observed in the infrared reflectivity and synchrotron x-ray diffraction, indicating the magnetically-induced lattice distortion; the space group changes to P21nm polar structure. The atomic displacements of the order of 10 are estimated from the crystal structure analysis in the ferroelectric phase, indicating the formation of the bond alternating structure of Mn-O-Mn bond in -plane. The feature is qualitatively consistent with theoretical predictions of the exchange-striction model as a microscopic mechanism for generating the electric polarization. Further, by the collaboration between the crystal structure analysis and first-principles calculations, we quantitatively explain the observed macroscopic polarization value with the input of experimental information of the microscopic atomic displacement. This work may pave a path to understanding the microscopic origins of the magnetically-driven ferroelectricity from the structural point of view with the support of the first-principles calculations, which would facilitate further structural studies of other magnetically-driven ferroelectrics with small lattice displacements.
Acknowledgements.
The authors are grateful to Y. Tokunaga for furuitful discussions. The synchrotron x-ray diffraction experiment was performed at SPring-8 with approval of the JASRI (Proposal Numbers 2009B1304 and 2010A1795). The theoretical research was supported by the European Community, FP7/ERC Grant Agreement no. 203523. This work was in part supported by Funding Program for World-Leading Innovative R&D on Science and Technology (FIRST Program) from the JSPS and Grants-in-Aid for scientific research (No. 19052001 and 20046017) from MEXT, Japan.References
- S-W. Cheong, and M. Mostovoy, Nature Materials 6, 13 (2007)
- Y. Tokura, and S. Seki, Adv. Mater. 22, 1554 (2010)
- (3) T. Kimura, T. Goto, H. Shintani, K. Ishizaka, T. Arima, and Y. Tokura, Nature (London) 426, 55 (2003).
- (4) G. Lawes, A. B. Harris, T. Kimura, N. Rogado, R. J. Cava, A. Aharony, O. Entin-Wohlman, T. Yildirim, M. Kenzelmann, C. Broholm, and A. P. Ramirez, Phys. Rev. Lett. 95, 087205 (2005).
- (5) M. Kenzelmann, A. B. Harris, S. Jonas, C. Broholm, J. Schefer, S. B. Kim, C. L. Zhang, S.-W. Cheong, O. P. Vajk, and J. W. Lynn, Phys. Rev. Lett. 95, 087206 (2005).
- (6) H. Katsura, N. Nagaosa, and A. V. Balatsky, Phys. Rev. Lett. 95, 057205 (2005).
- (7) M. Mostovoy, Phys. Rev. Lett. 96, 067601 (2006).
- (8) I. A. Sergienko, and E. Dagotto, Phys. Rev. B 73, 094434 (2006).
- (9) C. Jia, S. Onoda, N. Nagaosa, and J. H. Han, Phys. Rev. B 74, 224444 (2006).
- (10) H. J. Xiang, S.-H. Wei, M.-H. Whangbo, and J. L. F. Da Silva, Phys. Rev. Lett. 101, 037209 (2008).
- (11) A. Malashevich, and D. Vanderbilt, Phys. Rev. Lett. 101, 037210 (2008).
- (12) R. E. Cohen, Nature (London) 358, 136 (1992).
- (13) W. Zhong, R. D. King-Smith, and D. Vanderbilt, Phys. Rev. Lett. 72, 3618 (1994).
- (14) Y. Kuroiwa, S. Aoyagi, A. Sawada, J. Harada, E. Nishibori, M. Takata, and M. Sakata, Phys. Rev. Lett. 87, 217601 (2001).
- (15) T. Arima, Y. Yamasaki, T. Goto, S. Iguchi, K. Ohgushi, S. Miyasaka, and Y. Tokura, J. Phys. Soc. Jpn. 76, 023602 (2007).
- (16) I. A. Sergienko, C. Şen, and E. Dagotto, Phys. Rev. Lett. 97, 227204 (2006).
- (17) A. Muñoz, J. A. Alonso, M. T. Casais, M. J. Martínez-Lope, J. L. Martínez, and M. T. Fernández-Díaz, J. Phys.: Condens. Matter 14, 3285 (2002).
- (18) Y. J. Choi, H. T. Yi, S. Lee, Q. Huang, V. Kiryukhin, and S.-W. Cheong, Phys. Rev. Lett. 100, 047601 (2008).
- (19) Y. Tokunaga, N. Furukawa, H. Sakai, Y. Taguchi, T. Arima, and Y. Tokura, Nature Materials 8, 558 (2009).
- (20) S. Picozzi, K. Yamauchi, B. Sanyal, I. A. Sergienko, and E. Dagotto, Phys. Rev. Lett. 99, 227201 (2007).
- (21) K. Yamauchi, F. Freimuth, S. Blügel, and S. Picozzi, Phys. Rev. B 78, 014403 (2008).
- (22) B. Lorenz, Y. Q. Wang, and C. W. Chu, Phys. Rev. B 76, 104405 (2007).
- (23) S. Ishiwata, Y. Kaneko, Y. Tokunaga, Y. Taguchi, T. Arima, and Y. Tokura, Phys. Rev. B 81, 100411(R) (2010).
- (24) S. Ishiwata et al., unpublished.
- (25) T. Higashi, Abscor -Empirical Absorption Correction based on FourierSeries Approximation. Rigaku Corporation, Tokyo, Japan (1995).
- (26) M. C. Burla, R. Caliandro, M. Camalli, B. Carrozzini, G. L. Cascarano, L. De Caro, C. Giacovazzo, G. Polidori, and R. Spagna, J. Appl. Cryst. 38, 381 (2005).
- (27) G. Kresse, and J. Furthmüller, Phys. Rev. B 54, 11169 (1996).
- (28) V. I. Anisimov, F. Aryasetiawan, and A. I. Lichtenstein, J. Phys.: Cond. Mat. 9, 767 (1997).
- (29) J. Heyd, G. E. Scuseria, and M. Ernzerhof, J. Chem. Phys. 118, 8207 (2003)
- (30) A. Stroppa and S. Picozzi, Phys. Chem. Chem. Phys. 12, 5405 (2010).
- (31) Although Ref. Munoz2002, reported the incommensurate magnetic structure, our sample clearly shows a commensurate modulation, as judged from the forbidden (superlattice) peaks in the low temperature phase. The difference may originate from the slight difference in the sample preparation condition since orthorhombic YMnO3 locates in the close vicinity of the phase boundary with cycloidal phase Ishiwata2010 ; Mochizuki2010 ; Takahashi2010 .
- (32) J. Kim, S. Jung, M. S. Park, S.-I. Lee, H. D. Drew, H. Cheong, K. H. Kim, and E. J. Choi, Phys. Rev. B 74, 052406 (2006).
- (33) H. D. Flack, and D. Schwarzenbach, Acta Cryst. A44, 499 (1988).
- (34) M. Mochizuki, N. Furukawa, and N. Nagaosa, Phys. Rev. Lett. 105, 037205 (2010).
- (35) R. D. King-Smith, and D. Vanderbilt, Phys. Rev. B 47, 1651 (1993).
- (36) T. Saitoh, A. E. Bocquet, T. Mizokawa, H. Namatame, A. Fujimori, M Abbate, Y. Takeda, and M. Takano, Phys. Rev. B 51, 13942 (1995).
- (37) J.-H. Park, C. T. Chen, S-W. Cheong, W. Bao, G. Meigs, V. Chakarian and Y. U. Idzerda, Phys. Rev. Lett. 76, 4215 (1996).
- (38) Y. Takahashi, S. Ishiwata, S. Miyahara, Y. Kaneko, N. Furukawa, Y. Taguchi, R. Shimano, and Y. Tokura, Phys. Rev. B 81, 100413(R) (2010).