The effects of X-ray absorption variability in NGC 4395
Abstract
We present a new X-ray analysis of the dwarf Seyfert galaxy NGC 4395, based on two archival XMM-Newton and Suzaku observations. This source is well known for a series of remarkable properties: one of the smallest estimated black hole masses among Active Galactic Nuclei (of the order of 10), intense flux variability on very short time-scales (a few tens of seconds), an unusually flat X-ray continuum ( over the 2–10 keV energy range). NGC 4395 is also characterized by significant variations of the X-ray spectral shape, and here we show that such behaviour can be explained through the partial occultation by circumnuclear cold absorbers with column densities of 1022–1023 cm-2. In this scenario, the primary X-ray emission is best reproduced by means of a power law with a standard photon index, consistent with both the spectral slope observed at higher energies and the values typical of local AGN.
keywords:
galaxies: active – galaxies: individual: NGC 4395 – X-rays: galaxies.1 Introduction
The central regions of the dwarf spiral galaxy NGC 4395 show most of the common signatures of nuclear activity. The optical and
ultraviolet (UV) spectra reveal prominent high-ionization forbidden lines on top of a nearly featureless continuum, and broad wings
corresponding to gas velocities in excess of 103 km s-1 are detected in the permitted lines (Filippenko & Sargent
1989). Contrary to the objects of the same kind, the emission-line properties, the optical to X-ray variability pattern and the inferred
accretion rate of NGC 4395 are those typical of the Seyfert class, of which this source is usually considered to represent the least
luminous member. Different methods have been employed in the last years to derive the mass of its central black hole: the estimate
obtained through reverberation mapping is (Peterson et al. 2005), but the lack in this
galaxy of a significant bulge and the stringent upper limit of 30 km s-1 on its velocity dispersion suggest an even lower value,
of the order of 104–10 (Filippenko & Ho 2003). Anyhow, the engine of NGC 4395 falls somewhere
between the stellar-mass black holes found in Galactic X-ray binaries and the supermassive black holes residing inside active
galactic nuclei (AGN). As such, it can provide critical information about the relationship between these two populations and the
physics of accretion systems in general.
In the light of all these pieces of observational evidence, NGC 4395 is a true scaled-down version of an ordinary Seyfert galaxy,
the only difference with respect to its high-luminosity counterparts being the much smaller mass of the central black hole. On the
other hand, the X-ray observations of this source indicate an unusual spectral hardness at 2–10 keV, and suggest a wide
range of variations for the intrinsic photon index. The most extreme states (; Moran et al. 2005) are even difficult
to interpret within the standard two-phase model (Haardt & Maraschi 1991), posing serious questions on the production mechanism
of the X-ray emission itself. The presence of undetected absorption effects has been frequently invoked as a possible explanation.
Indeed, the stronger flux variability characterizing systematically the soft X-ray bands can be attributed to a complex, multi-zone
warm absorber, whose properties have been discussed in detail in several works (Iwasawa et al. 2000; Shih, Iwasawa &
Fabian 2003; Dewangan et al. 2008). Here we review the two highest-quality observations of NGC 4395, performing in both
cases an accurate time-resolved analysis mainly focused on neutral absorption, in order to test whether changes of its column
density and/or covering factor play a role in the apparent X-ray spectral hardness of this source.
2 Data reduction and analysis
The longest XMM-Newton monitoring of NGC 4395 started on 2003 November 30, for a total duration of 113 ks. After the subtraction of high-background periods, the useful exposure declines to 91.4 ks. We also take into account the deep Suzaku observation, which was carried out on 2007 June 2–5 over a span of 230 ks, corresponding to a net integration time of 101.3 ks. We have followed the standard procedures for the reduction of the event files, and extracted the source and background spectra from circular regions with radii of 30″(XMM-Newton) and 2′(Suzaku). In the first case, for the sake of clarity only EPIC-pn data are presented here and plotted in the figures, even though the MOS spectra have been checked throughout and give fully consistent results; in the second one, instead, only the data from the front-illuminated detectors of the X-ray imaging spectrometer (XIS) have been examined, after merging the XIS0 and XIS3 spectra. The spectral analysis has been performed using the xspec v12.6 fitting package. All the uncertainties are given at the 90 per cent confidence level () for the single parameter of interest.
2.1 The XMM-Newton observation
We first restricted our analysis to the energies above 1 keV, following the customary approach of fitting the spectrum averaged
over the whole observation to obtain a benchmark model. We achieved a fully acceptable fit ( for 1390
degrees of freedom, with no obvious structure in the residuals) through a simple model consisting of a power law with photon index
, a narrow iron emission line with equivalent width eV, and a partial neutral
absorber whose column density and covering fraction are cm-2 and
, respectively.111Galactic absorption has been frozen throughout at
cm-2 (Kalberla et al. 2005). No reflection component is strictly required for the continuum:
however, by adding a pexrav model (Magdziarz & Zdziarski 1995) for physical consistency and forcing its strength to
match the width of the narrow iron line,222Assuming solar iron abundance, this implies that continuum reflection and line
emission are associated with the same reprocessing component (e.g. George & Fabian 1991). the fit is slightly improved
( with the loss of one d.o.f.) and the power-law photon index steepens to . Both cases
above yield a formally satisfactory fit, yet the flat slope of the intrinsic continuum deserves a thorough investigation. This result
would actually confirm one of the most remarkable features of NGC 4395, which had been previously caught by Chandra
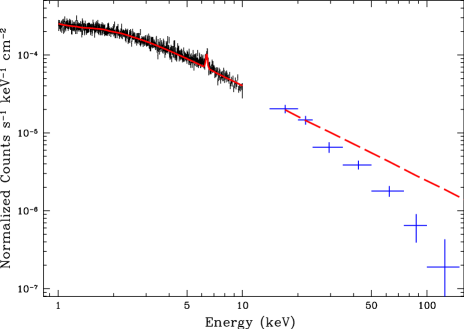
even in harder states (see Moran et al. 2005). In any case, the typical value of –1.5 is still unusually low,
compared with both the distribution of photon indices found in local AGN (e.g. Bianchi et al. 2009) and the average 15–150 keV
spectrum of the source measured by the Burst Alert Telescope (BAT) onboard Swift (; Fig. 1).
A viable explanation for such a discrepancy is the presence of a complex (variable) absorber, strongly modifying the observed
spectral shape of NGC 4395 below 10 keV. The extrapolation of the basic model down to 0.5 keV supports this working
assumption: the apparent extra emission at 0.5–0.7 keV, in fact, hints at absorption effects in the 0.7–1.5 keV range rather
than at a genuine soft excess like the one detected in a large fraction of Seyfert galaxies (e.g. Boller, Brandt & Fink 1996; Porquet
et al. 2004). Moreover, a clearly time-dependent behaviour of the X-ray source is revealed not only by the overall flux light curve but
also by the hardness ratio (HR) evolution. It is well established that NGC 4395 is characterized by strong variations of the X-ray
flux on time-scales as short as a few hundreds of seconds (Fig. 2, upper panel): the fractional rms variability amplitude during
the XMM-Newton observation under review is exceptionally high (90 per cent at 0.5–2 keV; see Vaughan et al. 2005).
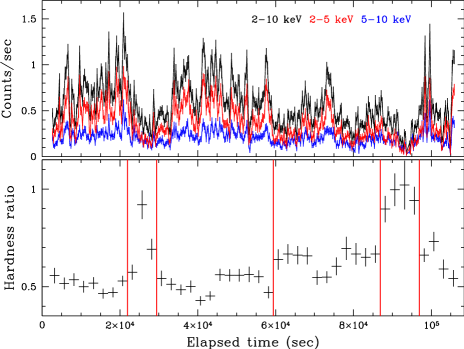
On top of these fluctuations of the intrinsic X-ray brightness, mainly related to the workings of the primary source, significant
spectral variations are also evident from the visual inspection of the HR light curve (Fig. 2, lower panel). The observed
HR pattern can be accounted for through either changes of the column density or, alternatively, oscillations of the continuum slope:
this proves that a time-averaged spectral analysis is not sufficient to fully understand the nature of the X-ray emission of NGC 4395.
The hardness ratio is defined here as the ratio between the 5–10 keV and the 2–5 keV flux, thus it is especially sensitive to values
of of the order of 1022–1023 cm-2. As already mentioned, the spectral complexity and the larger fractional
rms variability below 2 keV are likely due instead to a multi-zone warm absorber, whose presence has been revealed since the
early ASCA observations of the source (Iwasawa et al. 2000; Shih et al. 2003). We anyway note that this is not a critical point,
since the HR evolution is only used to select the appropriate intervals for the subsequent time-resolved spectral analysis, which is crucial
to validate or dismiss the suggested interpretation.
The shape of the HR light curve reveals two periods of sudden spectral hardening around 25 and 90 ks; this hints at increased
opacity, which would mainly affect the 2–5 keV band. According to Fig. 2, six different regimes of the hardness ratio can be roughly
defined. In this framework, the minor HR fluctuations on very short time-scales can be due to a flickering of the photon index in response
to variations of the physical conditions in the disc/corona system, but the statistics is not enough for a complete investigation of these
aspects. Regardless of this, our aim is to check whether a reasonable configuration of the neutral absorber allows us to recover a steeper
intrinsic photon index for the X-ray emission of NGC 4395.
In order to obtain an adequate description of the entire 0.5–10 keV spectral range, we included in the reference model above also an
apec component for the soft thermal emission (Smith et al. 2001) and a two-zone warm absorber, whose complex effects have
been already pointed out in several previous works (see also Dewangan et al. 2008). In our analysis we have assumed that the soft
emission, warm absorption and reflection features do not vary in the course of a 100 ks long observation: since the light crossing
time over a distance of a gravitational radius () is of the order of one second, the reflection component is
expected to change significantly in response to the primary continuum only if the scattering material is located well within 10
from the centre (as in the disc reflection scenarios; e.g. Nardini et al. 2011). Similarly, the soft emission likely arises from a very extended region,
while the warm absorber, in principle, could lie much closer to the X-ray source (but see Blustin et al. 2005): if this is the case, we are just
sampling its average properties.333The warm absorbers have been modelled with absori, adopting the nominal xspec
values (with solar abundances) and a full covering. We are not interested in a more detailed study of this component here, hence its nature is
not explored further. On the other hand, , and were initially left free to evolve among the different intervals.
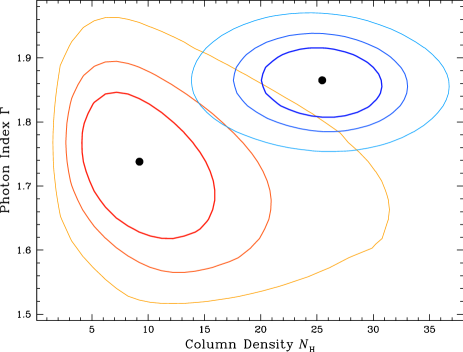
In spite of the possible degeneracies, it turns out that the photon index and the column density are subject to very limited variations: in particular,
. This suggests that and can be roughly treated as constant parameters as well, hence their
values have been tied in all the six spectra: only the covering fraction of the cold absorber is allowed to vary with time.
On sheer statistical grounds, this model already gives a very good fit (, with
and cm-2), proving that, in first approximation, alone would be able to account for
all the observed spectral variability: its qualitative trend across the six intervals, in fact, fairly correlates with the shape of the HR light
curve. There are some problems with the reflection efficiency, though. It is not obvious how to assess the latter quantity in the time-resolved
analysis, anyway by comparing the pexrav amplitude to the highest flux level of the power-law continuum we obtain a reflection
strength of , which is completely inconsistent with the moderate equivalent width of the companion iron line (George & Fabian
1991). Moreover, when extrapolated at higher energies, such component would give rise to a very flat spectrum with a prominent Compton
hump at 30 keV, which is not detected by Swift/BAT. Given that the time-scales are extremely different, it is still possible that
the source is caught in a state of large reflection during the XMM-Newton observation, but in this case the fluorescent iron line should
be much stronger as well. Forcing to have a standard value delivers a poor spectral description, and no improvement is achieved
through the self-consistent reflionx table models (Ross & Fabian 2005).
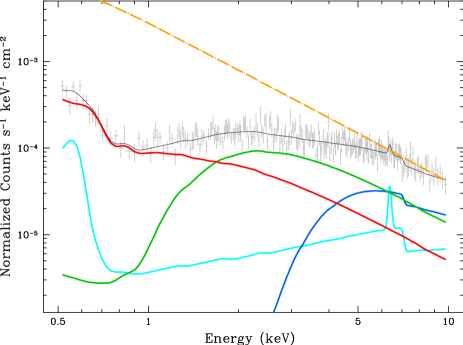
As a consequence, we attempted to introduce a second partial covering cold absorber, assuming again that and (1,2)
are constant, and (1,2) variable. The best fit quality is significantly improved (), while the
photon index is still in excellent agreement with the average high-energy slope of the source. The presence of an
additional absorber with column density of 1023 cm-2 removes all the previous limitations, reducing substantially the required
strength of the reflection continuum (now ). This is also clear from Fig. 3, where the different model components are disentangled
to display their relative contribution in a single time segment. The basic parameters of this final model are listed in Table 1, while the six
individual spectra are shown in Fig. 4.
| Obs. | XMM-Newton | Suzaku |
|---|---|---|
| 1.74 | ||
| 41 | 41∗ | |
| (1) | 0.671022 | 0.511022 |
| (1) | 3.5 | 5.9 |
| (2) | 1.901022 | 1.901022 |
| (2) | 368 | 368∗ |
| EWFe | 64 | |
| 1.4 | ||
| (1) | 1.681022 | 1.071022 |
| (2) | 2.551023 | 0.921023 |
| 1711/1781 | 1095/1146 |
∗: frozen value.
2.2 The Suzaku observation
In spite of the promising indications, the cold absorption scenario needs to be tested on different X-ray observations of NGC 4395 to be
definitely regarded as reliable for this source. Indeed, a complex configuration consisting of both a partially and a fully covering neutral absorber
(plus three warm components) has been shown to provide an adequate fit of the time-averaged spectrum reviewed here, and has been
also applied with success to the short XMM-Newton snapshots of NGC 4395 (Dewangan et al. 2008). In general, however, the
number of counts collected during the archival observations is not sufficient to derive solid and independent constraints on our model.
We have therefore analysed the only other long, high-quality monitoring of NGC 4395 that is available to date, obtained by Suzaku
and fully discussed by Iwasawa, Tanaka & Gallo (2010). In the latter work, the time-averaged spectrum is described by means of a
power-law continuum with , modified by a warm absorber with ionization parameter erg cm s-1
and column density cm-2; a narrow iron line and neutral absorption in moderate excess of the Galactic
amount are also involved. By dividing the whole observation into six segments of equal length, and allowing , and
to vary in turn among the six spectra, the authors suggest that a change of the photon index might account for most of the spectral
variability of the X-ray source. None the less, the 15–35 keV Suzaku/PIN spectrum reveals a slope of , consistent
with the Swift/BAT measure and possibly indicative of some undetected absorption component at lower energies.
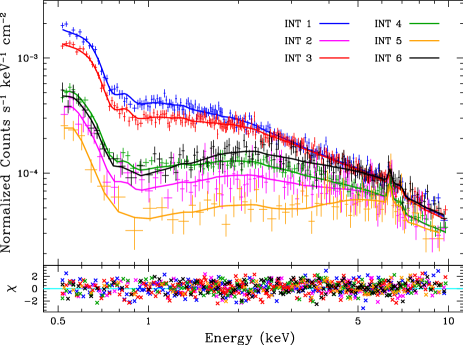
On the wake of this conjecture, we have also performed a time-resolved analysis, yet choosing the time intervals on the grounds of the HR light
curve, as usual. The 5–10 over 2–5 keV hardness ratio follows a trend which is qualitatively very similar to that shown in Fig. 2 (see e.g.
the X-ray colour HR3 in Iwasawa et al. 2010): again, six different periods have been identified. We have adopted the same model defined above.
However, the soft thermal emission and the high-ionization component of the warm absorber cannot be firmly constrained, hence their properties
have been frozen to the values obtained in the XMM-Newton study. In spite of this assumption we are able to recover an excellent fit to
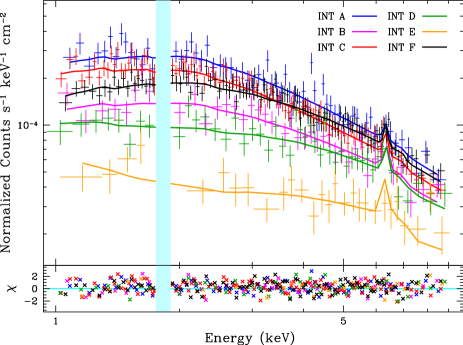
the data, with . The photon index of the primary continuum is slightly flatter (), but its
uncertainty combined with that on (2) is rather large due to the lower data quality (see Fig. 5). Indeed, if is bound
to the XMM-Newton best-fitting measure the variation in terms of statistical goodness is very limited, being .
According to an -test, the probability of chance improvement when is included among the free parameters amounts to 8.3
per cent. In any case, the estimated photon index is again well above the value obtained by describing the time-averaged spectrum with a
simpler model. Our results are summarized in Tables 1 and 2, and the six Suzaku spectra are shown in Fig. 6.
| INT | (0) | (1) | (2) | |
| 1 | 0.620.11 | 0.380.11 | 440/424 | |
| 2 | 0.140.05 | 0.260.09 | 0.600.12 | 118/106 |
| 3 | 0.490.10 | 0.200.06 | 0.310.12 | 488/473 |
| 4 | 0.220.06 | 0.310.09 | 0.470.13 | 395/428 |
| 5 | 0.070.04 | 0.140.07 | 0.790.09 | 55/55 |
| 6 | 0.130.03 | 0.340.08 | 0.530.10 | 215/235 |
| A | 0.360.19 | 0.640.20 | 117/128 | |
| B | 0.280.18 | 0.480.23 | 0.240.20 | 92/81 |
| C | 0.400.17 | 0.600.18 | 375/393 | |
| D | 0.260.17 | 0.240.20 | 0.500.22 | 76/91 |
| E | 0.380.23 | 0.620.25 | 40/27 | |
| F | 0.220.12 | 0.500.15 | 0.280.13 | 405/388 |
3 Discussion
The cold absorption model provides a good interpretation of the spectral variability of the X-ray source during both the XMM-Newton
and Suzaku observations. Moreover, considering the entries of Table 1, the basic physical quantities appear to be in fair agreement.
This is a strong confirmation of the validity of the scenario explored in this work, where the changes are driven by the evolution of the covering
fractions. The (1) and (2) progression is listed in Table 2. Due to the smaller uncertainties, we focus our
discussion on the XMM-Newton case. We first point out that our model is defined in such a way that mutually exclusive regions of the
X-ray source are affected by the two cold absorbers: in other words, we only consider a single-layer configuration of the neutral gas along the
line of sight. All the sequences should be taken with some caution, though. The low ionization stage in one of the warm absorption
component impairs to some extent the determination of (1), while possible changes in the reflection strength on that of (2).
However, even from the face values obtained under our assumptions, some interesting considerations can be drawn. It is now
that shows a tighter correlation with the HR light curve: the peaks during
periods 2 and 5 might be explained in terms of eclipses from individual clouds (e.g. Lamer, Uttley & McHardy 2003; Risaliti et al.
2007). Given that the duration of such events is 10 ks, a typical dimension of the X-ray source of 10 corresponds
to a transverse velocity of the putative clouds of 103 km s-1, placing the obscuring gas at the broad-line region scale. The size
and the shape of these blobs are not precisely known. Yet, our time-resolved analysis suggests that different column densities are present along
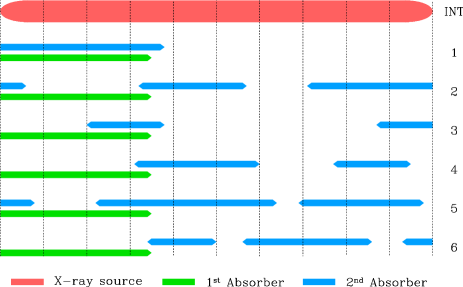
the line of sight at the same time. The range of variations in implies that the number of intervening clouds is very limited (a few at
most, see Fig 7), and that their size is comparable to the dimensions of the X-ray source. The extreme case entails a single irregular and
inhomogeneous absorber.
The physical situation is then expected to be rather complex. In this view, the X-ray absorbers that we have included should be only regarded
as a linear combination of the real ones, whose exact geometrical structure cannot be probed with the present data quality. The large
disparity (roughly an order of magnitude) between the column densities involved, and specifically the fact that
, hints at a multi-layer configuration of the cold absorber, where the two phases have a different location
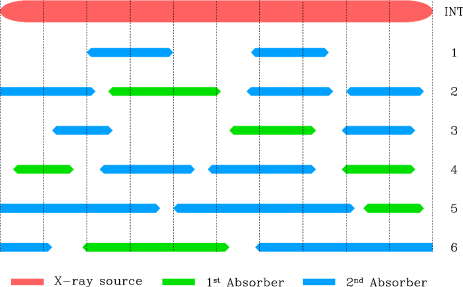
and are superimposed in part on one another when seen in projection. Such a scheme can be envisaged as in Fig. 8: only the broad-line
region component, with cm-2, has a time-dependent covering fraction (–0.8). Conversely,
the absorption system with lower column density is constant (or at least variable over much longer scales), and can be associated with a more
distant gaseous component, within a narrow-line or torus-like region. Indeed, this would be consistent with both the optical classification of
NGC 4395 as a type 1.5–1.8 Seyfert galaxy (Ho et al. 1997; Panessa et al. 2006) and the large covering factor of the emission-line regions
with respect to the central source (Kraemer et al. 1999). The broad- and narrow-line regions are expected to be responsible for some of the UV
to X-ray absorption detected in NGC 4395 (Crenshaw et al. 2004), and evidence for the identification of the rapidly variable X-ray absorber
with the broad-line emitting clouds have been recently found in other Seyfert galaxies (e.g. Maiolino et al. 2010; Risaliti et al. 2011). In this
perspective, the frequency and amplitude of the variations in and/or would be linked to the degree of clumpiness
of the circumnuclear environment at the different scales.
Once the Suzaku data are taken into account, all the considerations made above still hold, even though the uncertainties on the key
parameters are quite large, and the smaller difference between (1) and (2) makes the covering fraction patterns less
meaningful. Apart from the speculations on the physical and geometrical structure of the cold absorption system, the scenario outlined in this
work has the other great advantage of strengthening the correlation between NGC 4395 and the high-luminosity AGN population. First, it gives
reasons for the X-ray spectral hardness of this source, reconciling the estimate of its photon index with the typical values found among
AGN; secondly, neutral absorption variability systematically occurs in a significant fraction of active galaxies, the prototypical case being another type
1.8 Seyfert, NGC 1365 (e.g. Risaliti et al. 2009). Our findings then represent a further point of contact between NGC 4395 and its more massive
and luminous counterparts. Incidentally, it is also worth noting that the intrinsic 0.5–10 keV emission of NGC 4395 implied in this cold absorption
scheme is larger than the observed one by just a factor of 2 (Table 1). Taking advantage of the Swift/BAT spectral constraints,
the resulting 0.5–100 keV luminosity is 6– erg s-1, which exceeds the usual estimates of the bolometric luminosity (see
also Moran et al. 2005; Iwasawa et al. 2010). Depending of the exact value of the black hole mass, the Eddington ratio of NGC 4395 could be
much closer to 0.01 than previously thought.
4 Conclusions
We have discussed a possible interpretation of the X-ray spectral hardness usually observed in the low-luminosity active galaxy
NGC 4395. This source harbours in its centre a black hole with estimated mass of 10, and it is one of the few
known objects whose study can shed light on the links between the physics of accretion processes in Galactic black hole binaries
and AGN. In spite of being a genuine Seyfert galaxy in many respects, NGC 4395 remains a somewhat puzzling source because
of the inferred flatness of its primary X-ray continuum. The existence of complex absorption effects has often been proposed as a likely
explanation. Here we have provided for the first time an example of these effects based on observational evidence, by reviewing
the two highest-quality looks of NGC 4395 taken by XMM-Newton and Suzaku: in both cases, a time-resolved analysis
shows that the spectral evolution of the source can be interpreted by means of a two-phase neutral absorber with variable covering
factor. As a first approximation, this cold absorber is identified with the system of broad-line clouds, allowing for a double-peaked
distribution. The low column density component can otherwise be attributed to an external narrow-line or torus-like
region, with nearly constant . This is presumably an oversimplification of the physical and geometrical structure of the
circumnuclear environment (which is known to comprise also a complex, multi-zone warm absorber), but even the existence of a
single partial-covering cold screen cannot be completely ruled out on statistical grounds.
We stress that the absorption variability scenario presented here is not unique, and different models based on intrinsically flat X-ray
continua (with significant changes of either the photon index or the reflection strength) can describe the observed behaviour of this
source equally well. This interpretation, however, fits into the analogy between the properties of NGC 4395 and those of standard
high-luminosity Seyfert galaxies, many of which are systematically affected by X-ray absorption variability due to the clumpiness of
their circumnuclear regions. Moreover, it allows us to retrieve in a natural way a photon index below 10 keV, in
perfect agreement with the Swift/BAT spectral slope and the usual values measured among AGN. No alternative explanation
would then be required for the intrinsic 2–10 keV flatness of NGC 4395.
Acknowledgments
This work has been partly supported by NASA grant NNX08AN48G. We thank the anonymous referee for constructive and useful comments which significantly improved the content of this paper.
References
- [\citeauthoryearBianchi et al.2009] Bianchi S., Guainazzi M., Matt G., Fonseca Bonilla N., Ponti G., 2009, A&A, 495, 421
- [\citeauthoryearBlustin et al.2005] Blustin A. J., Page M. J., Fuerst S. V., Branduardi-Raymont G., Ashton C. E., 2005, A&A, 431, 111
- [\citeauthoryearBoller, Brandt, & Fink1996] Boller T., Brandt W. N., Fink H., 1996, A&A, 305, 53
- [\citeauthoryearCrenshaw et al.2004] Crenshaw D. M., Kraemer S. B., Gabel J. R., Schmitt H. R., Filippenko A. V., Ho L. C., Shields J. C., Turner T. J., 2004, ApJ, 612, 152
- [\citeauthoryearDewangan et al.2008] Dewangan G. C., Mathur S., Griffiths R. E., Rao A. R., 2008, ApJ, 689, 762
- [\citeauthoryearFilippenko & Sargent1989] Filippenko A. V., Sargent W. L. W., 1989, ApJ, 342, L11
- [\citeauthoryearFilippenko & Ho2003] Filippenko A. V., Ho L. C., 2003, ApJ, 588, L13
- [\citeauthoryearGeorge & Fabian1991] George I. M., Fabian A. C., 1991, MNRAS, 249, 352
- [\citeauthoryearHaardt & Maraschi1991] Haardt F., Maraschi L., 1991, ApJ, 380, L51
- [\citeauthoryearHo et al.1997] Ho L. C., Filippenko A. V., Sargent W. L. W., Peng C. Y., 1997, ApJS, 112, 391
- [\citeauthoryearIwasawa, Tanaka, & Gallo2010] Iwasawa K., Tanaka Y., Gallo L. C., 2010, A&A, 514, A58
- [\citeauthoryearKalberla et al.2005] Kalberla P. M. W., Burton W. B., Hartmann D., Arnal E. M., Bajaja E., Morras R., Pöppel W. G. L., 2005, A&A, 440, 775
- [\citeauthoryearKraemer et al.1999] Kraemer S. B., Ho L. C., Crenshaw D. M., Shields J. C., Filippenko A. V., 1999, ApJ, 520, 564
- [\citeauthoryearLamer, Uttley, & McHardy2003] Lamer G., Uttley P., McHardy I. M., 2003, MNRAS, 342, L41
- [\citeauthoryearMagdziarz & Zdziarski1995] Magdziarz P., Zdziarski A. A., 1995, MNRAS, 273, 837
- [\citeauthoryearMaiolino et al.2010] Maiolino R., et al., 2010, A&A, 517, A47
- [\citeauthoryearMoran et al.2005] Moran E. C., Eracleous M., Leighly K. M., Chartas G., Filippenko A. V., Ho L. C., Blanco P. R., 2005, AJ, 129, 2108
- [\citeauthoryearNardini et al.2011] Nardini E., Fabian A. C., Reis R. C., Walton D. J., 2011, MNRAS, 410, 1251
- [\citeauthoryearPanessa et al.2006] Panessa F., Bassani L., Cappi M., Dadina M., Barcons X., Carrera F. J., Ho L. C., Iwasawa K., 2006, A&A, 455, 173
- [\citeauthoryearPeterson et al.2005] Peterson B. M., et al., 2005, ApJ, 632, 799
- [\citeauthoryearPorquet et al.2004] Porquet D., Reeves J. N., O’Brien P., Brinkmann W., 2004, A&A, 422, 85
- [\citeauthoryearRisaliti et al.2007] Risaliti G., Elvis M., Fabbiano G., Baldi A., Zezas A., Salvati M., 2007, ApJ, 659, L111
- [\citeauthoryearRisaliti et al.2009] Risaliti G., et al., 2009, MNRAS, 393, L1
- [\citeauthoryearRisaliti et al.2011] Risaliti G., Nardini E., Salvati M., Elvis M., Fabbiano G., Maiolino R., Pietrini P., Torricelli-Ciamponi G., 2011, MNRAS, 410, 1027
- [\citeauthoryearRoss & Fabian2005] Ross R. R., Fabian A. C., 2005, MNRAS, 358, 211
- [\citeauthoryearShih, Iwasawa, & Fabian2003] Shih D. C., Iwasawa K., Fabian A. C., 2003, MNRAS, 341, 973
- [\citeauthoryearSmith et al.2001] Smith R. K., Brickhouse N. S., Liedahl D. A., Raymond J. C., 2001, ApJ, 556, L91
- [\citeauthoryearVaughan et al.2005] Vaughan S., Iwasawa K., Fabian A. C., Hayashida K., 2005, MNRAS, 356, 524