Low-temperature dependence of the thermo-magnetic transport properties of the SrTiO3/LaAlO3 interface.
Abstract
We report transport measurements, including: Hall, Seebeck and Nernst Effect. All these transport properties exhibit anomalous field and temperature dependences, with a change of behavior observed at about and . We were able to reconcile the low-temperature-low-field behavior of all transport properties using a simple two band analysis. A more detailed model is required in order to explain the high magnetic field regime.
pacs:
I INTRODUCTION
It has been demonstrated that when depositing more than 3 unit cells of LaAlO3 over a TiO2 terminated SrTiO3 a conducting layer appears at the interface.Ohtomo and Hwang (2004); Thiel et al. (2006) The nature and origin of the charge carriers are still unknown. Simple electrostatic consideration suggests a transfer of 0.5 electron per unit cell.Ohtomo and Hwang (2004)Other theoretical work suggests that the electronic reconstruction that occurs at the interface results in lattice deformation and a charge density that corresponds to less than 0.5 electron per unit cell.Pentcheva and Pickett (2009) Oxygen vacancies Kalabukhov et al. (2007) and cationic mixing Willmott et al. (2007) can also contribute to the conductance. The relative contributions of these processes depend on deposition condition. Recent measurements of Shubnikov-de Haas (SdH) oscillations indicate the possibility of a two-band structure.Ben Shalom et al. (2010) Other works have interpreted the non linear Hall voltage as being the anomalous Hall effect arising from incipient magnetization.Seri and Klein (2009); Ben Shalom et al. (2010). On the theory side magnetic effects have been predicted to take place at the interfaces.Zhong and Kelly (2008); Popovicć et al. (2008)
In metals, the thermopower is expected to be linear for TTF and the Nernst signal should, in principle, be zero. This is due to the cancelation of the two terms in the Nernst coefficient: , with the resistivity, the Hall resistance and the Peltier tensor.Wang et al. (2006) When two types of charge carriers are present this cancelation is relaxed and the Nernst signal can be finite. One therefore expects the Nernst signal to be a sensitive probe to the existence of multiple types of charge carriers. We can therefore use the resistivity, Hall, thermopower and Nernst signal data and see whether the multiple carrier picture can explain the transport. This is what we have done. We find that the low temperature-low field regime can be explained using a simple model of two types of charge carriers. The high field regime for the Nernst measurements cannot be explained by this approach.

II SAMPLE AND EXPERIMENTAL SETUP
We have used a sample with 17 unit cells of LaAlO3, deposited by pulsed laser deposition on a TiO2-terminated SrTiO3(100) substrate. The deposition conditions are similar to previously reported samples.Ben Shalom et al. (2010) The 2DEG’s contacts consisted of Al bond wires. A custom built probe was used in conjunction with a QD PPMS system. The probe consisted of twined phosphor bronze wires, each pair inside a thin stainless steel pipe used for screening. The sample was mounted onto a copper mechanical clamp at one end while the other end was ’floating’ (thermally uncoupled) and the sample chamber itself was pumped to 1Torr to avoid thermalization of the sample in order to maintain the required thermal gradient. Two Lakeshore Cernox thermometers were used for the temperature gradient measurement. A 220 SMT resistor was used as a heater. We used GE-Varnish for attaching the thermometers and the heater onto the sample’s surface. A Keithley 6220/6221 delta-mode DMM was used for the 4 point Hall and resistance measurements. A Keithley 1801 nanovolt preamp was used with a 2001 DMM for the thermal measurements. Each transport measurement was followed by a measurement of the Nernst signal at the same base temperature (all measurements were done sequentially).
When measuring the Nernst signal the sample is set to a certain base temperature and the heater is turned on, allowing for the system to reach a steady state, then the magnet is sweeped from -6T to 6T. We made sure that the zero field temperature returned to it’s original value after the field sweep. A thermopower measurement of the 2DEG was conducted between 30K and 3K at zero field (The thermopower has a negligible field dependence at low temperatures).

III DATA AND ANALYSIS
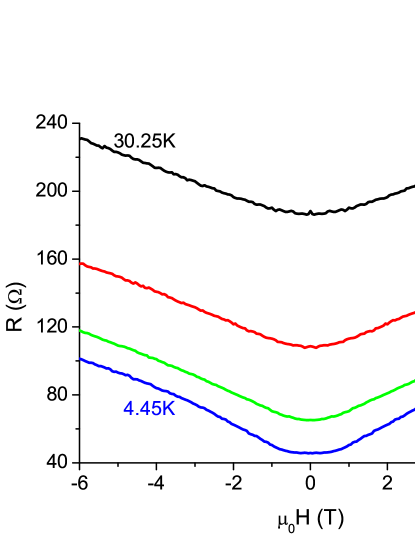
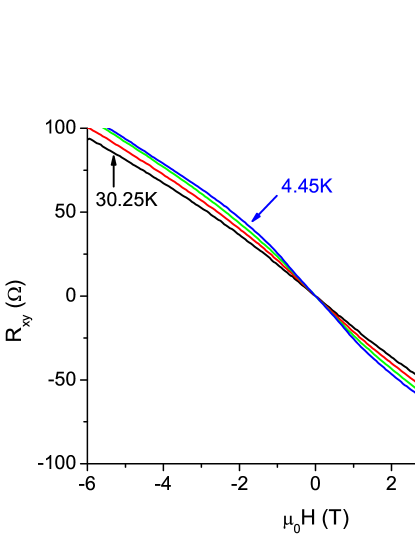
In Fig 1-2 we show the longitudinal and transverse resistance as a function of temperature and field. These measurements are consistent with previous results obtained by our group.Ben Shalom et al. (2009) The anomalous change in slope of the magnetoresistance at low temperatures occurs at , while the Hall resistivity () shown in Fig 2 exhibits a distinctive non-linear behavior, having a pronounced “kink” also at .
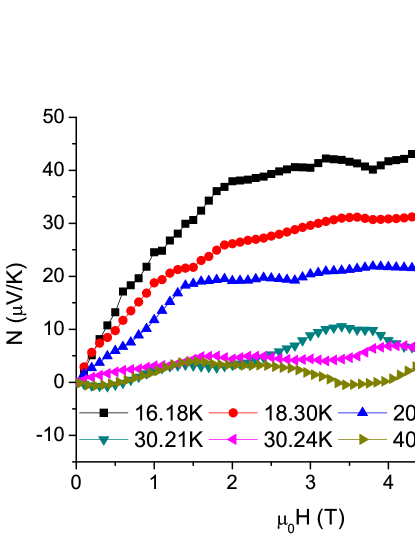
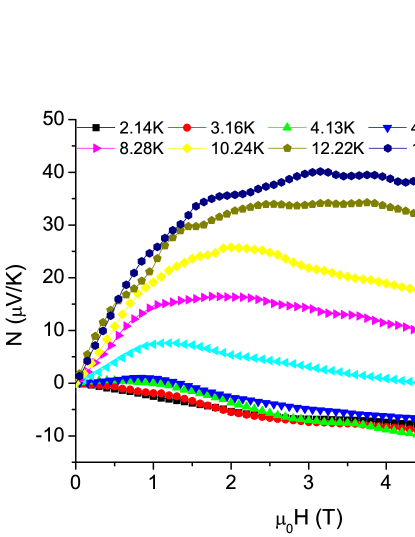
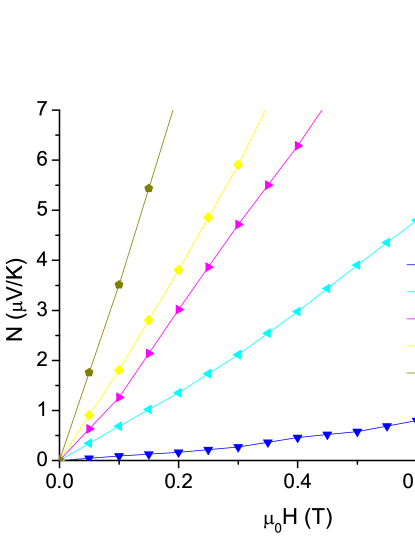
Fig.3 shows the temperature dependence of the Nernst signal taken from the antisymmetric component of the transverse voltage. This eliminates contributions from the contacts and misalignments. As the temperature is lowered the signal increases until a maximum is reached at T=15K. Reducing the temperature further the signal decreases to the point where it changes sign at T=3K for the entire range of field studied, becoming roughly linear.
This anomalous behavior of the Nernst signal is unlikely to be associated with superconductivity or superconducting fluctuations since the critical temperature is , while the anomalous signal appears above 6K. In the case of superconducting fluctuations above , the Nernst signal is expected to be enhanced significantly when approaching .
The next option to explain the large Nernst signal is induced magnetization and the spin-orbit coupling. In this case, due to a mechanism similar to the anomalous Hall effect involving skew scattering, a large Nernst signal is expectedMiyasato et al. (2007). However, for this scenario, one expects the Nernst signal to increase with magnetic field or merely to saturate.


This expected behavior is not observed in our measurements where the amplitude of the Nernst signal decreases at large fields. In addition, the signal is expected to increase or saturate as the temperature is lowered, in contrast with our measurements in low fields. We therefore conclude that induced magnetization is not the main mechanism responsible for the large Nernst effect for T4K and H2T. One should notice that in contrast to the low-field behavior, the high-field Nernst signal seems to have a temperature independent slope, persisting from 15K down to the lowest temperature measured. This slope dominates the Nernst signal below 3K, while the non monotonic field dependence of the Nernst signal is absent. This will be discussed in the concluding part, from now on we shall be focusing on the low-field regime.
The next option one needs to consider is that the big Nernst signal originates from multiple types of carriers. This possibility had been considered in the past and is in agreement with the non-linear shape of the Hall measurements.Ben Shalom et al. (2010) Recent results of Shubnikov de-Haas measurements on SrTiO3-LaAlO3 also indicate the existence of two types of carriers.Ben Shalom et al. (2010) The Nernst signal shows a definite change in slope at a field of , similarly to magnetoresistance and Hall measurements.
To extract the transport contribution of each band, we analyse the Hall resistivity similarly to Ben-Shalom et al..Ben Shalom et al. (2010) This simplistic model assumes two-types of charge carriers, even though it is possible that a more complicated band structure is involved and other effects might be present. The Hall data is fitted using:
| (1) |
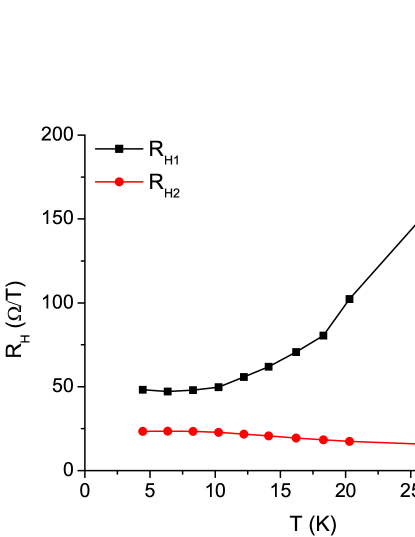
with and are the Hall coefficient and conductivity of the type of carrier. Fig 2 shows the fit to for the entire field range done using Eq.1 and the measured zero field resistance, taken from the magnetoresistance measurements (Fig 1). The carrier concentrations and conductance contribution of each band were then extracted and are summarized in Table 1 and Fig 6. The discrepancy between the carrier concentration we obtained and SdH experiments, has already been noted and explained by possible multiple degeneracy scenario.Ben Shalom et al. (2010)
| T | [K] | 4.45 | 6.35 | 8.3 | 10.25 | 12.2 | 14.1 | 16.2 | 18.3 | 20.3 | 30.25 |
|---|---|---|---|---|---|---|---|---|---|---|---|
| RH1 | [T-1] | 48.26 | 47.15 | 47.96 | 49.73 | 55.82 | 61.87 | 70.71 | 80.50 | 102.33 | 189.26 |
| RH2 | [T-1] | 23.40 | 23.54 | 23.43 | 22.83 | 21.77 | 20.69 | 19.45 | 18.38 | 17.46 | 14.47 |
| [m-2] | 0.0156 | 0.0147 | 0.0132 | 0.0114 | 0.0092 | 0.0075 | 0.0059 | 0.0047 | 0.0035 | 0.0012 | |
| [m-2] | 0.0063 | 0.0060 | 0.0059 | 0.0058 | 0.0061 | 0.0060 | 0.0059 | 0.0058 | 0.0057 | 0.0041 | |
| n1 | [cm-2x10¹³] | 1.295 | 1.325 | 1.303 | 1.256 | 1.119 | 1.010 | 0.884 | 0.776 | 0.610 | 0.330 |
| n2 | [cm-2x10¹³] | 2.670 | 2.655 | 2.667 | 2.737 | 2.870 | 3.019 | 3.213 | 3.399 | 3.578 | 4.318 |
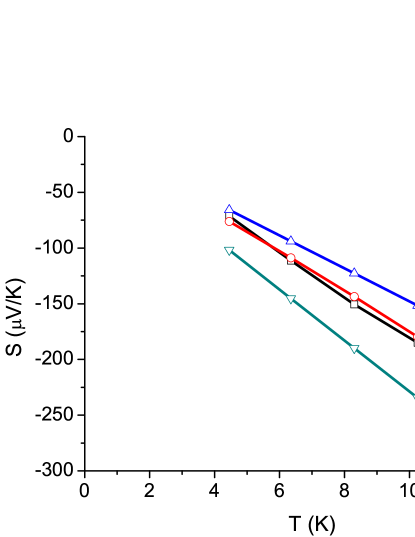
The thermopower measurement is shown in Fig.4. A change in slope is evident at T=15K below which the thermopower turns linear as expected for low temperatures (), and extrapolates linearly to zero at T=0K. In this low-temp regime, we use the simple expression for the case of a degenerate 2D free electron gas:KARAVOLAS and BUTCHER (1991)
| (2) |
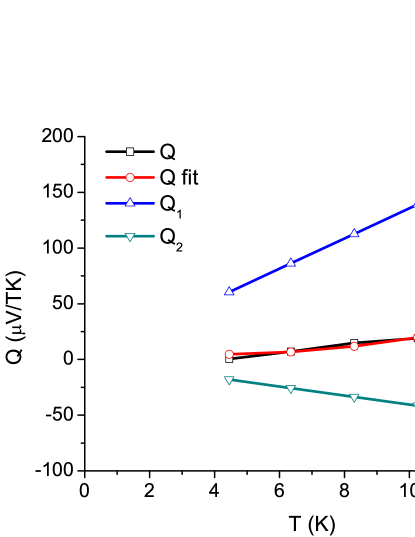
We estimate , assuming the simple case of an energy independent relaxation time (), which is in general agreement with the linear temperature dependence observed below 15K. We assume a linear contribution by each type of charge carrier to the thermopower and the Nernst coefficient:
| (3) |
| (4) |
with is the thermopower and the Nernst coefficient conribution of the type of carrier. Using the results extracted from the fits to the Hall data and Eq.3, the parameters of and are then extracted using the methodPress et al. (2007) and used in Eq.4 with the linear slope of the Nernst signal at low fields, to calculate and . The fit was done assuming a simple model of linear response in field and temperature for both components of the thermopower and the Nernst coefficient. The resulting values for and are presented in Table 2. The fits used for the thermopower and Nernst calculations are shown in Fig 7 and 7 respectively. Eq.4 applies to the isothermal Nernst coefficient. In our case, the sample is considered isotropic in the 2DEG plane, and the electron mobility is quite low, so a Righi-Leduc effect should be negligible. Therefore, we can use it for our measured (adiabatic) Nernst coefficient.Sugihara (1969); Wang et al. (2001)
| -14.79 | -22.88 | -4.06 | 13.57 |
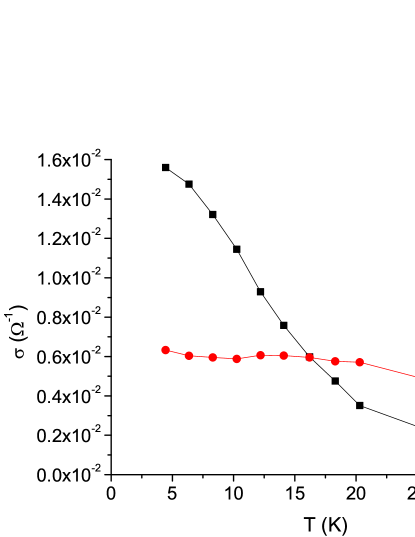
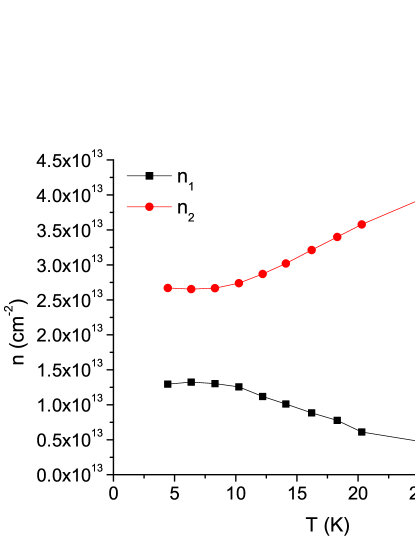
The conductance, Hall coefficients and charge carrier densities, calculated from the electrical transport data indicate a change in behavior at in agreement with the thermal transport measurements (Fig 3). As seen in Fig 6,5, the density of the two types of charge carriers remains roughly unchanged, while their contribution to the conductance is not, which implies that the change in conductance is related to the carriers’ mobility.Bell et al. (2009) More so, Fig 5 shows that one type of charge carriers’ contribution to the 2DEG’s conductance is relatively temperature independent, while the other type of carrier varies significantly.
IV DISCUSSION AND SUMMARY
Our results indicate the magnetic field scale of and the temperature of as points where the system undergoes a distinct change in behavior, perhaps due to a change in the contribution of one of the two bands of charge carriers. This behavior is evident in the thermopower, where a minima is observed at 15K. Below this temperature the thermopower becomes linear. At this temperature range we can see that the Nernst signal at high magnetic field turns linear. As the temperature is lowered, the linear regime broadens, spanning the entire field range below 3K. This linear Nernst signal is anomalously large. It may arise from dominance of the mobile band, as indicated from the conductance shown in Fig.5. Another possibility is that a magnetic order is induced at high fields and low temperatures, enhancing the Nernst signal. In this view, the minima in the thermopower maybe related to a Kondo-like temperature. However, in a simple Kondo scenario one would expect a minimum in resistivity which is absent in our data. It is clear that the Nernst signal is unrelated to superconducting fluctuations. Further experimental study is needed in order to determine which carriers undergo a superconducting condensation and what is the role of fluctuations at lower temperatures. We speculate that the more mobile band, which is observed in SdH measurements,Ben Shalom et al. (2010); Caviglia et al. (2010) is responsible for the superconducting transition as we can see that its Nernst signal becomes dominant at low temperatures (below 5K).
In summary, transport measurements of the 2DEG at the interface of a SrTiO3-LaAlO3 show an anomalous behavior which cannot be explained by a single type of charge carriers. The electrical transport properties are consistent with previous results, specifically the carrier concentrations and the electron mobility, obtained by Hall effect.Ben Shalom et al. (2010); Ben Shalom et al. (2010) We were able to successfully fit the measured Hall resistivity as well as the thermopower at low temperature and the corresponding Nernst coefficient in low magnetic fields to a two-band system model. The electrical and thermal measurements are in excellent agreement.
V ACKNOWLEDGMENTS
We thank R. Mor, A. Palevsky and Y. Korenblit for helpful discussions. This research was supported by the ISF under Grants No. 1421/08, 1543/08.
References
- Ohtomo and Hwang (2004) A. Ohtomo and H. Y. Hwang, Nature 427, 423 (2004), ISSN 1476-4687.
- Thiel et al. (2006) S. Thiel, G. Hammerl, A. Schmehl, C. Schneider, and J. Mannhart, Science 313, 1942 (2006).
- Pentcheva and Pickett (2009) R. Pentcheva and W. E. Pickett, Phys. Rev. Lett. 102, 107602 (2009).
- Kalabukhov et al. (2007) A. Kalabukhov, R. Gunnarsson, J. Börjesson, E. Olsson, T. Claeson, and D. Winkler, Phys. Rev. B 75, 121404 (pages 4) (2007).
- Willmott et al. (2007) P. R. Willmott, S. A. Pauli, R. Herger, C. M. Schlepütz, D. Martoccia, B. D. Patterson, B. Delley, R. Clarke, D. Kumah, C. Cionca, et al., Phys. Rev. Lett. 99, 155502 (2007).
- Ben Shalom et al. (2010) M. Ben Shalom, A. Ron, A. Palevski, and Y. Dagan, Physical Review Letters 105 (2010), ISSN 0031-9007.
- Seri and Klein (2009) S. Seri and L. Klein, Phys. Rev. B 80, 180410 (pages 4) (2009).
- Ben Shalom et al. (2010) M. Ben Shalom, M. Sachs, D. Rakhmilevitch, A. Palevski, and Y. Dagan, Phys. Rev. Lett. 104, 126802 (2010).
- Zhong and Kelly (2008) Z. Zhong and P. J. Kelly, Europhys. Lett. 84, 27001 (2008).
- Popovicć et al. (2008) Z. S. Popovicć, S. Satpathy, and R. M. Martin, Phys. Rev. Lett. 101, 256801 (pages 4) (2008).
- Wang et al. (2006) Y. Wang, L. Li, and N. Ong, Physical Review B 73, 1 (2006), ISSN 1098-0121.
- Ben Shalom et al. (2009) M. Ben Shalom, C. W. Tai, Y. Lereah, M. Sachs, E. Levy, D. Rakhmilevitch, A. Palevski, and Y. Dagan, Phys. Rev. B 80, 140403 (pages 4) (2009).
- Miyasato et al. (2007) T. Miyasato, N. Abe, T. Fujii, a. Asamitsu, S. Onoda, Y. Onose, N. Nagaosa, and Y. Tokura, Physical Review Letters 99, 1 (2007), ISSN 0031-9007.
- KARAVOLAS and BUTCHER (1991) V. C. KARAVOLAS and P. N. BUTCHER, Journal of physics. Condensed matter 3, 2597 (1991), ISSN 0953-8984.
- Press et al. (2007) W. H. Press, S. A. Teukolsky, W. T. Vetterling, and B. P. Flannery, Numerical Recipes 3rd Edition: The Art of Scientific Computing (Cambridge University Press, 2007), 3rd ed., ISBN 0521880688.
- Sugihara (1969) K. Sugihara, Journal of the Physical Society of Japan 27, 362 (1969), URL http://jpsj.ipap.jp/link?JPSJ/27/362/.
- Wang et al. (2001) Y. Wang, Z. A. Xu, T. Kakeshita, S. Uchida, S. Ono, Y. Ando, and N. P. Ong, Phys. Rev. B 64, 224519 (2001).
- Bell et al. (2009) C. Bell, S. Harashima, Y. Kozuka, M. Kim, B. G. Kim, Y. Hikita, and H. Y. Hwang, Phys. Rev. Lett. 103, 226802 (2009).
- Caviglia et al. (2010) A. D. Caviglia, S. Gariglio, C. Cancellieri, B. Sacépé, A. Fête, N. Reyren, M. Gabay, A. F. Morpurgo, and J.-M. Triscone, Phys. Rev. Lett. 105, 236802 (2010).