11email: polletta@iasf-milano.inaf.it 22institutetext: Institut d’Astrophysique Spatiale, Université de Paris XI, 91405 Orsay Cedex, France
33institutetext: Institute de Radioastronomie Millimetrique, 300 rue de la Piscine, 38406 St. Martin d’Heres, France
44institutetext: Institut d’Astrophysique de Paris, CNRS & Université Pierre et Marie Curie, 98bis, bd. Arago, 75014 Paris, France
55institutetext: Max-Planck-Institut für extraterrestrische Physik, Postfach 1312, 85741 Garching, Germany
Disk, merger, or outflow ? Molecular gas kinematics in two powerful obscured QSOs at 3.4
We report on the detection of bright CO(4-3) line emission in two powerful, obscured quasars discovered in the SWIRE survey, SW022513 and SW022550 at z3.4. We analyze the line strength and profile to determine the gas mass, dynamical mass and the gas dynamics for both galaxies. In SW022513 we may have found the first evidence for a molecular, AGN-driven wind in the early Universe. The line profile in SW022513 is broad (FWHM = 1000 km s-1) and blueshifted by 200 km s-1 relative to systemic (where the systemic velocity is estimated from the narrow components of ionized gas lines, as is commonly done for AGN at low and high redshifts). SW022550 has a more regular, double-peaked profile, which is marginally spatially resolved in our data, consistent with either a merger or an extended disk.
The molecular gas masses, M⊙, are large and account for 30% of the stellar mass, making these obscured QSOs as gas rich as other powerful CO emitting galaxies at high redshift, i.e., submillimeter galaxies. Our sources exhibit relatively lower star-formation efficiencies compared to other dusty, powerful starburst galaxies at high redshift. We speculate that this could be a consequence of the AGN perturbing the molecular gas.
Key Words.:
Galaxies: high-redshift – Submillimeter: ISM – Submillimeter: galaxies – (Galaxies:) quasars: individual: SWIRE2 J022550.32042149.6, SWIRE2 J022513.90043419.91 Introduction
The most accredited galaxy evolution models postulate that the progenitors of massive galaxies evolve through a phase of intense star-formation activity at high redshift, accompanied by accretion onto a central supermassive black hole (e.g. Sanders et al. 1988; Granato et al. 2001, 2004; Di Matteo et al. 2005). Star formation and accretion are both fueled by cold gas, and are therefore intricately linked. Several cosmological models now postulate that the phase of growth of black hole and host is terminated when the accreting black hole is able to heat and expel the ambient gas (e.g., Sanders et al. 1988; Granato et al. 2001, 2004; Di Matteo et al. 2005; Hopkins et al. 2005; Churazov et al. 2005; Merloni & Heinz 2008; Fanidakis et al. 2011). Given the central role of cold gas in these processes, molecular emission line studies should be ideal to test and refine these scenarios (e.g., Narayanan et al. 2009).
Owing to their brightness, CO emission lines are commonly used to trace the immense reservoirs of molecular gas in high-redshift galaxies, providing valuable constraints on the gas content, gas heating and cooling processes, and on the evolutionary and dynamical state of these systems. CO line profiles, and in particular the molecular gas kinematics observed with interferometers at high spatial resolution, allow to differentiate between, e.g., rotating disks and mergers. Under the assumption that the gas is driven by gravity and is approximately virialized, CO line profiles and velocity gradients can be used to estimate dynamical masses. In recent years, CO observations have led to a plethora of new constraints, e.g., on star-formation efficiencies in different types of high- galaxies (Greve et al. 2005; Solomon & Vanden Bout 2005; Tacconi et al. 2008; Coppin et al. 2008; Iono et al. 2009; Daddi et al. 2010; Riechers 2011), the regulation of star-formation in the most rapidly growing galaxies (Beelen et al. 2004; Greve et al. 2005; Daddi et al. 2008; Schinnerer et al. 2008; Nesvadba et al. 2009; Genzel et al. 2010), or the co-evolution of black holes and their host galaxies (Peng et al. 2006; Maiolino et al. 2007; Alexander et al. 2008; Riechers et al. 2009b; Wang et al. 2010).
Molecular gas studies have been carried out in starburst-dominated galaxies, e.g., submillimeter galaxies (SMGs), type I QSOs, radio galaxies, and even normal star-forming galaxies over large redshift ranges (e.g., Omont et al. 1996; Neri et al. 2003; Solomon & Vanden Bout 2005; Weiß et al. 2005; Greve et al. 2005; Carilli & Wang 2006; Tacconi et al. 2008; Coppin et al. 2008; Nesvadba et al. 2009; Riechers et al. 2009b, a; Daddi et al. 2010; Bothwell et al. 2010; Riechers 2011). By comparison, only few obscured (type II) quasars have been targeted in CO millimeter studies (Aravena et al. 2008; Martínez-Sansigre et al. 2009; Yan et al. 2010). This is unfortunate, because obscured quasars could represent the short, but critical transition phase between starburst and type I (unobscured) QSO activity (e.g., Sanders et al. 1988; Hopkins et al. 2006), but has also been unavoidable so far, because identifying these objects and obtaining spectroscopic redshifts remains a challenge.
The Spitzer Space Telescope (Werner et al. 2004) unveiled a significant number of obscured quasars owing to their bright mid-infrared (MIR) emission. However, only about 20-25% of these galaxies are also bright at millimeter wavelengths (Lutz et al. 2005; Polletta et al. 2009; Martínez-Sansigre et al. 2009), and only few of those have accurate spectroscopic redshifts, which enable detailed studies of their millimeter CO emission (Sajina et al. 2008; Yan et al. 2010). Those that have been detected in CO have large molecular gas masses and a wide range of CO line profiles (Aravena et al. 2008; Martínez-Sansigre et al. 2009; Yan et al. 2010). Their overall properties are similar to SMGs, suggesting they may be mergers (Dasyra et al. 2008; Yan et al. 2010) with intense, dusty star formation. Obscured quasars are expected to be close to the ‘blowout’ phase when the AGN heats and expels the remaining cold ISM, terminating star formation and accretion activity. However, no signature of such winds has so far been found, although broad CO line wings have now been identified in a growing number of nearby AGN, illustrating that molecular outflows are indeed possible (Feruglio et al. 2010; Alatalo et al. 2011).
Here we present CO millimeter observations of two obscured QSOs associated with massive, intensely star-forming galaxies. These systems are amongst the most luminous obscured QSOs at high- currently known. They are thus ideal candidates to investigate if obscured QSOs are indeed close to complete their phase of active growth, and in particular, if this phase is terminated by feedback from their AGN. We will argue that this could potentially be the case in one of our targets. Throughout the paper, we adopt a cosmology with H0=71 km s-1 Mpc-1, =0.73, and =0.37 (Spergel et al. 2003).
| Parameter | SW022550 | SW022513 |
|---|---|---|
| 3.8670.009 | … | |
| 3.8760.001 | 3.4270.002 | |
| F1.2mm [mJy] | 4.700.77 | 5.530.72 |
| Mstellara𝑎aa𝑎aL(IR) is the 8–1000 m luminosity in L⊙, Mstellar the stellar mass, and SFR the star-formation rate (see § 2 and Polletta et al. 2008a). [1010M⊙] | 16–80 | 20–40 |
| Log(L(IR)a𝑎aa𝑎aL(IR) is the 8–1000 m luminosity in L⊙, Mstellar the stellar mass, and SFR the star-formation rate (see § 2 and Polletta et al. 2008a).) [L⊙] | 12.5–13.3 | 12.5–13.2 |
| SFRa𝑎aa𝑎aL(IR) is the 8–1000 m luminosity in L⊙, Mstellar the stellar mass, and SFR the star-formation rate (see § 2 and Polletta et al. 2008a). [M⊙/yr] | 500–3000 | 500–3000 |
| 3.87190.0008 | 3.42200.0007 | |
| 3.86860.0007 | 3.42080.0013 | |
| 3.87610.0012 | 3.42700.0007 | |
| b𝑏bb𝑏b is the observed frequency of the CO line fitted with a single Gaussian. and are the observed frequencies of the two CO peaks obtained with a double Gaussian fit, and FWHM, FWHM1, and FWHM2 are the corresponding full-widths-at-half maximum. [GHz] | 94.6330 | 104.2598 |
| b𝑏bb𝑏b is the observed frequency of the CO line fitted with a single Gaussian. and are the observed frequencies of the two CO peaks obtained with a double Gaussian fit, and FWHM, FWHM1, and FWHM2 are the corresponding full-widths-at-half maximum. [GHz] | 94.6978 | 104.2885 |
| b𝑏bb𝑏b is the observed frequency of the CO line fitted with a single Gaussian. and are the observed frequencies of the two CO peaks obtained with a double Gaussian fit, and FWHM, FWHM1, and FWHM2 are the corresponding full-widths-at-half maximum. [GHz] | 94.5504 | 104.1432 |
| FWHMb𝑏bb𝑏b is the observed frequency of the CO line fitted with a single Gaussian. and are the observed frequencies of the two CO peaks obtained with a double Gaussian fit, and FWHM, FWHM1, and FWHM2 are the corresponding full-widths-at-half maximum. [km s-1] | 800120 | 1020110 |
| FWHM1b𝑏bb𝑏b is the observed frequency of the CO line fitted with a single Gaussian. and are the observed frequencies of the two CO peaks obtained with a double Gaussian fit, and FWHM, FWHM1, and FWHM2 are the corresponding full-widths-at-half maximum. [km s-1] | 29090 | 950150 |
| FWHM2b𝑏bb𝑏b is the observed frequency of the CO line fitted with a single Gaussian. and are the observed frequencies of the two CO peaks obtained with a double Gaussian fit, and FWHM, FWHM1, and FWHM2 are the corresponding full-widths-at-half maximum. [km s-1] | 420180 | 200150 |
| vc𝑐cc𝑐cVelocity offset between the peaks of the double Gaussian fit. [km s-1] | 46090 | 420100 |
| ICO [Jy km s-1] | 1.460.28 | 2.620.36 |
| ICO,1 [Jy km s-1]d𝑑dd𝑑dIntensity derived from each component of the double Gaussian fit. | 0.680.11 | 2.250.28 |
| ICO,2 [Jy km s-1]d𝑑dd𝑑dIntensity derived from each component of the double Gaussian fit. | 0.700.23 | 0.280.21 |
| LCOe𝑒ee𝑒eLCO is the CO line luminosity, in L⊙. [108 L⊙] | 1.770.32 | 2.610.36 |
| Lf𝑓ff𝑓fL is the integrated CO luminosity, in K km s-1 pc2. [1010 K km s-1 pc2] | 5.71.0 | 8.31.2 |
| Mgasg𝑔gg𝑔gMgas is the gas (H2+He) mass. [1010 M⊙] | 4.530.82 | 6.660.92 |
| Mgas/Mstellar | 0.06–0.29 | 0.17–0.33 |
| M [1010 M⊙] | 4020 | 2–34 |
| M [1010 M⊙] | 2010 | 9–35 |
| SFEhℎhhℎhSFE is the star-formation efficiency defined as L(FIR)/L (see § 5.3). [L⊙/(K km s-1 pc2)] | 35–194 | 24–108 |
2 Selected sources: obscured QSOs at 3.4
The targets selected for this study are SWIRE2 J022550.32$-$042149.6 (SW022550 hereafter) at =3.8670.009, and SWIRE2 J022513.90$-$043419.9 (SW022513 hereafter) at =3.4270.002. Both sources are situated in a region common to the SWIRE (Lonsdale et al. 2003), XMDS (Chiappetti et al. 2005), CFHTLS Deep222http://www.cfht.hawaii.edu/Science/CFHTLS/, and UKIDSS (Dye et al. 2006; Lawrence et al. 2007) surveys. They benefit from a wealth of high-quality multi- data, from X-ray to radio wavelengths, and optical and near-infrared (NIR) spectroscopic data, including VLT/SINFONI imaging spectroscopy (see Polletta et al. 2008a; Nesvadba et al. 2011b, for a description of their multi-wavelength data and properties). A fit to their multi-wavelength spectral energy distribution (SED) indicates a dominant AGN component in the MIR and a starburst at longer wavelengths. Their optical and near-infrared spectra display strong narrow high ionization emission lines typical of obscured AGNs, and fainter blueshifted broad components (see Polletta et al. 2008a; Nesvadba et al. 2011b). They are very luminous QSOs (L1047 ) with high MIR/optical flux ratios (30), and faint and hard X-ray emission typical of heavily absorbed sources. The estimated stellar masses for both systems are a few times 1011 M⊙, and the star-formation rates (SFRs) 500–3000 M⊙/yr (Polletta et al. 2008a). In Table 1 we report the total IR luminosity [L(IR)], estimated SFR, stellar masses and redshifts for both targets. The IR luminosity [L(IR)] is the 8–1000 m luminosity in L⊙ derived after removing the AGN contribution. The star-formation rate, SFR, is derived from L(IR), using the following prescription: SFR(M⊙/yr) = L(IR)/(5.8109L⊙) (Kennicutt 1998). The stellar mass, Mstellar, is derived from the H-band (1.6 m in the rest-frame) luminosity assuming the L(H)/Mstellar ratio reported by Seymour et al. (2007). Note that L(IR), and thus the SFR, are not well constrained due to the lack of data between 24 m, and 1.2 mm. For more details on these estimates see Polletta et al. (2008a). The bright (5 mJy, see Table 1) millimeter fluxes and accurate redshifts of SW022550 and SW022513 motivated CO observations with the Plateau de Bure Interferometer (PdBI) of both targets. The observations are described in the next section, the CO line properties in § 4, and the molecular gas dynamics and implications in § 5.
3 PdBI observations and data reduction
Observations with the IRAM PdBI were carried out on August 3–9, 2009, in the D configuration. The 3-mm receivers were tuned to the central observed frequency according to the spectroscopic redshifts. We centered the 1 GHz (about 3000 km s-1) observation band at the redshift derived from the UV rest-frame lines for SW022550, =3.8670.009333The redshift of SW022550 has been revised after the PdBI observations were carried out. The UV spectrum presents two main sets of emission lines, one at =3.867, and another, dominated by the stronger narrow emission lines, at =3.876 (see Polletta et al. 2008a)., and at the redshift derived from the optical rest-frame lines for SW022513, =3.4270.002. At these redshifts, the =4-3 line is the only CO line (=461.0408 GHz) within the 3 mm atmospheric window. The =4-3 CO line was expected at a frequency of 94.6113 GHz, and 104.261 GHz, in SW022550, and SW022513, respectively.
Both sources were observed under conditions of reasonable atmospheric phase stability (seeing1.2′′–1.5′′) and transparency (pwv3–10 mm) with one track per source and using all six antennas for a total integration time of 5.3 hrs, and 8.9 hrs, for SW022550, and SW022513, respectively. The data reduction was carried out in two stages using the IRAM GILDAS software444http://www.iram.fr/IRAMFR/GILDAS. (Guilloteau & Lucas 2000). The raw data were calibrated using the clic package developed at IRAM. First, calibration anomalies owing to meteorological conditions or electronics were rejected. After calibration, the visibility data, i.e., tables, were generated using clic. Based on these tables, CO maps and spectra were extracted using the IRAM MAPPING software version 4 .
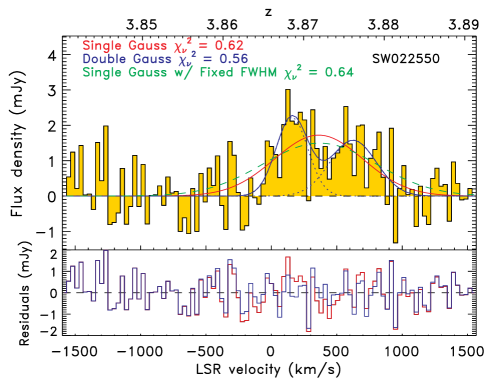
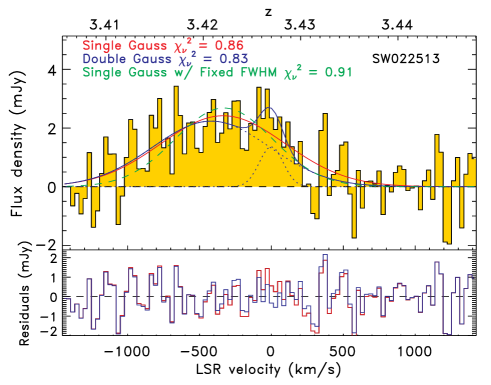
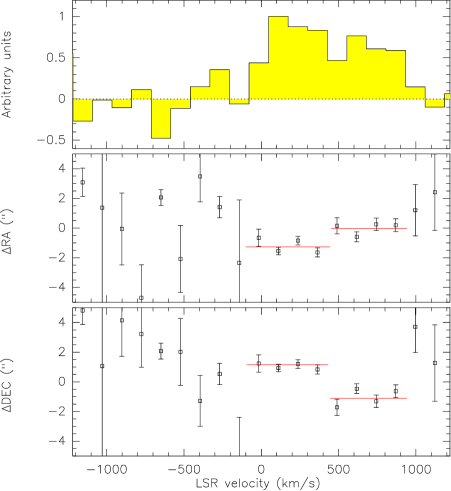
The synthesized, clean beam is elongated, roughly 8.4′′4.8′′ for SW022550, and 6.5′′4.3′′ for SW022513. Before producing the integrated CO emission-line maps, the data were rebinned by a factor of 4, i.e., from the initial channel width of 2.5 MHz to a width of 10 MHz. Our final, spectrally smoothed data cube for SW022550 has rms = 0.1 mJy beam-1 for a channel width of 32 km s-1. For SW022513, we reached rms = 0.17 mJy beam-1 for a channel width of 29 km s-1. Spectra extracted from the brightest pixel of each source are shown in Figure 1.
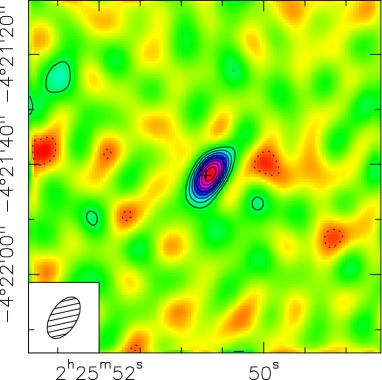
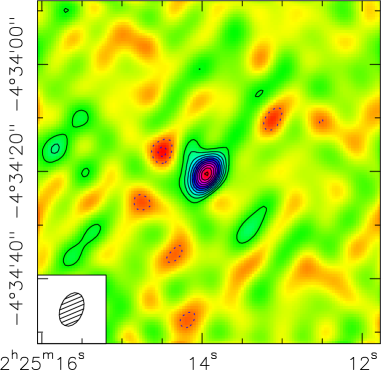
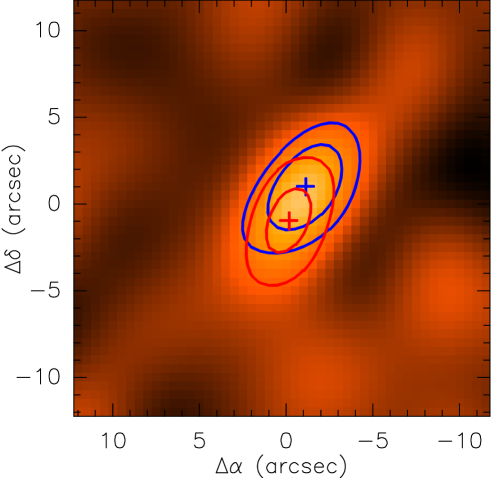
We also constructed CO emission line maps from these cubes by integrating over a velocity width ranging from 20 km s-1 to 870 km s-1 for SW022550, and from 980 km s-1 to 200 km s-1 for SW022513, both centered on the peak CO line emission. These maps are shown in Figure 2, where contours are plotted with 1 step size and the first CO contour starts at 2, and =0.13 Jy km s-1 beam-1 in SW022550, and =0.19 Jy km s-1 beam-1 in SW022513.
4 Molecular gas measurements
The CO-related measurements for our two selected sources are reported in Table 1 and described here.
4.1 CO line intensity
In both SW022550 and SW022513, strong CO lines are detected with integrated fluxes of ICO = 1.50.3 Jy km s-1, and 2.60.4 Jy km s-1, respectively. No continuum is detected in either source. The estimated 3 upper limits in the continuum maps of SW022550 and SW022513 are 0.3mJy/beam and 0.5mJy/beam, respectively. Both sources appear compact in our observations with beam size 4 ′′ corresponding to super-galactic scales, i.e., 30 kpc at =3.4. The estimated CO(4–3) luminosity, LCO, is derived from the line intensity ICO and the following equation (Solomon et al. 1997): LCO = 1.0410I, where is the line-observed frequency in GHz, and the luminosity distance in Mpc. The integrated CO luminosity, L, derived using the following equation: L = 3.2510I, is (5.71.0)1010 K km s-1 pc-2 in SW022550, and (8.31.2)1010 K km s-1 pc-2 in SW022513 (see Solomon et al. 1997, and Table 1).
Assuming an L/L ratio equal to unity, as observed in high- type I QSOs (Riechers et al. 2006; Weiß et al. 2007)555Note that the L/L ratio typically ranges from 0.65 to 1.73 with high- type I QSOs being characterized by values close to unity (Riechers et al. 2006; Weiß et al. 2007), and submillimeter galaxies by lower value (e.g. Hainline et al. 2006; Ivison et al. 2011; Harris et al. 2010; Frayer et al. 2011)., the total H2+He molecular gas mass can be estimated as Mgas = M(H2+He) = L, where is the CO luminosity to gas mass conversion factor. We adopt = 0.8 M⊙(K km s-1 pc2)-1, which has been estimated from local ultra-luminous infrared galaxies (ULIRGs; Solomon et al. 1997; Downes & Solomon 1998), and is commonly adopted for high-redshift ULIRGs (Solomon & Vanden Bout 2005; Tacconi et al. 2008; Bothwell et al. 2010; Yan et al. 2010). This value also includes a correction factor of 37% for helium. With these assumptions, the resulting total gas masses, including only the measurement errors and not the astrophysical uncertainties, are (4.50.8)1010 M⊙ for SW022550, and (6.70.9)1010 M⊙ for SW022513. Note that these molecular gas mass estimates are likely to be underestimated because the =4–3 transition might not trace the bulk of the molecular gas, and the estimates are probably uncertain by a factor of at least 2 (for a discussion on the hypothesis behind this assumption and possible uncertainties see Ivison et al. 2011). Table 1 lists the integrated CO line fluxes, velocity widths, and derived CO luminosities and gas (H2+He) masses.
4.2 CO line profiles
We investigate the gas kinematics of our sources by fitting the line profile with a single and a double Gaussian model, and use reduced- to estimate the goodness-of-fit for each model (see also Fig. 1). For SW022550 a double Gaussian fit yields the best fit, =0.56 compared to =0.62 with a single Gaussian. The widths of the two Gaussian components are consistent with each other and, indeed, a double Gaussian model with equal line widths yields lines with full-width-at-half maximum of 34060 km s-1 and an equally acceptable fit, with the same . For SW022513, fits with one and two components give an equally acceptable fit, 0.85, however, the best two-component fit in this case implies very different line widths, FWHM = 200150 km s-1 and FWHM = 950150 km s-1 for the narrow and broad component, respectively. The broad component is blueshifted by 420 km s-1 relative to the narrow component. Nesvadba et al. (2011b) find that the line can be equally well fit with a narrow and a broad component that have the same redshift and width as those found for the narrow and broad components of H, respectively. All fit results are listed in Table 1 and shown in Fig. 1. We rounded all results to multiples of 10 km s-1.
We emphasize that the profiles of SW022513 and SW022550 are significantly different. When fitting SW022513 with a single Gaussian as broad as in SW022550 (and vice versa), the worsens (see annotations in Fig. 1). We tried the same exercise for the two-component fit with fixed widths, but this fit did not converge for SW022550, and produced a very bad result for SW022513 (not shown in Fig. 1). In addition, a Kolmogorov-Smirnov (KS) test rejects the hypothesis that both spectra are similar at 98% confidence. Before applying this test, we shifted the spectra to the central wavelength of the single Gaussian fit (corresponding to shifts of 364 km s-1 and +336 km s-1 for SW022550 and SW022513, respectively), selected the velocity range covered by the lines in both galaxies (1000 km s-1 to +1190 km s-1) and resampled the spectra to have the same spectral binning. All fits and associated are reported in Fig. 1.
Based on these tests, we conclude that the line profiles of SW022550 and SW022513 are significantly different, suggesting that the molecular gas in these galaxies could be in different dynamical states, in spite of their similar SEDs and MIR/FIR luminosities.
4.2.1 Are the line profiles in our sources typical?
Double-horned profiles, as in SW022550, are often found in merging galaxies, for example submillimeter galaxies (e.g. Frayer et al. 1998; Neri et al. 2003; Tacconi et al. 2006; Bothwell et al. 2010), and may either signalize a rotating disk or a merger of two reservoirs of molecular gas (e.g., Neri et al. 2003; Taniguchi & Shioya 1998; Sakamoto et al. 1999; Narayanan et al. 2006; Downes & Solomon 1998; Evans et al. 1999). However, double-peaked profiles with FWHM300 km s-1 per peak are rarely observed.
Lines with FWHM1000 km s-1, similar to SW022513 are also rare, and are often double-peaked (like in 4C41.17 at =3.8; De Breuck et al. 2005, and in SMMJ02399-0136; Genzel et al. 2003). Papadopoulos et al. (2000) report a line with FWHM=1000 km s-1 in 4C60.07, which is not associated with the radio galaxy, but with an infalling satellite galaxy (see also Ivison et al. 2008). Coppin et al. (2008) report a CO line with FWHM=1090 km s-1 in the BAL QSO RX 124913.86-05906.2 at =2.247, which appears to have a profile not very different from ours, but at lower signal-to-noise ratio, making the width measurement more uncertain. Thus, the CO line widths of our sources are not unique, but nonetheless uncommon among high- galaxies with bright CO line emission.
To examine whether similar CO line profiles are also observed in other obscured AGNs, and because no systematic CO studies have been carried out for this class of objects, we have searched the literature for other CO-detected obscured AGNs at high- and collected their main CO properties. The vast majority of CO-detected sources at high redshift are classified as SMGs, type I QSOs, ULIRGs, or radio galaxies, even if in a few cases they host an obscured AGN. We collected all CO-detected sources that, to our knowledge, exhibit properties typical of obscured AGNs, like narrow high ionization emission lines in their optical spectrum, or absorption in the X-rays. We also require that the selected sources are ULIRGs (L(FIR)1012 L⊙) and not radio-loud objects. We found eight sources that satisfy these criteria. Because it is not always clear whether a source contains an obscured AGN, our compilation is not complete. Note that in case of COSMOS J100038+020822, the optical spectrum is typical of a broad line AGN, but we include this source in our compilation because its spectral energy distribution and X-ray spectrum indicate that the source suffers heavy obscuration.
The list of the eight CO-detected obscured AGNs found in the literature and their main CO properties (i.e., line width, offset from the systemic redshift) are reported in Table 2. In Table 2 we also report their mean values (without including our selected sources), and, for reasons of practicality, we recall the same quantities for our two selected targets.
| Object | CO | Offset | FWHM(CO) | Mgas | SFR | SFEa𝑎aa𝑎aSFE is the star-formation efficiency, in units of L⊙/(K km s-1 pc2). | Ref.b𝑏bb𝑏b(1): Sajina et al. (2008); Yan et al. (2010), (2): Aravena et al. (2008), (3) Solomon & Vanden Bout (2005), (4) Martínez-Sansigre et al. (2009), (5) Genzel et al. (2003); Iono et al. (2009); Frayer et al. (1998). | ||
| trans. | km s-1 | km s-1 | 1010M⊙ | M⊙/yr | |||||
| SW022550 | 3.876 | (4–3) | 3.8719 | 460, 10 | 29090, 420180 | 4.53 | 500–3000 | 35–194 | … |
| SW022513 | 3.427 | (4–3) | 3.4220 | 340 | 1020110 | 6.66 | 500–3000 | 24–108 | … |
| MIPS 8342 | 1.562 | (2–1) | 1.5619 | 12 | 13440, 14440c𝑐cc𝑐cFWHM of each component of a double-peaked CO line. A single Gaussian fit yields FWHM = 325 km s-1. | 1.79 | 610 | 60 | (1) |
| J100038 | 1.8288 | (4–3) | 1.8269 | 200 | 42773 | 3.6–5.4 | 1700 | 325 | (2) |
| MIPS 15949 | 2.122 | (3–2) | 2.1194 | 250 | 500117 | 2.18 | 1370 | 97 | (1) |
| IRAS F10214 | 2.2856 | (4–3) | 2.2854 | 18 | 24528 | 0.6 | 540 | 719 | (3) |
| MIPS 16059 | 2.326 | (3–2) | 2.3256 | 36 | 47154 | 1.41 | 1280 | 211 | (1) |
| MIPS 8327 | 2.441 | (3–2) | 2.4421 | 96 | 25350 | 1.02 | 1170 | 231 | (1) |
| AMS 12 | 2.767 | (3–2) | 2.7668 | 16 | 275 | 1.9 | 4470 | 1047 | (4) |
| SMM J02399 | 2.803 | (3–2) | 2.8076 | 520, +230 | 220, 220d𝑑dd𝑑dThe velocity offsets and FWHMs refer to the two peaks of a double-horned CO line. The velocity offsets are given with respect to =2.808 (Frayer et al. 1998). The full line covers 1100 km s-1 in wavelength. | 6.0 | 500 | 90 | (5) |
| Meane𝑒ee𝑒eMean values and average deviation from the mean obtained from the eight sources from the literature. | 2.270.32 | … | 2.270.32 | 7394 | 450180 | 2.41.4 | 1455815 | 347268 | … |
The obscured AGN redshifts range from 1.6 to 2.8 and the CO lines refer to the = (2–1), (3–2), or (4–3) transitions. In case multiple transitions were available, we considered the one closest to =(4–3). Two out of these eight sources show a double-horned CO profile. The line widths, based on single Gaussian fits, range from 245 to 1100 km s-1, similar to the range observed in SMGs and type 1 QSOs, i.e., 200–1000 km s-1.
Previous studies of the line profiles of CO bright sources at high-, i.e., SMGs and type I QSOs, indicate that their CO lines are characterized by similar widths (FWHM=550180 km s-1 in QSOs, and FWHM=530110 km s-1 in SMGs; Coppin et al. 2008; Wang et al. 2010), but double-peaked profiles are more common among SMGs than among type I QSOs. This difference is attributed to a closer alignment of the gas plane with the line-of-sight in SMGs than in QSOs. The mean CO line width in the selected sample of eight obscured AGNs is 450180 km s-1 (540260 km s-1 including our two sources), consistent with the mean CO line width observed in SMGs and type 1 QSOs (Coppin et al. 2008). Thus, the CO line widths are all consistent among these three main classes of high- galaxies, but in terms of line profile, our sources are more similar to SMGs than to type I QSOs.
Velocity offsets from the systemic redshift, assumed to be the optical redshift, are common and range from about 500 km s-1 to +100 km s-1. Blueshifted CO lines are observed in the vast majority of sources, and in three out of eight sources the velocity offset reaches a few hundreds of km s-1 like in our sources.
Although the widths of the CO lines in SW022550 and in SW022513 are not unique among the sources from the literature, they are among the largest ever observed. Interestingly, the largest CO lines are only observed in sources that also contain a powerful AGN, suggesting that the AGN might play a major role in broadening the CO line. The hypothesis that the AGN might be responsible for the CO line width, at least in SW022513, will be discussed in more detail in § 5.2.
4.3 Are the sources spatially resolved?
Our data have beam sizes of 4′′ (corresponding to 30 kpc at =3.4), larger than typical galactic scales. Nonetheless, in SW022550, we may have found a small spatial offset between the red and the blue Gaussian component of about 1′′ and 2′′ in right-ascension and declination, respectively (Fig. 3). We estimated this offset from channel maps extracted from the blue and red peak of the line extracted from a cube with a channel width of 40 MHz (130 km s-1). The peak emission and relative positions of the red and blue components are shown in the integrated map in Figure 4.
With our beam size, 8.4′′4.8′′, and SNR7 for each peak (corresponding to a total SNR10), the relative positional accuracy of our data is 0.6′′0.3′′ in right ascension and declination, respectively777The 1 positional accuracy is the size of the synthesized beam in right ascension or declination divided by twice the SNR, i.e., 1 in RA is 8.4′′/(27)=0.60 ′′, and 1 in Dec is 4.8′′/(27)=0.34 ′′.. Thus, the offset is marginally significant at a 2-level along right ascension, and is significant at 6-level along declination. This suggests that the molecular gas in SW022550 may extend over 2.20.7′′ (165 kpc). Since we cannot distinguish if the gas is in two spatially separate or in one single, extended component, we cannot differentiate between the disk and the (two components) merger hypothesis. This would require observations at higher spatial resolution. Extended molecular disks with sizes of 10 kpc have been already observed, e.g., in the low-redshift galaxy 3C 293 (Evans et al. 1999) and in the 1.5 SMG Lockman 38 (Bothwell et al. 2010). Interestingly, extended molecular disks at low redshift are often associated with (advanced) mergers (Downes & Solomon 1998; Evans et al. 1999), but several cases of extended disks in non-mergers are also known, especially at high-redshift (Tacconi et al. 2010; Daddi et al. 2010).
We currently have no evidence for multiple components in our multi-band imaging at shorter wavelengths, however, this does not necessarily rule out a merger of two separate galaxies. Our highest-resolution data (1′′) are at wavelengths 1 m where obscuration might be important, and where the galaxy could be outshone by the AGN. Optical and near-infrared continuum observations at high- can also be more difficult than line detections because the cosmological surface-brightness dimming is a stronger function of redshift for continuum than for line emission ( compared to ). It is also possible that the gas is intrinsically more extended than the continuum.
Fitting a circular Gaussian to the CO(4-3) velocity integrated visibilities of SW022513 gives a 3 upper limit on the size of 2.4′′ (18 kpc at =3.4). The continuum morphology at optical and near-infrared wavelengths is compact, but SW022513 has a narrow-line region seen with VLT/SINFONI that extends over 2.5′′1.6′′ (Nesvadba et al. 2011b), consistent with our upper limit. SW022513 is also resolved at 1.4 GHz with a size of 4.1′′1.8′′ (Bondi et al. 2003), larger than our upper limit.
4.4 Dynamical masses
A common assumption made in studies of the CO line emission of high-redshift galaxies is that the molecular gas is virialized and rotating in the large-scale gravitational field of the galaxy, in particular when the line profile is double-horned. Recent observations of the submillimeter galaxy SMM J2131-0102 (Danielson et al. 2010), suggest however, that the CO kinematics of dusty starburst at high redshift can be significantly more complex than that. Owing to the strong magnification by a gravitational lens, it has been possible to observe three kinematically separate components in this galaxy, with brightness in each component depending on the observed transition. This may suggest that the CO kinematics of dusty starbursts at high redshift are significantly more complex than they may appear at the generally low signal-to-noise ratios that can be achieved for galaxies that are not strongly lensed. This suspicion may be particularly appropriate for our targets, where observations at different (and observationally less challenging) wavebands suggest a great level of kinematic complexity (Nesvadba et al. 2011b), and may hint at a non-gravitational origin of the CO kinematics, at least in the case of SW022513. We will discuss these alternative interpretations in § 5. Irrespective of these concerns, here we adopt the more traditional interpretation that the CO line profiles are dominated by gravity, and that the gas is virialized. Since dynamical mass estimates depend on the system geometry, we assume that the gas is virialized (but see Ivison et al. 2008) and consider two cases, the gas distributed in a rotating disk, or associated with two merging galaxies. The estimated dynamical masses, M and M, are reported in Table 1.
For a rotating disc, the dynamical mass M is derived following Neri et al. (2003), as M = 2.33 10V [M⊙], where is the inclination of the putative disk with respect to the plane of the sky, V is the difference in velocity between the two peaks in the CO profile, or, in case of a single peak, the observed FWHM in km s-1divided by 2.4, and is the disk radius in kpc. We use the velocity offset between the two peaks in SW022550, V = 460 km s-1 and FWHM/2.4 1020/2.4 42550 km s-1 in SW022513. For SW022550 we adopt as radius half of the positional offset between the two CO line peaks, i.e., =82.5 kpc. Because the CO is unresolved in our maps, we consider a range of fiducial values for for SW022513, corresponding to the lowest and highest values measured in similar sources at high-. Disk sizes typically range from 0.5 to 5 kpc in QSOs (Carilli et al. 2003; Walter et al. 2004; Weiß et al. 2007; Aravena et al. 2008; Riechers et al. 2008, 2009b) and from 2 to 8 kpc in submillimeter galaxies (Neri et al. 2003; Greve et al. 2005; Tacconi et al. 2006, 2008; Swinbank et al. 2010; Carilli et al. 2010; Ivison et al. 2011). Thus, we consider a range of values between 0.5 and 8 kpc for the radius in SW022513. With these assumptions, the estimated dynamical mass in a disk, M, is (42)1011 sin M⊙ in SW022550, and ranges from (2.00.5) 1010 sin M⊙ to (348) 1010 sin M⊙ in SW022513.
An alternative explanation is a merger with highly disturbed gas kinematics driven by two gravitational potentials, each associated with a merging galaxy. In this scenario, and again following Neri et al. (2003), the dynamical mass can be derived as M=4.210FWHM2 [M⊙], where is the inclination of the plane defined by the two merging galaxies with respect to the plane of the sky, FWHM the full-width-at-half maximum of the CO line in km s-1, and half of the projected distance between the two galaxies in kpc. We adopt FWHM=800120 km s-1 for SW022550, and 1020110 km s-1 for SW022513, and assume that the distance is 82.5 kpc in SW022550, and (2–8) kpc in SW022513. In this case, we find dynamical masses that are consistent with those obtained in case of a disk, i.e., M=(21) 1011 sin M⊙ for SW022550, and a range of M going from (92) 1010 sin M⊙ to (358) 1010 sin M⊙ for SW022513.
In both scenarios, the largest disk radii or merger separation yield dynamical masses that correspond to the upper end of the mass function at high redshift (Seymour et al. 2007). Furthermore, they would be even higher if the systems were less inclined (90∘). This implies that our sources might be among the most massive galaxies at their epoch, and low inclinations are disfavored, unless the molecular gas is less extended than assumed.
5 Discussion
In this section, we analyze the CO emission line luminosities and profiles to determine what governs the gas dynamics. We will also compare the molecular gas properties of our targets with those of other CO-detected sources at high redshift. This comparison will be discussed in light of the postulated evolutionary scenario that links SMGs and QSOs (e.g. Sanders et al. 1988; Granato et al. 2006; Di Matteo et al. 2005).
5.1 Gas dynamics
The most plausible scenarios that might explain the observed CO kinematics (see § 4.1) are a rotating disk, a galaxy merger, or an outflow. Interpreting the gas dynamics of high- galaxies is very challenging if we exclusively rely on CO observations. We therefore include additional constraints from our multi-wavelength data sets to investigate which hypothesis is overall astrophysically most plausible.
We argued in § 4.2 that the CO line profiles of SW022550 and SW022513 are significantly different in spite of their similar gas masses and FIR/MIR luminosities. The CO line profile in SW022550 is characterized by two relatively symmetric peaks, each being narrower than the velocity offset of v=46090 km s-1 between them. SW022550 has a classical double-horned profile, which may either indicate a merger or a rotating disk; at any rate, gas kinematics driven by gravity. The spatial offset (165 kpc, see § 4.3) between the red and the blue peak further suggests that the gas could be in a moderately to highly inclined disk that extends over galactic scales or beyond. In this case, the circular velocity, vc230 km s-1, would be consistent with those of massive, extended stellar disks at low redshift like the Milky Way and place SW022550 amongst massive high-redshift galaxies, Mdyn=(42) M⊙, without implying an unusually large mass.
A highly inclined disk could also explain the obscuration seen at optical wavelengths. Evidence for obscuration from dust in the host galaxy (rather than, or in addition, to a circumnuclear torus) has been found in several AGN, including obscured QSOs at high redshift (Keel 1980; Lawrence & Elvis 1982; Rigby et al. 2006; Ogle et al. 2006; Martínez-Sansigre et al. 2006; Brand et al. 2007; Sajina et al. 2007; Polletta et al. 2008b). This scenario agrees with the standard idea that in obscured QSOs absorbing dust and gas intersect the line of sight.
The disk hypothesis is attractive, but not necessarily unique. Apart from mergers, double-peaked profiles can also be produced by gas plumes produced in interacting galaxies or clouds and filaments in dense large-scale structures (see e.g., the radio galaxies 4C 60.07 and TXS0828+193; Papadopoulos et al. 2000; Ivison et al. 2008; Nesvadba et al. 2009; Tacconi et al. 2008). However, these configurations appear to be rare and have only been identified in individual, unusual cases.
Our VLT/SINFONI imaging spectroscopy shows that gravity is not the sole driver of the overall ISM kinematics in SW022550. The [O III] 4959 profile is much broader than the CO profile, FWHM=2200180 km s-1, with a single identifiable peak. Such broad line profiles are commonly interpreted as gas stirred up and accelerated by the AGN in the inner narrow-line region (e.g., Komossa et al. 2008). This line probes warm ionized gas that is highly excited, but low in mass, unlike the CO lines. Thus, since the molecular gas is apparently less perturbed than the ionized gas, the AGN most likely does not affect the bulk of the ISM in SW022550. This conclusion holds irrespective of whether the molecular gas is in a disk or driven by a merger.
The situation is different in SW022513. The CO line profile is very broad and can either be fitted with a single or a double set of Gaussian profiles. However, unlike the double-peaked profile of SW022550, the two-component fit to SW022513 is very asymmetric, with a narrow (FWHM=200150 km s-1) line to the red (=3.42700.0007), and a much broader (FWHM=950150 km s-1) component blueshifted by 420100 km s-1 (=3.42080.0013) relative to the narrow one. The width of the broad component is consistent with that obtained by a single-component fit (FWHM=1020110 km s-1). In addition, the CO line profile is well matched by the profile of the H line in the VLT/SINFONI data cube (the line includes a narrow component at =3.42470.001 with FWHM(H)=37040 km s-1, and a broad one at =3.4220.001 with FWHM(H)=100070 km s-1; Nesvadba et al. 2011b, see their Figure 7) with the sole exception that the line core of the narrow H component is more prominent relative to the broad H component compared to the two CO components. Line widths and redshifts are consistent for CO and H within the uncertainties.
Unlike SW022550, SW022513 does not have a clear signature of a large-scale velocity gradient. It is unresolved in the CO map with a 3 size limit of 2.4′′, suggesting that the molecular gas distribution could be more compact or as extended as the ionized gas resolved with VLT/SINFONI. We also do not find a symmetric double-peaked profile as for SW022550. This suggests that the molecular gas in SW022513, if it is in a rotating disk, would most likely be seen nearly face-on. In this case, the line width would not be dominated by the large-scale velocity gradient, but by motion along the disk normal, i.e., turbulent motion within the disk. Likewise, to explain this profile with a blend of two lines from a merging galaxy pair, we would need to postulate a very specific geometry, where the two galaxies are nearly aligned with the line of sight, and have very similar line cores, otherwise the profile would be double-peaked. Both hypotheses require significant fine-tuning, and are therefore, although fundamentally possible, not very satisfactory. We are not aware of any example in the literature where a similar line profile was found in either a merger or a disk.
An alternative interpretation, motivated by the similarity between the kinematics of molecular and ionized gas and recent discoveries of molecular outflows in several nearby AGN and starburst galaxies (Sakamoto et al. 2006; Iono et al. 2009; Fischer et al. 2010; Feruglio et al. 2010; Chung et al. 2011; Alatalo et al. 2011) is that the broad molecular component could be from gas that is being stirred up and accelerated by the AGN (see also Nesvadba et al. 2011b). This is also supported by N-body/SPH models of massive galaxy mergers, which demonstrate that line widths with FWHM1000 km s-1 can only be produced through AGN winds (Narayanan et al. 2008). We will further investigate this hypothesis in the next section.
5.2 A molecular wind as a signature of AGN feedback?
It has been known for more than two decades that AGN and intensely star-forming galaxies can drive outflows of warm ionized and neutral gas (e.g., van Breugel et al. 1984; Heckman et al. 1990), but it has only recently been recognized that these winds can also have a molecular component (e.g., Iono et al. 2007). Consequently, much of what we know about these winds comes from observations of optical line emission of warm ionized gas and radio observations of neutral hydrogen. A prime signature of these winds are broad, blueshifted wings in the integrated spectra of HI absorption lines and emission lines of ionized gas (e.g., Crenshaw et al. 1999; Kraemer et al. 2005; Morganti et al. 2003; Nesvadba et al. 2006; Alexander et al. 2010). Comparison with stellar absorption lines for many types of AGN show that the narrow components of these lines are fairly good approximations to the systemic velocity and stellar velocity dispersion in all but very radio-loud AGN (Nelson & Whittle 1996; Sulentic et al. 2000; Greene & Ho 2005; Crenshaw et al. 2010). In galaxies where both HI and HII lines have been observed, the line profiles were found to match each other well (e.g., Emonts et al. 2005; Holt et al. 2008). Matched profiles of HI and CO have been found in NGC1266, which shows clear evidence for an AGN-driven molecular wind (Alatalo et al. 2011).
Interpreted in light of this long legacy of optical observations, the profiles of lines of ionized gas in SW022513 are a clear signature of gas that is being stirred up and accelerated by the AGN, and which could be outflowing (see Nesvadba et al. 2011b, for details). The detection of matching CO and HII line profiles and the analogy with NGC 1266 illustrate that this wind may well have a molecular component.
Interestingly, LVG modeling of the CO(1-0) to CO(3-2) line ratios of NGC1266 suggests that the CO emission in the wing of NGC1266 is optically thin, akin to what Papadopoulos et al. (2008, 2010) previously found in 3C293 at =0.04, another prime and relatively nearby example of an AGN-driven wind. The gas becomes optically thin because CO molecules have a large range of relative velocities, and consequently do not emit at strictly the same wavelength. Given the immense width of the CO line in SW022513, we suspect the same could be true here. Assuming that the gas conditions are broadly similar to those in NGC1266 (which is not implausible if both are dominated by the same basic astrophysical mechanism), we may overestimate the molecular gas mass in the wing. We have requested multi-transition CO observations of SW022513 to further investigate this question.
In this scenario, the CO emission could trace gas that is part of a turbulent multiphase medium created by interactions between AGN and ISM, similar to what is found in nearby radio galaxies (Nesvadba et al. 2010; Ogle et al. 2010). In these environments, the molecular, atomic, and ionized gas may be undergoing a permanent mass and energy exchange, explaining very naturally why line profiles are very similar. Molecular gas may even form in the stirred-up, turbulent, post-shock gas (Guillard et al. 2009). This would circumvent the difficulties of accelerating dense molecular gas with AGN-driven winds (e.g., Sutherland & Bicknell 2007).
NGC1266 may qualitatively be a good analog of SW022513, but quantitatively it is not. The CO FWHM in SW022513 is much greater (1000 km s-1 compared to 350 km s-1), and the relative CO line flux in the broad component of SW022513 appears much higher than that in NGC1266, about 89% (Table 1) compared to 34% (Alatalo et al. 2011). This could have a number of reasons. First, the relative CO emissivity in the narrow and broad components could be different in the two sources. In SW022513 we observe CO(4-3), not CO(3-2), and would expect that this line is more strongly boosted for optically thin relative to optically thick gas. Second, while both studies suggest the outflow is driven by the mechanical (radio) AGN luminosity, the mechanical energy injection rate in SW022513 is 30 times higher than in NGC1266 (i.e.; 21044 ; Nesvadba et al. 2011b 61042 ; Alatalo et al. 2011). Both authors explicitly show that the AGN provides sufficient energy to power the wind. Third, the covering fraction of gas intercepted by the AGN may be greater in SW022513 than in NGC1266, because the galaxy is richer in gas, or simply because of geometry.
A key question of AGN feedback in the context of galaxy evolution is: Will the wind escape? Adopting the redshift of the narrow components of molecular and ionized gas as the systemic redshift, we find that molecular line emission extends to relative velocities on the order of 1000 km s-1 from systemic. Here we adopt the redshift corresponding to the bluest channels where CO is detected with flux densities 1 mJy to estimate the terminal velocity. Terminal velocities are commonly adopted in wind studies (e.g., Heckman et al. 2000) to estimate the intrinsic outflow velocity, irrespective of projection and other effects, which would only lower the observed relative to the intrinsic velocity. This terminal velocity is on the order of the escape velocities typically estimated for massive galaxies (i.e., 900 km s-1; Vanzella et al. 2010), suggesting that at least a fraction of this gas could potentially escape.
5.3 Star-formation efficiency
The star-formation efficiency (SFE), defined as the SFR per unit of star-forming gas, i.e., SFR/M(H2), can be derived from observables (assuming the L(FIR)-SFR correlation) in terms of the continuum-to-CO line luminosity ratio L(FIR)/L. The CO luminosity provides a measure of gas mass (Solomon et al. 1987), and the FIR luminosity of the SFR (Kennicutt 1998). The L(FIR)/L ratio thus indicates the efficiency with which the gas is converted into stars (a spatially integrated version of the Schmidt-Kennicutt star-formation law; Schmidt 1959; Kennicutt 1998). The FIR luminosity, L(FIR), is derived as (0.560.01)L(IR) (Polletta et al. 2008a), where L(IR) is the luminosity in the wavelength range 8–1000 m, and L(FIR) the luminosity in the 40–120 m range. The estimated values for SW022550, and SW022513 are, respectively, (2–11)1012 L⊙, and (2–9)1012 L⊙ (Polletta et al. 2008a).
Previous studies find that the SFE increases with L(FIR), implying that star formation is more efficient in ultra luminous systems, like submillimeter galaxies, than in normal starforming galaxies (Greve et al. 2005; Daddi et al. 2010). Powerful systems at high redshift, like SMGs, QSOs, radio galaxies (RGs), and ULIRGs, exhibit average SFE values ranging from about 200 to 400 L⊙/(K km s-1 pc2) (Greve et al. 2005; Solomon & Vanden Bout 2005; Tacconi et al. 2008; Coppin et al. 2008; Aravena et al. 2008, see Iono et al. 2009 and Riechers 2011 for a recent compilation and comparison). An order of magnitude lower SFEs are instead observed in local spirals (Leroy et al. 2009) and gas rich massive disk galaxies at 1.5, i.e. BzKs (Daddi et al. 2010).
The range of SFE values derived for SW022550 and SW022513 are, respectively, 35-194, and 24–108 L⊙/(K km s-1 pc2) (see Table 1). The SFEs in our sources and in several types of sources from the literature are shown in Figure 5. The sources from the literature include type I QSOs, obscured AGNs (see §4.2.1), RGs, SMGs, 2 and local ULIRGs, and LIRGs and BzK galaxies (Solomon & Vanden Bout 2005; Coppin et al. 2008; Aravena et al. 2008; Greve et al. 2005; Tacconi et al. 2008; Yan et al. 2010; Bothwell et al. 2010; Solomon et al. 1997; Iono et al. 2009; Daddi et al. 2010). We also show, as reference, the relationships between SFE and L(FIR) derived from ULIRGs and SMGs (Greve et al. 2005), and from local spirals and BzK galaxies888Note that the SFE values reported for the BzK galaxies and the relation from SFE and L(FIR) have been modified to be consistent with the other values from the literature and with our estimates. In particular, we derived the FIR luminosity from the SFR using the relationship L(FIR) = 0.56L(IR) = 0.565.8109SFR (Kennicutt 1998; Polletta et al. 2008a). Note that this correction factor reduces their SFEs by a factor equal to 0.32. In Daddi et al. (2010), the mean SFE for BzKs is 8412 L⊙/(K km s-1 pc2), about three times higher than reported in Figure 5. (Daddi et al. 2010).
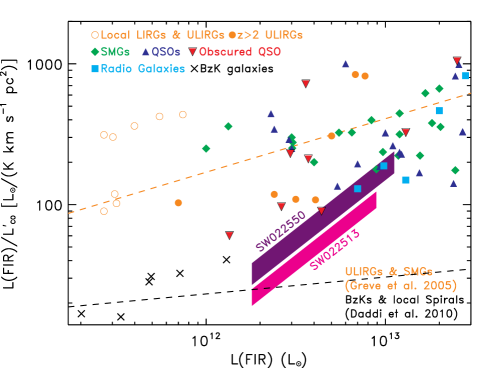
Our sources are among the powerful high-redshift systems with the lowest SFEs, i.e., the highest estimates for our sources overlap with the lowest third (200 L⊙/(K km s-1 pc2); Solomon & Vanden Bout 2005) observed in other powerful systems. With respect to the relation of ULIRGs and SMG (Log(L = (0.620.06)Log(L(FIR)+2.330.93; Greve et al. 2005) our sources’ SFEs are about 1 lower.
To investigate whether low SFEs are common among obscured AGNs, we examine the SFEs of the eight CO-detected obscured AGNs described in § 4.2.1 and listed in Table 2. Their gas masses and SFRs are consistent with those observed in SMGs and type I QSOs. Note that exceptionally low, by up to two orders of magnitude, gas masses and SFRs are observed in IRAS F10214+4724. Because this source is magnified by a lensing object, it was possible to detect it in CO even if it is intrinsically weaker than those commonly detected with current facilities. The estimated SFEs in obscured AGNs, also shown in Fig. 5, cover a broad range, from 60 to 1000 L⊙/(K km s-1 pc2), similar to that observed in the other classes shown in Figure 5. Interestingly, of all sources shown in Figure 5, those with the lowest SFEs are obscured QSOs (see also Table 2), in particular three sources have SFEs below 100 L⊙/(K km s-1 pc2). On the other hand, obscured QSOs are also among the sources with the highest SFEs in Figure 5. The obscured QSO sample is too small and incomplete to be representative of the obscured AGN class. However, this analysis indicates that this class can exhibit a wide range of SFEs, consistent with those observed in other types of ULIRGs at high-.
The relatively low SFEs in our sources and in some obscured AGNs disfavor the hypothesis that the AGN might enhance star-formation activity by compressing and cooling the molecular gas as suggested by some models (Begelman & Cioffi 1989; Silk 2005; Silk & Norman 2009). If there were AGN-driven positive feedback, the SFE in our sources would be higher compared to starburst galaxies, e.g., SMGs, contrary to what is observed. The lower SFEs instead point to a star-formation triggering mechanism that is less efficient than what operates in sources with large SFEs. Thus, even if large amounts of molecular gas are available, only a relatively small fraction is converted into stars. Alternatively, their star formation might be shutting down, perhaps as a consequence of the turbulence in the molecular gas, and this might be a sign of AGN negative feedback, at least in SW022513.
5.4 Evolutionary phase
Many current evolutionary models postulate that high- powerful starburst galaxies, obscured QSOs, and type I QSOs represent subsequent phases of a system following a major merger (e.g., Hopkins et al. 2005). In order to assess whether our sources follow this scheme, and, in such a case, which phase they might represent, we estimate their molecular gas-to-stellar mass ratio (Mgas/Mstellar), and black hole-to-stellar mass ratio (MBH/Mstellar) and compare them with those measured in submillimeter galaxies and type I QSOs. A morphological analysis would also be useful to locate our systems on this evolutionary sequence, but the spatial resolution of the available images is not sufficient to carry it out. Moreover, the host light may be diluted by the AGN at most wavelengths, or highly extincted by dust.
Assuming the estimated stellar mass and associated uncertainty (see Table 1; Polletta et al. 2008a), the gas fractions, defined as the Mgas/Mstellar ratio, are 8–36% in SW022550, and 21–41% in SW022513, or 6–29% and 17–33%, respectively, assuming = 0.8 M⊙(K km s-1 pc2)-1 (see 4.1). Note that these estimates have large systematic uncertainties because they are based on CO(4-3) observations, and approximate stellar masses. We may either miss a diffuse component, which could make these fractions factors of 2 higher, or, alternatively, the CO line emission may be optically thin and/or partially powered by shocks and/or X-rays, which could lower the gas mass by up to factors of a few (Meijerink 2006; Meijerink et al. 2007; Flower & Pineau Des Forêts 2010). These fractions are consistent with the wide range of gas fractions estimated in SMGs (i.e. 5–30%; Tacconi et al. 2008), and lower than in high- disk galaxies (30–50%; Daddi et al. 2010)999Note that the factor derived for high- disk galaxies by Daddi et al. (2010) is 3.6, compared to 0.8 which is commonly assumed for ULIRGs and adopted for SW022550, and SW022513.. Thus, our targets are as gas-rich as SMGs. The lack of stellar mass estimates for type I QSOs and other obscured QSOs does not allow us to estimate the gas fraction for these types of sources. In the literature, the gas fraction in high- systems, like SMGs and type I QSOs, is usually computed as the ratio between the gas and the dynamical mass, but because the latter is highly uncertain owing the unknown system geometry, we preferred to consider only the gas and stellar masses for this comparison.
Another indication of the evolutionary stage is provided by the comparison between the BH and stellar mass. As has been argued recently by a number of authors (Di Matteo et al. 2008; Alexander et al. 2008; Coppin et al. 2008; Nesvadba et al. 2011a; Sarria et al. 2010), the position of a high-redshift galaxy on the BH-bulge mass relationship can be used to infer whether it is in an early or advanced evolutionary stage. Lower limits to the BH masses of our sources, obtained assuming that they are radiating at the Eddington limit, are 7.4108 M⊙, and 3.7108 M⊙, for SW022550 and SW022513, respectively (Polletta et al. 2008a). A more robust (virial) BH mass estimate can be obtained for SW022550 from the width of the C IV 1549 line and the optical luminosity. Namely, we base our estimate on the BH mass estimator of Vestergaard & Peterson (2006), Log(MBH)= Log[FWHM (Lλ,44)0.53]+6.66, where the FWHM3 is the C IV 1549 FWHM in units of 103 km s-1, and Lλ,44 is the luminosity at 1350Å in units of 1044 . This relationship is valid for type I QSOs, whereas SW022550 is obscured. Because obscuration does not permit a direct measurement of the AGN UV luminosity, we derive the AGN luminosity at 1350Å indirectly from the bolometric AGN luminosity, using the bolometric correction of Elvis et al. (1994), Lbol/LUV6101010We note that the bolometric luminosity is the quantity that black-hole mass scales with intrinsically, and is approximated by the monochromatic UV luminosity for mere practical reasons.
The estimated AGN bolometric luminosity is 1047 (Polletta et al. 2008a), which corresponds to a luminosity of 1.61046 at 1350Å. The C IV 1549 line width, FWHM(C IV 1549)(3690100) km s-1 (Polletta et al. 2008a), implies MBH = (9.20.5)108 M⊙, consistent with the estimate in Polletta et al. (2008a). Because a BH with such a mass corresponds to an Eddington luminosity of 1.21047 , this estimate implies that SW022550 is radiating at 85% of the Eddington-limit.
Assuming a BH mass of 9108 M⊙ for SW022550, and 4108 M⊙ for SW022513, the MBH/Mstar ratios of our sources are 0.001–0.006 for SW022550 and 0.001–0.002 for SW022513. These are consistent with the local relationship (MBH/Mbulge0.0014; Häring & Rix 2004; Marconi & Hunt 2003), and also with the ratios measured in type I QSOs (0.0070.003; Peng et al. 2006), but larger than those estimated in SMGs (0.0001–0.0008; Alexander et al. 2008). Several recent models of galaxy evolution postulate that only relatively evolved supermassive black holes may be able to affect their surrounding gas (Churazov et al. 2005; Merloni & Heinz 2008; Fanidakis et al. 2011). As argued by, e.g., Coppin et al. (2008); Alexander et al. (2008); Nesvadba et al. (2011a), this would imply that the AGN and their host galaxies would approach the local black-hole bulge scaling relationship near the end of their active growth period. For many high-redshift quasars, this seems not to be the case (e.g., Walter et al. 2004; Peng et al. 2006), perhaps indicating that they have not yet reached this stage. On the other hand, the position of our sources on the local MBH–Mstar relationship suggests that both stellar and black hole growth might have reached the end of their most active phase, and that our sources are thus at a more advanced evolutionary stage with respect to type I QSOs and SMGs. This could be a consequence of AGN feedback if a sufficiently large fraction of the gas is heated and blown out of the galaxy. This result is consistent with the idea, suggested by their low star-formation efficiency (see § 5.3), that our sources, and perhaps other obscured AGNs with low SFEs, might be on the verge of turning off.
6 Summary and conclusions
We presented the properties of the molecular gas and the possible role of powerful AGN activity on this gas in two highly luminous obscured QSOs at 3.4.
Our study was based on observations of the CO(4–3) line carried out with the PdBI. The luminosity and profile of the CO line indicate that both systems contain large amounts of molecular gas (Mgas41010 M⊙) corresponding to 30% of their stellar mass. The CO lines are among the broadest CO lines ever observed (800–1000 km s-1). A double-peaked line is observed in SW022550, and a blueshifted broad profile in SW022513. Various scenarios were discussed to explain the observed line profiles and gas kinematics: a rotating disk, a merger, and an AGN-driven outflow.
The CO properties in SW022550 indicate that the molecular gas might be distributed in a highly inclined, almost edge-on, rotating disk or be associated with a merger. The CO emission appears extended on scales of 16 kpc, consistent with both scenarios. The disk inclination is constrained by the presence of two peaks in the line profile and by the high estimates of rotational velocities and dynamical masses. A merger can also explain the CO line kinematics, even if there is no evidence of multiple sources in the available optical and infrared images. A comparison with the rest-frame optical spectrum of the source (Nesvadba et al. 2011b) suggests that the molecular gas is not significantly affected by the presence of the AGN.
For SW022513, the disk and merger hypotheses seem less convincing. Based on an analysis of the rest-frame optical line emission in SW022513, we suspect that parts of the molecular gas could be stirred up by the AGN and perhaps be part of an AGN-driven outflow. This is further supported by a detailed comparison with NGC1266, the clearest example of an AGN-driven molecular wind in a nearby galaxy. In this scenario, most of the line flux would be produced in a very turbulent and potentially outflowing wind component. The wind hypothesis would very naturally explain the similarity of the CO and H line profiles.
A comparison of our objects’ molecular gas properties with those of other powerful high-redshifts systems, i.e., submillimeter galaxies, type I QSOs, RGs, and 2 ULIRGs, shows that they are characterized by relatively lower star-formation efficiencies, defined as the L(FIR)/L luminosity ratio. Similarly low SFEs are also found in other obscured AGNs from the literature, but they are not typical of this class of objects. Another difference between our sources and SMGs and type I QSOs it is that they already seem to lie near the local BH-bulge mass relation. These results suggest that our sources, and perhaps other obscured QSOs, might be near the end of their most active growing phase and on the verge of turning off and transitioning into passively evolving massive galaxies. Their low star-formation efficiencies might be due to the perturbation caused by the AGN on the molecular gas.
Our observations indicate that the AGN plays a major role in perturbing the molecular gas in SW022513. This source might thus provide a laboratory to test and constrain evolution models and to study the formation of massive galaxies at critical early epochs. It could also be used as reference to search for similar sources and carry out more targeted searches for molecular gas outflows.
Acknowledgements.
We thank the referee for a careful reading of the manuscript and helpful comments and suggestions that improved both the content and the clarity of the paper. MP is grateful to the Institut d’Astrophysique de Paris for its hospitality during her visit there. NPHN wishes to thank P. Papadopoulos and M. D. Lehnert for interesting discussions about various aspects of this work. This work is based on observations carried out with the IRAM Plateau de Bure Interferometer. IRAM is supported by INSU/CNRS (France), MPG (Germany) and IGN (Spain). We thank the staff of the IRAM Observatory for their support of this program. MP acknowledges financial contribution from contract ASI-INAF I/016/07/0.References
- Alatalo et al. (2011) Alatalo, K., Blitz, L., Young, L. M., et al. 2011, ApJ, accepted, arXiv:1104.2326
- Alexander et al. (2008) Alexander, D. M., Brandt, W. N., Smail, I., et al. 2008, AJ, 135, 1968
- Alexander et al. (2010) Alexander, D. M., Swinbank, A. M., Smail, I., McDermid, R., & Nesvadba, N. P. H. 2010, MNRAS, 402, 2211
- Aravena et al. (2008) Aravena, M., Bertoldi, F., Schinnerer, E., et al. 2008, A&A, 491, 173
- Beelen et al. (2004) Beelen, A., Cox, P., Pety, J., et al. 2004, A&A, 423, 441
- Begelman & Cioffi (1989) Begelman, M. C. & Cioffi, D. F. 1989, ApJ, 345, L21
- Bondi et al. (2003) Bondi, M., Ciliegi, P., Zamorani, G., et al. 2003, A&A, 403, 857
- Bothwell et al. (2010) Bothwell, M. S., Chapman, S. C., Tacconi, L., et al. 2010, MNRAS, 405, 219
- Brand et al. (2007) Brand, K., Dey, A., Desai, V., et al. 2007, ApJ, 663, 204
- Carilli et al. (2010) Carilli, C. L., Daddi, E., Riechers, D., et al. 2010, ApJ, 714, 1407
- Carilli et al. (2003) Carilli, C. L., Lewis, G. F., Djorgovski, S. G., et al. 2003, Science, 300, 773
- Carilli & Wang (2006) Carilli, C. L. & Wang, R. 2006, AJ, 131, 2763
- Chiappetti et al. (2005) Chiappetti, L., Tajer, M., Trinchieri, G., et al. 2005, A&A, 439, 413
- Chung et al. (2011) Chung, A., Yun, M. S., Naraynan, G., Heyer, M., & Erickson, N. R. 2011, ApJ, 732, L15
- Churazov et al. (2005) Churazov, E., Sazonov, S., Sunyaev, R., et al. 2005, MNRAS, 363, L91
- Coppin et al. (2008) Coppin, K. E. K., Swinbank, A. M., Neri, R., et al. 2008, MNRAS, 389, 45
- Crenshaw et al. (1999) Crenshaw, D. M., Kraemer, S. B., Boggess, A., et al. 1999, ApJ, 516, 750
- Crenshaw et al. (2010) Crenshaw, D. M., Schmitt, H. R., Kraemer, S. B., Mushotzky, R. F., & Dunn, J. P. 2010, ApJ, 708, 419
- Daddi et al. (2010) Daddi, E., Bournaud, F., Walter, F., et al. 2010, ApJ, 713, 686
- Daddi et al. (2008) Daddi, E., Dannerbauer, H., Elbaz, D., et al. 2008, ApJ, 673, L21
- Danielson et al. (2010) Danielson, A. L. R., Swinbank, A. M., Smail, I., et al. 2010, MNRAS, 1565
- Dasyra et al. (2008) Dasyra, K. M., Yan, L., Helou, G., et al. 2008, ApJ, 680, 232
- De Breuck et al. (2005) De Breuck, C., Downes, D., Neri, R., et al. 2005, A&A, 430, L1
- Di Matteo et al. (2008) Di Matteo, T., Colberg, J., Springel, V., Hernquist, L., & Sijacki, D. 2008, ApJ, 676, 33
- Di Matteo et al. (2005) Di Matteo, T., Springel, V., & Hernquist, L. 2005, Nature, 433, 604
- Downes & Solomon (1998) Downes, D. & Solomon, P. M. 1998, ApJ, 507, 615
- Dye et al. (2006) Dye, S., Warren, S. J., Hambly, N. C., et al. 2006, MNRAS, 372, 1227
- Elvis et al. (1994) Elvis, M., Wilkes, B. J., McDowell, J. C., et al. 1994, ApJS, 95, 1
- Emonts et al. (2005) Emonts, B. H. C., Morganti, R., Tadhunter, C. N., et al. 2005, MNRAS, 362, 931
- Evans et al. (1999) Evans, A. S., Sanders, D. B., Surace, J. A., & Mazzarella, J. M. 1999, ApJ, 511, 730
- Fanidakis et al. (2011) Fanidakis, N., Baugh, C. M., Benson, A. J., et al. 2011, MNRAS, 410, 53
- Feruglio et al. (2010) Feruglio, C., Maiolino, R., Piconcelli, E., et al. 2010, A&A, 518, 155
- Fischer et al. (2010) Fischer, J., Sturm, E., González-Alfonso, E., et al. 2010, A&A, 518, L41
- Flower & Pineau Des Forêts (2010) Flower, D. R. & Pineau Des Forêts, G. 2010, MNRAS, 406, 1745
- Frayer et al. (2011) Frayer, D. T., Harris, A. I., Baker, A. J., et al. 2011, ApJ, 726, L22
- Frayer et al. (1998) Frayer, D. T., Ivison, R. J., Scoville, N. Z., et al. 1998, ApJ, 506, L7
- Genzel et al. (2003) Genzel, R., Baker, A. J., Tacconi, L. J., et al. 2003, ApJ, 584, 633
- Genzel et al. (2010) Genzel, R., Tacconi, L. J., Gracia-Carpio, J., et al. 2010, MNRAS, 407, 2091
- Granato et al. (2004) Granato, G. L., De Zotti, G., Silva, L., Bressan, A., & Danese, L. 2004, ApJ, 600, 580
- Granato et al. (2006) Granato, G. L., Silva, L., Lapi, A., et al. 2006, MNRAS, 368, L72
- Granato et al. (2001) Granato, G. L., Silva, L., Monaco, P., et al. 2001, MNRAS, 324, 757
- Greene & Ho (2005) Greene, J. E. & Ho, L. C. 2005, ApJ, 627, 721
- Greve et al. (2005) Greve, T. R., Bertoldi, F., Smail, I., et al. 2005, MNRAS, 359, 1165
- Guillard et al. (2009) Guillard, P., Boulanger, F., Pineau Des Forêts, G., & Appleton, P. N. 2009, A&A, 502, 515
- Guilloteau & Lucas (2000) Guilloteau, S. & Lucas, R. 2000, in Astronomical Society of the Pacific Conference Series, Vol. 217, Imaging at Radio through Submillimeter Wavelengths, ed. J. G. Mangum & S. J. E. Radford, 299
- Hainline et al. (2006) Hainline, L. J., Blain, A. W., Greve, T. R., et al. 2006, ApJ, 650, 614
- Häring & Rix (2004) Häring, N. & Rix, H. 2004, ApJ, 604, L89
- Harris et al. (2010) Harris, A. I., Baker, A. J., Zonak, S. G., et al. 2010, ApJ, 723, 1139
- Heckman et al. (1990) Heckman, T. M., Armus, L., & Miley, G. K. 1990, ApJS, 74, 833
- Heckman et al. (2000) Heckman, T. M., Lehnert, M. D., Strickland, D. K., & Armus, L. 2000, ApJS, 129, 493
- Holt et al. (2008) Holt, J., Tadhunter, C. N., & Morganti, R. 2008, MNRAS, 387, 639
- Hopkins et al. (2005) Hopkins, P. F., Hernquist, L., Cox, T. J., et al. 2005, ApJ, 630, 705
- Hopkins et al. (2006) Hopkins, P. F., Hernquist, L., Cox, T. J., et al. 2006, ApJS, 163, 1
- Iono et al. (2007) Iono, D., Wilson, C. D., Takakuwa, S., et al. 2007, ApJ, 659, 283
- Iono et al. (2009) Iono, D., Wilson, C. D., Yun, M. S., et al. 2009, ApJ, 695, 1537
- Ivison et al. (2008) Ivison, R. J., Morrison, G. E., Biggs, A. D., et al. 2008, MNRAS, 390, 1117
- Ivison et al. (2011) Ivison, R. J., Papadopoulos, P. P., Smail, I., et al. 2011, MNRAS, 412, 1913
- Keel (1980) Keel, W. C. 1980, AJ, 85, 198
- Kennicutt (1998) Kennicutt, Jr., R. C. 1998, ARA&A, 36, 189
- Komossa et al. (2008) Komossa, S., Xu, D., Zhou, H., Storchi-Bergmann, T., & Binette, L. 2008, ApJ, 680, 926
- Kraemer et al. (2005) Kraemer, S. B., George, I. M., Crenshaw, D. M., et al. 2005, ApJ, 633, 693
- Lawrence & Elvis (1982) Lawrence, A. & Elvis, M. 1982, ApJ, 256, 410
- Lawrence et al. (2007) Lawrence, A., Warren, S. J., Almaini, O., et al. 2007, MNRAS, 379, 1599
- Leroy et al. (2009) Leroy, A. K., Walter, F., Bigiel, F., et al. 2009, AJ, 137, 4670
- Lonsdale et al. (2003) Lonsdale, C. J., Smith, H. E., Rowan-Robinson, M., et al. 2003, PASP, 115, 897
- Lutz et al. (2005) Lutz, D., Yan, L., Armus, L., et al. 2005, ApJ, 632, L13
- Maiolino et al. (2007) Maiolino, R., Shemmer, O., Imanishi, M., et al. 2007, A&A, 468, 979
- Marconi & Hunt (2003) Marconi, A. & Hunt, L. K. 2003, ApJ, 589, L21
- Martínez-Sansigre et al. (2009) Martínez-Sansigre, A., Karim, A., Schinnerer, E., et al. 2009, ApJ, 706, 184
- Martínez-Sansigre et al. (2006) Martínez-Sansigre, A., Rawlings, S., Lacy, M., et al. 2006, MNRAS, 370, 1479
- Meijerink (2006) Meijerink, R. 2006, PhD thesis, Leiden Observatory
- Meijerink et al. (2007) Meijerink, R., Spaans, M., & Israel, F. P. 2007, A&A, 461, 793
- Merloni & Heinz (2008) Merloni, A. & Heinz, S. 2008, MNRAS, 388, 1011
- Morganti et al. (2003) Morganti, R., Oosterloo, T. A., Emonts, B. H. C., van der Hulst, J. M., & Tadhunter, C. N. 2003, ApJ, 593, L69
- Narayanan et al. (2009) Narayanan, D., Cox, T. J., Hayward, C. C., Younger, J. D., & Hernquist, L. 2009, MNRAS, 400, 1919
- Narayanan et al. (2008) Narayanan, D., Cox, T. J., Kelly, B., et al. 2008, ApJS, 176, 331
- Narayanan et al. (2006) Narayanan, D., Cox, T. J., Robertson, B., et al. 2006, ApJ, 642, L107
- Nelson & Whittle (1996) Nelson, C. H. & Whittle, M. 1996, ApJ, 465, 96
- Neri et al. (2003) Neri, R., Genzel, R., Ivison, R. J., et al. 2003, ApJ, 597, L113
- Nesvadba et al. (2010) Nesvadba, N. P. H., Boulanger, F., Salomé, P., et al. 2010, A&A, 521, 65
- Nesvadba et al. (2011a) Nesvadba, N. P. H., De Breuck, C., Lehnert, M. D., et al. 2011a, A&A, 525, 43
- Nesvadba et al. (2006) Nesvadba, N. P. H., Lehnert, M. D., Eisenhauer, F., et al. 2006, ApJ, 650, 693
- Nesvadba et al. (2009) Nesvadba, N. P. H., Neri, R., De Breuck, C., et al. 2009, MNRAS, 395, L16
- Nesvadba et al. (2011b) Nesvadba, N. P. H., Polletta, M., Lehnert, M., Omont, A., & Bergeron, J. 2011b, MNRAS, in press
- Ogle et al. (2010) Ogle, P., Boulanger, F., Guillard, P., et al. 2010, ApJ, 724, 1193
- Ogle et al. (2006) Ogle, P. M., Whysong, D., & Antonucci, R. 2006, Astronomische Nachrichten, 327, 241
- Omont et al. (1996) Omont, A., Petitjean, P., Guilloteau, S., et al. 1996, Nature, 382, 428
- Papadopoulos et al. (2008) Papadopoulos, P. P., Kovacs, A., Evans, A. S., & Barthel, P. 2008, A&A, 491, 483
- Papadopoulos et al. (2000) Papadopoulos, P. P., Röttgering, H. J. A., van der Werf, P. P., et al. 2000, ApJ, 528, 626
- Papadopoulos et al. (2010) Papadopoulos, P. P., van der Werf, P., Isaak, K., & Xilouris, E. M. 2010, ApJ, 715, 775
- Peng et al. (2006) Peng, C. Y., Impey, C. D., Rix, H.-W., et al. 2006, ApJ, 649, 616
- Polletta et al. (2008a) Polletta, M., Omont, A., Berta, S., et al. 2008a, A&A, 492, 81
- Polletta et al. (2009) Polletta, M., Omont, A., Lonsdale, C., & Shupe, D. 2009, in AFN Feedback in Galaxy Formation. Edited by Antonuccio-Delogu, V. ; Silk, J. Proceedings of the INAF-Oxford-COSMOCT Workshop ”The Interface between Galaxy Formation and AGNs”, Cambridge Contemporary Astrophysics, Cambridge University Press, Presented at the Workshop ”The Interface between Galaxy Formation and AGNs”
- Polletta et al. (2008b) Polletta, M., Weedman, D., Hönig, S., et al. 2008b, ApJ, 675, 960
- Riechers (2011) Riechers, D. A. 2011, ApJ, 730, 108
- Riechers et al. (2009a) Riechers, D. A., Walter, F., Bertoldi, F., et al. 2009a, ApJ, 703, 1338
- Riechers et al. (2008) Riechers, D. A., Walter, F., Brewer, B. J., et al. 2008, ApJ, 686, 851
- Riechers et al. (2006) Riechers, D. A., Walter, F., Carilli, C. L., et al. 2006, ApJ, 650, 604
- Riechers et al. (2009b) Riechers, D. A., Walter, F., Carilli, C. L., & Lewis, G. F. 2009b, ApJ, 690, 463
- Rigby et al. (2006) Rigby, J. R., Rieke, G. H., Donley, J. L., Alonso-Herrero, A., & Pérez-González, P. G. 2006, ApJ, 645, 115
- Sajina et al. (2007) Sajina, A., Yan, L., Lacy, M., & Huynh, M. 2007, ApJ, 667, L17
- Sajina et al. (2008) Sajina, A., Yan, L., Lutz, D., et al. 2008, ApJ, 683, 659
- Sakamoto et al. (2006) Sakamoto, K., Ho, P. T. P., & Peck, A. B. 2006, ApJ, 644, 862
- Sakamoto et al. (1999) Sakamoto, K., Okumura, S. K., Ishizuki, S., & Scoville, N. Z. 1999, ApJS, 124, 403
- Sanders et al. (1988) Sanders, D. B., Soifer, B. T., Elias, J. H., Neugebauer, G., & Matthews, K. 1988, ApJ, 328, L35
- Sarria et al. (2010) Sarria, J. E., Maiolino, R., La Franca, F., et al. 2010, A&A, 522, L3
- Schinnerer et al. (2008) Schinnerer, E., Carilli, C. L., Capak, P., et al. 2008, ApJ, 689, L5
- Schmidt (1959) Schmidt, M. 1959, ApJ, 129, 243
- Seymour et al. (2007) Seymour, N., Stern, D., De Breuck, C., et al. 2007, ApJS, 171, 353
- Silk (2005) Silk, J. 2005, MNRAS, 364, 1337
- Silk & Norman (2009) Silk, J. & Norman, C. 2009, ApJ, 700, 262
- Solomon et al. (1997) Solomon, P. M., Downes, D., Radford, S. J. E., & Barrett, J. W. 1997, ApJ, 478, 144
- Solomon et al. (1987) Solomon, P. M., Rivolo, A. R., Barrett, J., & Yahil, A. 1987, ApJ, 319, 730
- Solomon & Vanden Bout (2005) Solomon, P. M. & Vanden Bout, P. A. 2005, ARA&A, 43, 677
- Spergel et al. (2003) Spergel, D. N., Verde, L., Peiris, H. V., et al. 2003, ApJS, 148, 175
- Sulentic et al. (2000) Sulentic, J. W., Marziani, P., & Dultzin-Hacyan, D. 2000, ARA&A, 38, 521
- Sutherland & Bicknell (2007) Sutherland, R. S. & Bicknell, G. V. 2007, ApJS, 173, 37
- Swinbank et al. (2010) Swinbank, A. M., Smail, I., Chapman, S. C., et al. 2010, MNRAS, 405, 234
- Tacconi et al. (2010) Tacconi, L. J., Genzel, R., Neri, R., et al. 2010, Nature, 463, 781
- Tacconi et al. (2008) Tacconi, L. J., Genzel, R., Smail, I., et al. 2008, ApJ, 680, 246
- Tacconi et al. (2006) Tacconi, L. J., Neri, R., Chapman, S. C., et al. 2006, ApJ, 640, 228
- Taniguchi & Shioya (1998) Taniguchi, Y. & Shioya, Y. 1998, ApJ, 501, L167
- van Breugel et al. (1984) van Breugel, W., Heckman, T., Butcher, H., & Miley, G. 1984, ApJ, 277, 82
- Vanzella et al. (2010) Vanzella, E., Grazian, A., Hayes, M., et al. 2010, A&A, 513, 20
- Vestergaard & Peterson (2006) Vestergaard, M. & Peterson, B. M. 2006, ApJ, 641, 689
- Walter et al. (2004) Walter, F., Carilli, C., Bertoldi, F., et al. 2004, ApJ, 615, L17
- Wang et al. (2010) Wang, R., Carilli, C. L., Neri, R., et al. 2010, ApJ, 714, 699
- Weiß et al. (2007) Weiß, A., Downes, D., Neri, R., et al. 2007, A&A, 467, 955
- Weiß et al. (2005) Weiß, A., Downes, D., Walter, F., & Henkel, C. 2005, A&A, 440, L45
- Werner et al. (2004) Werner, M. W., Roellig, T. L., Low, F. J., et al. 2004, ApJS, 154, 1
- Yan et al. (2010) Yan, L., Tacconi, L. J., Fiolet, N., et al. 2010, ApJ, 714, 100