Efficient Deterministic Replay Using Complete Race Detection
Abstract
Data races can significantly affect the executions of multi-threaded programs. Hence, one has to recur the results of data races to deterministically replay a multi-threaded program. However, data races are concealed in enormous number of memory operations in a program. Due to the difficulty of accurately identifying data races, previous multi-threaded deterministic record/replay schemes for commodity multi-processor system give up to record data races directly. Consequently, they either record all shared memory operations, which brings remarkable slowdown to the production run, or record the synchronization only, which introduces significant efforts to replay.
Inspired by the advances in data race detection, we propose an efficient software-only deterministic replay scheme for commodity multi-processor systems, which is named RacX. The key insight of RacX is as follows: although it is NP-hard to accurately identify the existence of data races between a pair of memory operations, we can find out all potential data races in a multi-threaded program, in which the false positives can be reduced to a small amount with our automatic false positive reduction techniques. As a result, RacX can efficiently monitor all potential data races to deterministically replay a multi-threaded program.
To evaluate RacX, we have carried out experiments over a number of well-known multi-threaded programs from SPLASH-2 benchmark suite and large-scale commercial programs. RacX can precisely recur production runs of these programs with value determinism. Averagely, RacX causes only about 1.21%, 1.89%, 2.20%, and 8.41% slowdown to the original run during recording (for 2-, 4-, 8- and 16-thread programs, respectively). The soundness, efficiency, scalability, and portability of RacX well demonstrate its superiority.
1 Introduction
Due to the importance of determinism, deterministic replay has been widely employed in many areas, including debugging [23, 47], fault tolerance [7], intrusion detection [12], workload capture [35], performance prediction [53], and so on. Briefly speaking, a deterministic record/replay scheme records the non-deterministic events in the production run as logs, and uses the recorded logs to force the replay run recurring the behavior of the production run.
For uni-processor systems, the non-deterministic events mainly include the I/O inputs (e.g., keyboard, network, and files, etc.) and interrupts, which are uncertain in value or timing. These external non-deterministic events can be handled with relatively low overheads [12, 20]. As a result, deterministic replay scheme for uni-processor systems has been a mature technique, and it has already been accepted by industry [19].
For multi-processor systems, there are two additional types of non-deterministic events which may break the determinism: synchronization and data races111The concrete definition of data race can be found in [1]: There is data race between a pair of conflicting memory operations (we say that two memory operations conflict if they access the same memory location and at least one of them is a write) in a program, if there is a sequentially consistent execution (i.e., a program-ordered interleaving of operations of the individual threads) of the program, in which these two memory operations occur next to each other.. The common wisdom so far is that synchronization can be handled easily for deterministic replay schemes [43], while data races are intractable. Hence, programmers are still crying out for a practical deterministic record/replay scheme for commodity multi-processor systems.
Interestingly, the intractability of data race does not come from the amount of data races. In fact, the number of data race is quite few in real-world multi-threaded programs since most memory operations have been well ordered by synchronization [31]. The trouble is that data races are concealed in enormous number of memory operations, while it is NP-hard to identify whether there exists data race between a pair of memory operations [36]. The difficulty in accurately identifying data race makes researchers giving up to directly record/replay data races. Some deterministic replay schemes would rather to record/replay all memory operations to guarantee that each data race behaves the same in the production run and the replay run. So far, these schemes bring remarkable slowdown to the production run, e.g., - in PinPlay [40] and - in SMP-ReVirt [13]. Some other deterministic replay schemes do not record any memory operation at all (yet they still record all synchronization orders) to reduce the slowdown to the production run. However, these schemes either need tedious efforts to infer the behaviors of all memory operations, which may consume more than x of the program execution time [2], or repeatedly replay the program (or program section) until the output of a replay run happen to be identical with of the production run, while the replay times may be exponential with respect to the number of data races in the program (or program section) [39, 27]. Due to the inefficiency in either record or replay, few deterministic replay scheme for commodity multi-processor system has been widely accepted by industry.
In this paper, we propose an efficient deterministic replay scheme for commodity multi-processor systems, which is named RacX. The key insight of RacX is inspired by recent advances in the investigations of data race detection: although it is NP-hard to accurately identify whether there is data race between a pair of memory operations, it is not hard to find out all real data races in a multi-threaded program with some false positives. Thus, we can trace the order of all the potential data races (including real races and false positives) and synchronization to deterministically replay multi-threaded programs.
Concretely, RacX employs a compile time data race detector Analyzer, which utilizes Relay [50] as the basic infrastructure, to statically identify all the potential data races in multi-threaded programs. The Analyzer incorporates a series of automatic false positive reduction techniques proposed in this paper, which can resolve the false positives caused by unlocked initialization and false sharing on array. Hence, the potential races reported by Analyzer include all real data races and a small amount of false positives, which involve quite few memory operations. As a result, RacX can use static instrumentation to track the orders of all the potential data races and synchronization to efficiently replay multi-threaded programs with high fidelity.
We evaluate RacX over several well-known multi-threaded benchmarks, such as SPLASH-2, Apache, desktop applications and so on. These programs cover different application fields with various scales. All of these programs can be faithfully replayed by RacX on a commodity 16-core Linux server. Averagely, RacX causes only about 1.44%, 2.53%, 3.07%, and 4.61% slowdown to the original run when running in the recording mode for 2-, 4-, 8- and 16- thread programs respectively.
In general, the superiority of RacX, which is the first deterministic replay scheme based on complete data race detection, can be well demonstrated by its soundness, efficiency, scalability, and portability:
-
•
Soundness: RacX implements instrumentation to all real data races and synchronization, which can fully determine the logical behavior of a multi-threaded program execution. Therefore, RacX provides the value determinism that is more faithful than the output determinism provided by many state-of-the-art deterministic replay schemes
-
•
Efficiency: Benefited by the false positive elimination techniques, RacX only needs to monitor a small portion of all the memory operations, thus causes the minimal production run slowdowns among a number of state-of-the-art deterministic replay schemes for commodity multi-processor systems. Furthermore, in RacX, it is no necessary to infer the behaviors of memory operations, or repeatedly replay to match a desirable replay run.
-
•
Scalability: RacX exhibits excellent scalability with respect to the program size and the number of threads, as evidenced by that it can handle commercial multi-threaded programs with nearly millions of lines of code and 16-thread programs.
- •
The rest of this paper proceeds as follows. Section 2 introduces the overall framework of RacX. Section 3 introduces the infrastructure of the complete data race detector employed by RacX. Section 4 and Section 5 introduce our automatic false positive reduction techniques in details, which are crucial for the efficiency of RacX. Section 6 introduces the implementations of the deterministic record/replay. Section 7 gives the experimental results over a number of representative multi-threaded benchmarks. Section 8 briefly reviews some related work. Finally, Section 9 concludes this paper.
2 Design Overview
In this section, we elaborate the overall framework of RacX. As shown in Figure 1, RacX is a compiler and runtime environment that can execute on a commodity multi-processor system. During the compile time, RacX employs a static data race detector Analyzer to identify all potential data races (including all real data races and false positives). Due to the lack of runtime information, state-of-the-art static data race detectors have to make conservative assumption on the source codes, which leads considerable false positives. Hence, we propose several false positive elimination techniques, which include initialization pruning and array cross-range checking, to filter performance-critical false positives. As a result, the potential data races in the final race report can be reduced to a quite small amount with respect to all memory operations in a multi-threaded program. Then, the Instrumentor inserts order-tracking codes to all potential data races and synchronization in the original program.
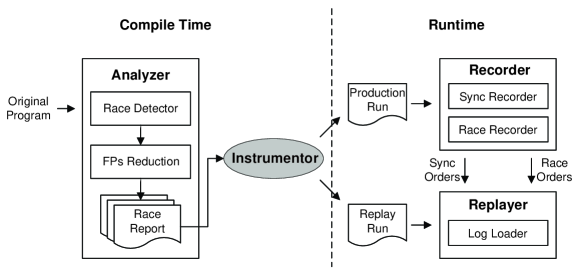
During runtime, the Recorder and the Replayer cooperate to deterministically record/replay the instrumented program. In the production run, the Recorder calls two sub-recorders to log the orders of synchronization operations and memory references involved in reported potential data races, respectively. According to the recorded orders in the logs, the Replayer can control the interleaving among different threads in the replay run with the help of the instrumented codes provided by the Instrumentor. By enforcing the identity of the synchronization orders and race orders in the production run and the record run, we can ensure to reproduce high-fidelity replica of the production run when needed.
In general, the Analyzer plays a key role in RacX, since it decides the efficiency and the soundness of RacX. In comparison with the Analyzer, the Instrumentor, the Recorder and the Replayer are relatively straightforward. Hence, we will introduce detail implementation of our Analyzer with the subsequent sections.
3 Complete Data Race Detection
As we have mentioned, the soundness of RacX depends heavily on the completeness of the Analyzer, since even the miss of one real data race may cause the replay run to exhibit different behavior with the production run. Hence, it is important to select an appropriate data race detection approach for the Analyzer. In general, there are two kinds of data race detection approaches, including dynamic approaches and static approaches. The dynamic approaches find data races in the executions of the program. They may neglect some real data races, but they have few (even no) false positive. The static approaches analyze the program at compile time. Most of them do not neglect any real data races, but they may have thousands of (even more) false positives. Since we must find out all real data races exhaustively for deterministic record/replay, the Analyzer employs static data race detector as its basic infrastructure.
On the other hand, the efficiency of RacX also depends on the accuracy of the Analyzer. Traditionally, static data race detectors have a lot of false positives. Apparently, the fewer false positives, the fewer memory operations to be instrumented, the fewer slowdowns to the original run in record and replay mode. Hence, we also manage to reduce the number of false positives of the Analyzer to improve the efficiency of RacX.
3.1 Relay Background
Several static data race detectors have been proposed in the last decade [16, 6, 14, 41, 34, 50]. Most of them are claimed to be able to find all real data races (with false positives) from the source code. In RacX, we consider to adopt a context- and flow-sensitive static data race detector, which is named Relay [50], as the basic infrastructure of our Analyzer, since Relay can scale to programs with millions of lines of code.
The core algorithm of many data race detectors (including Relay) is based on the lockset algorithm [45], i.e., it computes or monitors the set of locks imposed on each shared variable, and intersects the lock sets of different (potential) threads to determine race on each shared variable.
In comparison with other static lockset-based detectors, Relay has a better scalability with respect to the program size. The main reason is that Relay adopts a divide-and-conquer methodology, that is, it first analyzes the information of each function independent of its calling context, and then summarizes these information together to find potential data races. As a consequence, it can even deal with programs with millions of lines of code.
Technically, for each function, Relay computes the relative locksets and the guarded access sets. The relative lockset describes the intra-function changes of the lock ownerships from the function entry. It can be formulated as a disjoint pair of locksets (called positive and negative lockset, respectively), where is the set of additional locks that are acquired on all executions from the function entry to the given location, and the is the set of all locks that may have been released on some execution from the function entry to the given location. A guarded access corresponds to each lvalue in a program, and it also contains the corresponding relative lockset and the type (i.e., read or write) of the memory operation. For a function (the caller function) which calls other functions (the callee functions), Relay summarizes the relative locksets and the guarded access sets of all the callee functions to compute the relative locksets and the guarded access sets of the caller function. Through traversing the call graph of each thread in a bottom-up manner, the guarded access set of each memory operation in each thread can be computed, which can determine potential data race based on whether or not the corresponding positive lockset is empty.
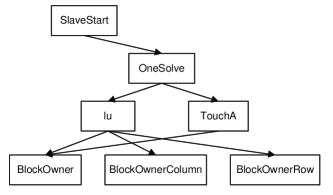
Figure 2 gives an illustrative example about the bottom-up manner process of Relay. At first, Relay computes the the relative sets and the guarded access sets of the functions on the leaves of the call graph, i.e., function BlockOwner, BlockOwnerColumn and BlockOwnerRow. Then, Relay summarizes the information of function BlockOwner, BlockOwnerColumn and BlockOwnerRow to compute the information of function lu and TouchA. Finally, after the computation reaches the thread entry as SlaveStart, Relay intersects the lockset of the guarded access of each memory operation to find out all potential races.
3.2 Race Warnings Reported by Relay
Although the effectiveness of Relay has been demonstrated by a Linux kernel 2.6 [50], here we still evaluate it on various application benchmarks, to discuss some issues about how to utilize its race warning report in RacX. The programs employed in the evaluation are as shown in Table 1, including apache, aget, pfscan, fft, lu, water-nsquared, and ocean. These programs cover different application fields (network, desktop, and scientific computing) and scales.
| Benchmark | Size(LoC) | Notes |
|---|---|---|
| apache | 230K | Network Application |
| aget | 2.5K | Network Application |
| pfscan | 1.0K | Desktop Application |
| fft | 1.1K | Scientific Computation |
| lu | 1.2K | Scientific Computation |
| water-nsqaured | 3.5K | Scientific Computation |
| ocean | 8.2K | Scientific Computation |
For these programs, the number of race warnings reported by Relay are shown in Table 2. Apparently, a race warning always involves many operations from different lines of code, which results in that the number of race warning pairs, i.e., two operations compete for accessing the same memory location, are much larger than the number of reported race warnings. Besides, Table 2 also gives the number of race warning sites, i.e., the lines of code where reported races may happen. From Table 2 we can find that the number of memory operations involved in the reported potential races of Relay is already very low compared with the number of all memory operations in the evaluated program.
However, instrumenting all of potential races reported by Relay can still be quite inefficient for deterministic replay. One of the most important reasons is the number of race warning instances, i.e., the occurrences of races in a concrete execution, can be extremely large when the corresponding memory location is frequently accessed for many times. It is very common that some race warnings lie in the hot-spot or critical path of the program. For example, a false positive on a shared array can occur millions of times for one execution of program lu, which dominates the total number of race warning instances. Instrumenting it will bring remarkable slowdown to the record run and the replay run. Therefore, to make RacX more practical, we should utilize some techniques to reduce the number of false positives, especially performance-critical ones, as much as possible without loss of any real data race.
| Benchmark | Race Warnings | Warning Pairs | Warning Sites |
|---|---|---|---|
| apache | 4739 | 273258 | 11590 |
| aget | 46 | 230 | 108 |
| pfscan | 20 | 93 | 67 |
| fft | 26 | 281 | 145 |
| lu | 16 | 104 | 88 |
| water-nsquared | 115 | 712 | 488 |
| ocean | 77 | 2678 | 1807 |
3.3 Analysis of False Positives
To find out potential solutions to prune false positives for more precise instrumentation, we analyze the reported potential races of evaluated programs. We find out that the main sources of false positives may lie in the following categories:
-
•
Unlikely aliasing: Due to the inherent limitation of static method, static data race detectors have to conservatively analyze pointer alias. In some extreme cases, a pointer is even assumed to be able to access any memory location. It would make the static detector falsely report race between two non-conflicting memory operations. Actually, many false positives in apache fall into this category due to the frequently employed function pointers.
-
•
Unlocked initialization: Shared variables can be initialized, e.g., by function malloc or resetting to an initial value, without obtaining a lock. Thus, intersecting the locksets of a shared variable during initialization with other accesses to this variable may cause issuing a potential race. This is an essential drawback of lockset-based analysis, and this kind of false positives is pervasive in all evaluated programs according to our analysis.
-
•
False sharing on array: Static data race detectors rely heavily on point-to analysis (PTA) to find out conflicting memory operations that access the same variable. However, it is a great challenge for static analysis to distinguish array elements with different subscripts. In fact, accessing to different array elements is typically treated as accessing to the same object as the start location of this array. For scientific computation programs which intensively employ array manipulations, such imprecise PTA may lead to a large number of false positive instances.
-
•
Self competence: To obtain potential races, lockset intersections are performed on each thread entry pairs without considering whether or not the thread can be spawned more than one time. For example, program aget may spawn only one helper thread signal_waiter (sw) to update the progress bar or handle the interrupt signal. However, the thread entry pair as is still statically analyzed assuming that two instances of sw can be executed simultaneously.
-
•
Happens-before relation: Happens-before relation [25] indicates that there exists a partial order between two events (i.e., two accesses to the same memory location). Once access happens-before access , no race occurs between these two accesses. Such a relation is often causes by signal/wait- or barrier-type synchronization, which cannot be properly handled by the lockset-based analysis. For example, the main thread often waits for the completion of the child threads, after that, statistic information about the entire execution may be printed by accessing shared variables without holding locks.
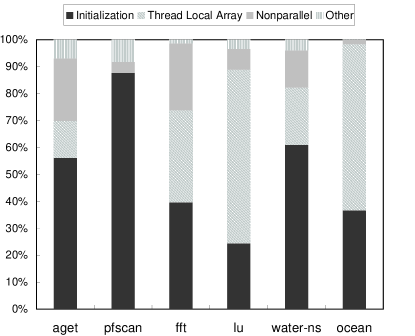
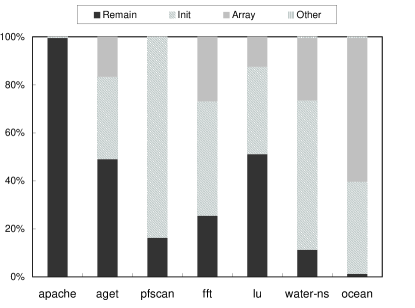
Actually, both self competence and happens-before relation can be summarized as non-parallel execution of corresponding (potential) threads. Thus, Figure 3 illustrates the distribution of different kinds of false positives, more specifically, unlocked initialization, false sharing on array, non-parallel execution and others, except for apache that at least 90% false positives are caused by unlikely aliasing. Not surprising, the distribution of false positive categories varies significantly among programs. We can clearly see that initialization is indeed very common for all evaluated programs. For scientific computation programs, different threads always access different parts of a global array without holding locks, which results in a large number of false sharing on array elements. For desktop application as program pfscan, false positives only stem from unlocked initialization and a small number of non-parallel execution. For network applications as program aget, in addition to some real data races that fall into the category of other, the number of false positives originated from non-parallel execution is also considerable.
Considering stated kinds of false positives, unlikely aliasing is the inherent characteristics of static analysis due to lack of runtime information. Thus, to ensure the completeness of race report, we cannot prune this kind of false positives. Besides, for the potential races caused by self competence, we cannot aggressively remove them, since the static detector is often impossible to know whether or not a thread is spawned for only one time without precise semantic analysis.
In this work, we especially focus on resolving the false positives caused by unlocked initialization and false sharing on array by some automatic techniques.
Handling Unlocked Initialization. Automatically identifying all initialization codes statically is intractable since it is not easy to know when initialization is complete. To reduce the number of false positive caused by unlocked initialization, we first identify simple yet common initialization pattern by a compiler pass. Besides, we consider to add locks on initialization code to avoid add instrumentation codes for every access to this shared variables. The basic intuition is that initialization always executes much more infrequently than the subsequence accesses. Thus, adding locks on the initialization bring trivial overheads compared with instrumenting all accesses. Section 4 elaborates the detail mechanism.
Handling False Sharing on Array. It is common that threads access different parts of a shared array without holding locks by dedicate partition algorithms in scientific computation. Actually, for scientific computation programs, the number of race warning instances caused by false sharing on array is extremely large, which indicates that executing corresponding instrumented codes dominates the total execution time. Thus, for these programs, these race warnings are performance-critical warnings that significantly impedes the performance of production run and replay run.
Fortunately, the accessed range of array from each thread is always determined by unique thread ID. Thus, once we can check the potential range a specific thread touched, and then intersect the ranges of different threads, we can determine whether or not they access common array elements. Once the constraint that there is no common array element accessed by threads with different thread ID is satisfied, we can eliminate the corresponding false positives. Section 5 introduces details of our symbolic array cross-range checking mechanism for achieving this goal.
4 Initialization Pruning
4.1 Initialization Identification
A common initialization pattern of multi-threaded program is as shown in Figure 4: After some initialization on shared variables, the main thread forks several child threads via creation primitives, e.g., pthread_create, to accomplish a task in parallel. Based on this observation, we manage to exclude potential data races between the child threads and the initialization code in the main thread which are always executed before forking child threads.
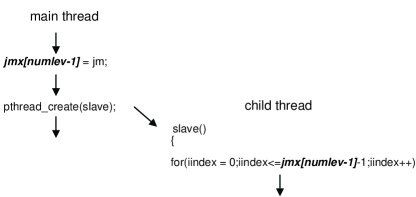
We utilize a compiler pass to automatically identify this initialization pattern in the source code. First, the function that calls thread creation functions are identified. Then, by iterating all statements of function , we can find the dominators222We say that a statement D is a dominator of another statement A if every execution path from the start to A must go through D. of the statement calling the thread creation function which spawns a child thread (denoted as ). Apparently, memory operations in these dominators will not contend with those in thread . Therefore, corresponding race warnings must be false positives. Although this initialization identification criterion is simple and conservative, it can avoid to instrument some “hot-spot” operations, thus can effectively reduce the instrumentation overhead for some scientific computation programs as demonstrated by our experiments in Section 7.
4.2 Locking Possible Initialization
Other than the pattern mentioned in the previous subsection, there are also many other ad hoc initialization patterns in practice. It is quite hard to statically identify all initialization code from the source codes. However, we observe that a potential race about initialization often involves only one unlocked operation about a shared variable and N other locked operations about the shared variable. Hence, for each potential race with only one unlocked operation, we add a lock on the unlocked operation to resolve the race warning, which can avoid to impose instrumentation codes to all of the operations involved in the race warning.
In fact, we cannot ensure that the only unlocked operation involved in a race warning is a real initialization. In other words, even real data races may also have this property (involving only one unlocked operation). That is the reason for why we call such unlocked operation as possible initialization. Fortunately, even for a real data race, adding lock on this possible initialization can still guarantee successful replay, since all operations involved in the race have been well guarded by synchronization operations, whose orders are also recorded by RacX.
5 Array Cross-Range Check
Due to the limitation of existing PTA and conservative property of static analysis, array objects are always treated as an entirety regardless of its concrete subscripts. Thus, for scientific computation programs with intensively accessing to shared arrays, many false positives would be reported by static detector. In this section, we introduce the symbolic array cross-range checking technique to handle this kind of false positives.
5.1 Basic Idea
In scientific computation, it is common that several threads access a shared array without holding locks since the algorithm guarantees each thread to access a specific array region without overlapping. Based on this observation, for a reported race warning about a shared array, we manage to analyze which range of array is accessed by each thread, and check whether there is a common range of array accessed by multi threads. The concrete flow of symbolic array cross-range checking includes three steps as follows:
In the first step, we conduct the intraprocedural range analysis on each function in a program, which produces the local range constraint for each program statement in the function. For example, the range constraint for a statement such as is . The intraprocedural range analysis can be implemented with Purdue’s compiler analysis tool as Cetus [9], which is a source-to-source compiler infrastructure for C programs.
The local range constraints produced by the intraprocedural range analysis are a series of expressions of local variables. To facilitate inter-thread analysis, the second step needs to produce the global range constraint, which associates the local variables in the range constraints with the expressions of the global variables and the variables in the thread entry function. Hence, we develop an in-home tool to implement the interprocedural range analysis, which can traverse the call graph (CG) from the entry function of each thread, and iteratively associate the local variables in the range constraints of callee function with the variables in the caller function and the global variables. After the whole traversal, the tool can output the set of global range constraints for all array accesses in each thread.
Based on the result of interprocedural range analysis, we can carry out the third step, which checks whether there is some element of a shared array accessed by multi threads with a given statement. We treat the checking problem as a constraint satisfaction problem (CSP) problem, and employ a complete CSP solver STP [17] to solve the CSP problem. A typical CSP problem consists of an objective expression and a set of constraints on the variables in the objective expression. In our checking problem, the objective expression aims at determining whether or not the array subscript expression in the statement with different thread identifiers can be satisfied to equal. Meanwhile, the set of constraints on variables in the objective expression can be obtained directly from the set of global range constraints produced by the interprocedural range analysis. If the objective expression is proven to be unsatisfiable under the constraints, there is no array element accessed by multi threads with the statement, which can eliminate the possibility that the statement has a data race with itself about the array.
5.2 An Illustrative Example
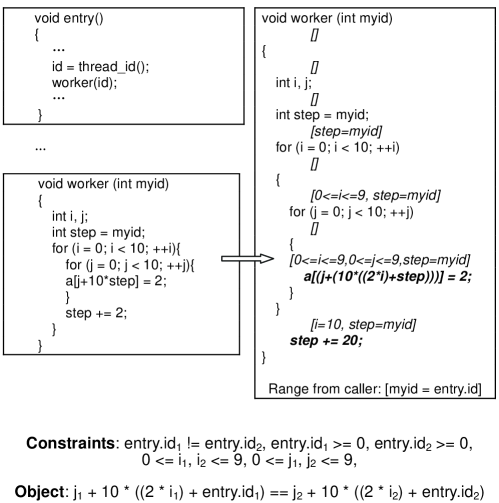
An illustrative example on how to conduct array cross-range checking is as shown in Figure 5. In a typical multi-threaded program, function entry is created as the entry point function for each thread. In each thread, function entry stores its own thread id in variable and calls function worker to accomplish computation on the shared array . Our aim is to determine whether some element of is accessed by multi threads.
As the first step, we perform the intraprocedural range analysis on function worker to obtain the local range constraints for each statement. These local range constraints are written in [] in the right side of Figure 5. For example, for accesses to array a in the loop, we can find its local range constraints as .
Although the local range constraints of function worker restrict the possible values of the variables in the subscript expression of (such as , , and ), we are not aware of that the value of is depend on the thread identifier which appears in the caller function entry. Thus, we employ the second step as interprocedural range analysis to obtain the global range constraints as by associating the local variables and with the variable from the caller function (here we use the name of caller function as the prefix to indicate that the variable is passed from function ).
After getting the global range constraints, we can formulate the array cross-range checking as a CSP to determine whether or not different threads can access common elements. In this example, the object expression is , while the global range constraints are {}. By querying the STP, we confirm that the object expression is unsatisfiable under the global range constraints. Hence, there does not exist a pair of threads which access the same element of array , which indicates that race warnings about array can be excluded.
It is worth noting that before the range analysis process, we need to perform the so-called induction variable substitution (IVS) on the original program. In this example, variable is not directly controlled by explicit variable as and , which brings additional difficulties to the range analysis. If we directly process this function, we might obtain the set of range constraints such as . By solving the CSP transformed from subscript expression as , we cannot ensure that different threads access different parts of this array. However, after performing IVS on the original program, induction variable step becomes a fix value (i.e., myid) during the entire execution of this loops, and the subscript expression can be rewritten as , which greatly facilitates range analysis.
6 Record/Replay Implementation
As mentioned, to deterministically replay a multi-threaded program, both synchronization and data race orders are recorded in RacX. In this section, we introduce the record/replay mechanism for these two kinds of orders in RacX.
6.1 Recorder
During the recording phase, we need to record the execution orders among synchronization and data races. For each synchronization (e.g., pthread_mutex_lock, conditional wait, barrier, and so on), we record its timestamps of Lamport clock [25] at the pthread library level similar with several other deterministic record/replay schemes such as RecPlay [43] and PRES [39]. Although our scheme may miss some races in low level library, e.g., glibc, in practice, recording synchronization at the pthread library level is sufficient to successfully replay a multi-threaded program, while its performance overhead is much smaller than of recording at the glibc library level. For the notoriously intractable data races, we also utilize Lamport clock to trace race orders. In addition to recording and increasing the timestamp for each shared memory access, we also have to log the instruction count of traced memory accesses for facilitating replay.
Moreover, to simplify the recording process, here we only utilize two global clocks to log the timestamps of synchronization operations and data races, respectively. Although we could set one global clock for each synchronization operation related to the same synchronization variable (or for each data race accessing the same memory location) to allow more parallelism in replay phase, we found that the replay performance cannot be improved significantly since the replay overheads are already quite small.
6.2 Replayer
During the replay phase, two global variables are employed to track current execution clock. We also maintain a single global variable to track current instruction count for each thread, which servers as an index to query the timestamp of current synchronization operation or data race from the recording trace. Thus, in order to reproduce race orders, e.g., data race orders, once encountering a memory access that may cause a potential race, replayer should query the loaded trace from the recording phase to obtain the timestamp of this access based on current instruction count. Then, if corresponding clock equals to its timestamp, thread can proceed. Otherwise, should wait for its turn.
7 Evaluation
7.1 Experiment Setup
We conduct experiments on a 2.13GHz 16-core Intel Xeon SMP system with 8GB RAM and Linux version 2.6.18. The programs we employed for evaluation are listed in Table 1, including network application, desktop application and scientific computation from SPLASH-2 [51]. For each program, we measure the performance results of the original execution (without any source code modification), the record run, and the replay run. Moreover, each performance result is the average performance of five trials (which follow an excluded warm-up trial) to resist the common speed fluctuation of multi-threaded programs.
To evaluate the performance results of program apache, we utilize ab (Apach Bench) to send 500 requests from 16 concurrent client to the server over a local network. We evaluate program aget by retrieving a 53MB file from a server over a local network. For program pfscan, we use it to search a string in a directory with 968MB log files in parallel. For program fft, we set the parameter as 22, where there are complex data points transformed. And we set the parameter for program lu and program ocean as 1600 and 1026, respectively. For program water-ns, the number of molecules is 2197. To evaluate the scalability of RacX, for each program, we vary the number of worker threads as 1, 2, 4, 8 and 16 (however, for aget, the maximal number of threads cannot exceed 10, so we confine the maximal number of its worker threads to 8). Besides, here the number of worker threads are threads for effective computation, e.g., get threads in pfscan and download threads in aget.
7.2 Recording Overheads of Instrumenting All Race Warnings
In contrast to previous work that instrumenting all shared locations for recording the global orders of shared access to the same location from different threads [35, 40], the number of instrumented memory locations might be greatly reduced since only shared memory accesses that are relevant to potential races would be instrumented. Thus, in this experiment, we instrument all race warning sites in the raw report of a state-of-the-art race detector, which is named Relay, and compare its performance with the original execution. Obviously, if the recording overheads are very low, we can directly employ the raw race report of static race detectors for instrumentation without any post-process. Otherwise, false positive pruning techniques should be utilized to reduce instrumentation efforts.
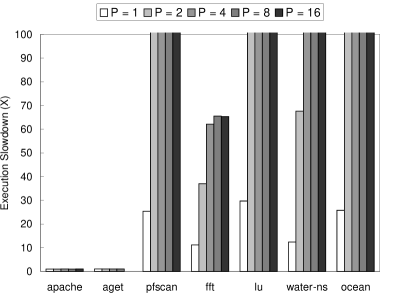
Figure 6 shows the execution slowdown of the recording run to the original run when instrumenting all reported race warnings. It is obvious that among the evaluated programs, the recording overheads for program apache and program aget are already very low (only 1.08X and 1.07X respectively) even when running with 16 threads. Taking program apache as an example, the reason may be that many instrumented codes are seldom executed, e.g., configurations of modules. Thus, program apache server only executes a small part of all instrumented codes during processing the requests from clients (generated by apache bench).
On contrary, for some desktop programs and scientific computation programs, the recording overheads are too large to switch on recording all race warnings in the raw report. For instance, when running with 16 threads, the maximal execution slowdown could even exceed 900X for program lu (exceeding the upper bound of Figure 6). Even for program fft with the least slowdown as 11.2X when running with 2 threads, it is still far from ideal deterministic replay approaches. In fact, for these programs, instrumentation are apparently implanted to the false positives in the hot-spots or critical paths, which have critical impacts on the performance. Therefore, pruning the false positives in the raw race report is very crucial to the successful of RacX.
7.3 Effects of False Positive Pruning
To reduce the instrumentation overheads, our Analyzer employs the proposed false positive pruning techniques, i.e., initialization pruning and array cross-range checking as introduced in previous sections, to exclude the “critical” false positives reported by Relay.
According to Figure 7, we can see that initialization pruning is effective to reduce race warnings for all evaluated programs except for program apache. It can reduce race warning sites for 34% (program aget) to 84% (program pfscan). Meanwhile, for all scientific programs, array cross-range checking is of great significance, as evidenced by that it can reduce race warning sites for 13% (program lu) to 60% (program ocean). However, it falls short of reducing false positives of other programs such as program pfscan since this kind of program does not have any shared array computation involved in reported race warnings.
To sum up, out techniques significantly reduce the number of race warnings in the refined report for most programs (from for lu) to for ocean). The only exception is program apache333The ineffectiveness of our techniques on apache is caused by that the most false positives of apache are unlikely alias which are hard to analyze by static methods, which has already negligible performance overhead even instrumenting all race warnings in the raw report. As a result, the race warning sites in the refined report become an extremely small portion of all the memory operations in multi-threaded program. As shown by Refined Sites column in Table 3, most programs contain less than race warnings. Program ocean even has only race warnings. It is not hard to imagine the low efforts to instrument these few race warnings in the Recorder and Replayer of RacX.
| Benchmark | Raw Report | Refined Report |
|---|---|---|
| apache | 11590 | 11546 |
| aget | 108 | 53 |
| pfscan | 67 | 3 |
| fft | 145 | 37 |
| lu | 88 | 45 |
| water | 464 | 53 |
| ocean | 1807 | 24 |
7.4 Record/Replay Performance of RacX
The overall performance results of RacX are shown in Table 4. The fist three columns show the name of evaluated programs, the number of working threads and the original execution time (average of trials). The next two columns give the execution time when running in recording mode (average of trials) and corresponding overheads to original run. Similarly, the last two columns show the execution time (average of trials) and corresponding overheads when running in replay mode.
| Benchmark | Worker | Original | Recording | Recording |
| Threads | Time (s) | Time(s) | Overheads | |
| apache | 1 | 18.36 | 18.51 | 0.81% |
| 2 | 17.89 | 18.09 | 1.12% | |
| 4 | 16.18 | 16.82 | 3.90% | |
| 8 | 14.38 | 14.73 | 2.48% | |
| 16 | 11.32 | 12.07 | 6.65% | |
| aget | 1 | 9.06 | 9.46 | 4.43% |
| 2 | 5.82 | 6.20 | 6.40% | |
| 4 | 5.83 | 6.24 | 6.98% | |
| 8 | 5.87 | 6.33 | 7.76% | |
| pfscan | 1 | 5.38 | 5.38 | 0.12% |
| 2 | 2.80 | 2.81 | 0.14% | |
| 4 | 1.44 | 1.45 | 0.15% | |
| 8 | 0.78 | 0.78 | 0.28% | |
| 16 | 0.49 | 0.49 | 0.57% | |
| fft | 1 | 3.67 | 3.69 | 0.56% |
| 2 | 2.24 | 2.25 | 0.73% | |
| 4 | 1.51 | 1.54 | 1.67% | |
| 8 | 1.18 | 1.19 | 0.98% | |
| 16 | 1.04 | 1.05 | 1.58% | |
| lu | 1 | 9.66 | 9.69 | 0.25% |
| 2 | 5.16 | 5.08 | -1.53% | |
| 4 | 2.79 | 2.73 | -1.97% | |
| 8 | 1.63 | 1.59 | -1.90% | |
| 16 | 1.05 | 1.04 | -0.99% | |
| water-ns | 1 | 6.21 | 6.26 | 0.74% |
| 2 | 3.37 | 3.4 | 1.03% | |
| 4 | 1.91 | 1.94 | 1.66% | |
| 8 | 1.23 | 1.28 | 4.15% | |
| 16 | 1.11 | 1.54 | 38.7% | |
| ocean | 1 | 6.66 | 6.68 | 0.22% |
| 2 | 3.30 | 3.31 | 0.56% | |
| 4 | 1.68 | 1.70 | 0.87% | |
| 8 | 1.11 | 1.13 | 1.62% | |
| 16 | 0.91 | 0.95 | 3.92% |
In recording mode, the average overheads across all evaluated programs are 1.21%, 1.89%, 2.20%, and 8.41% when running with 2, 4, 8 and 16 threads (except for program aget that cannot be executed with 16 threads), respectively. Thus, we can conclude that RacX is efficient and scalable in practical usages (e.g., debugging, fault tolerance, intrusion detection, and so on), since RacX works well on large scale commercial program and 16 worker threads. Among these programs, the most surprising one might be lu since the recording run is even slightly faster than the original run. According to Table 3, there are still race warning sites are still left for instrumentation, however, most race warning sites have only one instance (i.e., memory operations related to these race warning sites are executed for only one time). Therefore, these instrumentation codes have little impacts on the original execution. Furthermore, by comparing the execution details of the recording run and the original run, we find that the barrier time of the recording run is much smaller than the original run since the execution of worker threads are more balanced due to the import of instrumentation, which reduces the overall waiting time.
8 Related Work
Deterministic Record/Replay. Deterministic record/replay has been extensively investigated by various research communities, including computer architecture, operating system, parallel programming and debugging, reliability, hardware verification, and so on.
Initially, deterministic record/replay schemes focus on providing solutions for replica execution on uni-processor systems. These schemes are implemented in different abstract levels to record the non-deterministic events on uni-processor systems (e.g., I/O inputs, interrupts), e.g., Jockey [44], Liblog [18] and R2 [20] in library level, ReVirt [12], TTVM [24] and Nirvana [4] in virtual machine level, and Flashback [46] in system call level.
Deterministic record/replay schemes for multi-processor systems need to confront an additional type of non-deterministic events: data races. Informally, data race exists between a pair of conflicting memory operations without synchronization. It may make corresponding memory operations produce different results in different executions. Although the amount of data races is not high in real-world programs, it is extremely difficult to identify them: There are enormous number of pairs of conflicting memory operations, while identifying the existence of data race between even a pair of memory operations is also NP-hard [36]. Hence, previous investigations on deterministic record/replay do not attempt to find out all the data races and record them. On the contrary, they adopt two types of substitution strategies: Recording all memory operations, and recording none memory operation.
The intuition between the first strategy is that once the orders of all memory operations are recorded, the orders of all data races are also recorded. In addition to InstantReplay [26] that records the orders of shared objects at a coarser level. SMP-ReVirt [13] is a representative scheme the first strategy that can deal with fine-granularity shared memory access. It relies on the OS page management mechanism to record the ordering of all conflicting memory operations. It may lead to - slowdown to the production run. Another scheme PinPlay [40] employs a dynamic instrumentation tool (Pin [30]) to monitor all memory operations. It incurs - slowdown to the production run. DoublePlay [48] can convert the orders between memory operations to the orders of thread scheduling through speculative execution, thus it only needs to record the thread scheduling. However, it has to consume additional cores (the number of additional cores must equal to the number of cores in regular execution) to provide speculative results for reference, which may reduce the overall throughput of the system for . Since recording all memory operations with only software brings remarkable performance overheads, some hardware-assisted schemes were proposed to reduce the performance overhead (as well as log size) of recording with non-standard hardware supports [52, 22, 32, 49]. However, none of these non-standard hardware supports has been adopted by industry yet, hence these hardware-assisted schemes cannot work on commodity systems.
The second strategy does not record any memory operation to avoid the performance overhead of the first strategy. Instead, it only records the synchronization orders and a few other information (program outputs, execution path, and so on). RecPlay [43] is the first scheme adopting the second strategy. It has no knowledge about the normal memory operations, thus fails to replay the programs with data races. PRES [39] does not record all memory operations. To provide determinism, it has to repeatedly replay the program, until that some replay run happens to output the same with the production run. However, there is not theoretical upper bound for the replay times to meet the first satisfactory replay run. ODR [2] proposes to infer all the memory operation orders from the recorded program outputs, synchronization orders, and execution path information. However, it may fall short of some corner-cases due to the state exploration problem of inference. Respec [28] employs speculative execution to alleviate the burden of deterministic replay by only recording synchronization operations. However, it does not support off-line replay, thus cannot be employed by debugging multi-threaded programs. Besides, it needs additional cores to provide speculative results for reference similar with DoublePlay [48], which may reduce the overall throughput of the system for .
Furthermore, all schemes adopting the second strategy must relax their fidelity due to the lack of the order information of memory operations. They can only provide the so-called output determinism, which is a relaxation of the value determinism provided by RacX. The output determinism offers no guarantee on the identity of the execution details among the production run and the replay run. Such low level of determinism cannot fulfill the requirements of many important applications of deterministic record/replay (such as intrusion detection and workload capture), which care not only the outputs but also the execution details.
In general, RacX is substantially different with the previous deterministic record/replay schemes, since it is the first scheme that directly records and replays data races. From the perspective of soundness, RacX can faithfully record/replay multi-threaded programs with the value determinism, since it monitors all real data races and synchronization. From the perspective of efficiency, RacX exhibits the smallest slowdown among all deterministic record/replay schemes for multi-processor systems as far as we known. From the the perspective of scalability, RacX exhibits excellent scalability with respect to the program size and the number of threads. From the the perspective of portability, RacX has no requirements on the library, operating system, and the hardware, thus can be easily ported to various commodity systems.
Deterministic Execution. Recently, researchers have proposed deterministic execution as an alternative approach to achieve determinism without logging [38, 5, 10, 3, 11, 21]. However, the existing deterministic execution methods must impose predefined orders on the memory operation interleavings in the execution of multi-threaded program. Hence, these methods incur relatively high slowdowns to the production run, especially on commodity multi-processor systems which do not provide non-standard hardware support for deterministic execution (e.g., 1.1X-6X in CoreDet [3]).
Data Race Detection. Data race detection can be categorized into dynamic detectors and static detectors.
A typical dynamic data race detector instruments a program at runtime and detects data race appeared in the execution of the program [15]. The concrete detection algorithm can be based on happens-before analysis [25, 8] (which can be further improved with respect to efficiency and accuracy by hardware-based approaches as [42, 33, 29]), lockset algorithm [45], or both [37]. Although dynamic detectors are fast and ease to use in practice (i.e., reporting a small number of false positives), they cannot prove the absence of races since their scopes are limited to one execution with specific inputs and execution schedule. Even the program has been executed for a large number of times, we still cannot conclude that all real data races have been identified. Thus, the completeness requirement of RacX forces us seeking help for static analysis.
Typically, static data race detectors hunt potential races by analyzing the source code instead of directly executing the program. They can use type-based analysis [16, 6, 41] and data-flow analysis [14, 34, 50] to reason the relationship between memory operations in any possible execution, thus most static detectors are able to find all potential data races. In contrast to dynamic detectors, the main limitation of static detectors is that they may produce a large number of false positives due to the inherent lack of runtime information, such as pointer alias, array index information, and so on. An user of static detector often needs to identify the real data races from thousands of (even more) false positives, which is a tedious job. Although RacX does not need to know which concrete potential race is real race, which is false positive, false positives may reduce the efficiency of RacX. Therefore, RacX employs several automatic techniques (i.e., initialization pruning and array cross-range checking), to reduce the number of “critical” false positives that lie in hot-spots or critical paths.
9 Conclusions
In this paper, we propose an efficient deterministic replay scheme, i.e., RacX, that leverages race-guided instrumentation to significantly reduce the instrumented memory operations. Since most shared memory operations are well guarded by synchronization operations, instrumenting the potential data races (including all real data races and a few false positives) only brings little performance overheads to the production run and the replay run. Furthermore, we propose several automatic techniques, i.e., initialization locking and symbolic array cross-range checking, to prune the false positives which may significantly affect the efficiency of RacX. Experimental results on several programs with different scales demonstrate the soundness, effectiveness, efficiency and scalability of RacX. We hope that these technical merits of RacX can push the industrial acceptance of deterministic record/replay for multi-processor systems.
References
- [1] S. V. Adve and H.-J. Boehm. Memory models: a case for rethinking parallel languages and hardware. Commun. ACM, 53:90–101, 2010.
- [2] G. Altekar and I. Stoica. Odr: output-deterministic replay for multicore debugging. In SOSP’09, pages 193–206, 2009.
- [3] T. Bergan, O. Anderson, J. Devietti, L. Ceze, and D. Grossman. Coredet: a compiler and runtime system for deterministic multithreaded execution. In ASPLOS’10, pages 53–64, 2010.
- [4] S. Bhansali, W.-K. Chen, S. de Jong, A. Edwards, R. Murray, M. Drinić, D. Mihočka, and J. Chau. Framework for instruction-level tracing and analysis of program executions. In VEE’06, pages 154–163, 2006.
- [5] R. L. Bocchino, Jr., V. S. Adve, D. Dig, S. V. Adve, S. Heumann, R. Komuravelli, J. Overbey, P. Simmons, H. Sung, and M. Vakilian. A type and effect system for deterministic parallel java. In OOPSLA’09, pages 97–116, 2009.
- [6] C. Boyapati, R. Lee, and M. Rinard. Ownership types for safe programming: preventing data races and deadlocks. In OOPSLA ’02, pages 211–230, 2002.
- [7] T. C. Bressoud and F. B. Schneider. Hypervisor-based fault tolerance. ACM Trans. Comput. Syst., 14:80–107, 1996.
- [8] J.-D. Choi, B. P. Miller, and R. H. B. Netzer. Techniques for debugging parallel programs with flowback analysis. ACM Trans. Program. Lang. Syst., 13:491–530, 1991.
- [9] C. Dave, H. Bae, S.-J. Min, S. Lee, R. Eigenmann, and S. Midkiff. Cetus: A source-to-source compiler infrastructure for multicores. Computer, 42:36–42, 2009.
- [10] J. Devietti, B. Lucia, L. Ceze, and M. Oskin. Dmp: deterministic shared memory multiprocessing. In ASPLOS’09, pages 85–96, 2009.
- [11] J. Devietti, J. Nelson, T. Bergan, L. Ceze, and D. Grossman. Rcdc: a relaxed consistency deterministic computer. In ASPLOS ’11, pages 67–78, 2011.
- [12] G. W. Dunlap, S. T. King, S. Cinar, M. A. Basrai, and P. M. Chen. Revirt: enabling intrusion analysis through virtual-machine logging and replay. In OSDI’02, pages 211–224, 2002.
- [13] G. W. Dunlap, D. G. Lucchetti, M. A. Fetterman, and P. M. Chen. Execution replay of multiprocessor virtual machines. In VEE’08, pages 121–130, 2008.
- [14] D. Engler and K. Ashcraft. Racerx: effective, static detection of race conditions and deadlocks. In SOSP’03, pages 237–252, 2003.
- [15] J. Erickson, M. Musuvathi, S. Burckhardt, and K. Olynyk. Effective data-race detection for the kernel. In OSDI’10, pages 1–16, 2010.
- [16] C. Flanagan and S. N. Freund. Type-based race detection for java. In PLDI ’00, pages 219–232, 2000.
- [17] V. Ganesh and D. L. Dill. A decision procedure for bit-vectors and arrays. In CAV’07, pages 519–531, 2007.
- [18] D. Geels, G. Altekar, S. Shenker, and I. Stoica. Replay debugging for distributed applications. In USENIX ATC’06, pages 27–27, 2006.
- [19] GNU. “gdb: The gnu project debugger”, http://www.gnu.org/software/gdb.
- [20] Z. Guo, X. Wang, J. Tang, X. Liu, Z. Xu, M. Wu, M. F. Kaashoek, and Z. Zhang. R2: an application-level kernel for record and replay. In OSDI’08, pages 193–208, 2008.
- [21] D. Hower, P. Dudnik, M. Hill, and D. Wood. Calvin: Deterministic or not? free will to choose. In HPCA ’11, pages 333–344, 2011.
- [22] D. R. Hower and M. D. Hill. Rerun: Exploiting episodes for lightweight memory race recording. In ISCA’08, pages 265–276, 2008.
- [23] S. T. King, G. W. Dunlap, and P. M. Chen. Debugging operating systems with time-traveling virtual machines. In USENIX ATC’05, pages 1–15, 2005.
- [24] S. T. King, G. W. Dunlap, and P. M. Chen. Debugging operating systems with time-traveling virtual machines. In USENIX ATC’05, pages 1–1, 2005.
- [25] L. Lamport. Ti clocks, and the ordering of events in a distributed system. Commun. ACM, 21:558–565, 1978.
- [26] T. J. LeBlanc and J. M. Mellor-Crummey. Debugging parallel programs with instant replay. IEEE Trans. Comput., 36:471–482, 1987.
- [27] D. Lee, M. Said, S. Narayanasamy, Z. Yang, and C. Pereira. Offline symbolic analysis for multi-processor execution replay. In MICRO 42, pages 564–575, 2009.
- [28] D. Lee, B. Wester, K. Veeraraghavan, S. Narayanasamy, P. M. Chen, and J. Flinn. Respec: efficient online multiprocessor replayvia speculation and external determinism. In ASPLOS’10, pages 77–90, 2010.
- [29] B. Lucia, L. Ceze, K. Strauss, S. Qadeer, and H.-J. Boehm. Conflict exceptions: simplifying concurrent language semantics with precise hardware exceptions for data-races. In ISCA ’10, pages 210–221, 2010.
- [30] C.-K. Luk, R. Cohn, R. Muth, H. Patil, A. Klauser, G. Lowney, S. Wallace, V. J. Reddi, and K. Hazelwood. Pin: building customized program analysis tools with dynamic instrumentation. In PLDI’05, pages 190–200, 2005.
- [31] D. Marino, M. Musuvathi, and S. Narayanasamy. Literace: effective sampling for lightweight data-race detection. In PLDI’09, pages 134–143, 2009.
- [32] P. Montesinos, L. Ceze, and J. Torrellas. Delorean: Recording and deterministically replaying shared-memory multiprocessor execution effciently. In ISCA’08, pages 289–300, 2008.
- [33] A. Muzahid, D. Suárez, S. Qi, and J. Torrellas. Sigrace: signature-based data race detection. In Proceedings of the 36th annual international symposium on Computer architecture, ISCA ’09, pages 337–348, 2009.
- [34] M. Naik, A. Aiken, and J. Whaley. Effective static race detection for java. In PLDI ’06, pages 308–319, 2006.
- [35] S. Narayanasamy, C. Pereira, H. Patil, R. Cohn, and B. Calder. Automatic logging of operating system effects to guide application-level architecture simulation. In SIGMETRICS’06, pages 216–227, 2006.
- [36] R. H. B. Netzer and B. P. Miller. On the complexity of event ordering for shared-memory parallel program executions. In ICPP’90, pages 93–97, 1990.
- [37] R. O’Callahan and J.-D. Choi. Hybrid dynamic data race detection. In PPoPP ’03, pages 167–178, 2003.
- [38] M. Olszewski, J. Ansel, and S. Amarasinghe. Kendo: efficient deterministic multithreading in software. In ASPLOS’09, pages 97–108, 2009.
- [39] S. Park, Y. Zhou, W. Xiong, Z. Yin, R. Kaushik, K. H. Lee, and S. Lu. Pres: probabilistic replay with execution sketching on multiprocessors. In SOSP’09, pages 177–192, 2009.
- [40] H. Patil, C. Pereira, M. Stallcup, G. Lueck, and J. Cownie. Pinplay: a framework for deterministic replay and reproducible analysis of parallel programs. In CGO’10, pages 2–11, 2010.
- [41] P. Pratikakis, J. S. Foster, and M. Hicks. Locksmith: context-sensitive correlation analysis for race detection. In PLDI’06, pages 320–331, 2006.
- [42] M. Prvulovic. Cord: cost-effective (and nearly overhead-free) order-recording and data race detection. In HPCA ’06, pages 232 – 243, 2006.
- [43] M. Ronsse and K. De Bosschere. Recplay: a fully integrated practical record/replay system. ACM Trans. Comput. Syst., 17:133–152, 1999.
- [44] Y. Saito. Jockey: a user-space library for record-replay debugging. In AADEBUG’05, pages 69–76, 2005.
- [45] S. Savage, M. Burrows, G. Nelson, P. Sobalvarro, and T. Anderson. Eraser: a dynamic data race detector for multithreaded programs. ACM Trans. Comput. Syst., 15:391–411, 1997.
- [46] S. M. Srinivasan, S. Kandula, C. R. Andrews, and Y. Zhou. Flashback: a lightweight extension for rollback and deterministic replay for software debugging. In USENIX ATC’04, pages 3–3, 2004.
- [47] J. Tucek, S. Lu, C. Huang, S. Xanthos, and Y. Zhou. Triage: diagnosing production run failures at the user’s site. In SOSP’07, pages 131–144, 2007.
- [48] K. Veeraraghavan, D. Lee, B. Wester, J. Ouyang, P. M. Chen, J. Flinn, and S. Narayanasamy. Doubleplay: parallelizing sequential logging and replay. In ASPLOS’11, pages 15–26, 2011.
- [49] G. Voskuilen, F. Ahmad, and T. N. Vijaykumar. Timetraveler: exploiting acyclic races for optimizing memory race recording. In ISCA’10, pages 198–209, 2010.
- [50] J. W. Voung, R. Jhala, and S. Lerner. Relay: static race detection on millions of lines of code. In ESEC-FSE’07, pages 205–214, 2007.
- [51] S. C. Woo, M. Ohara, E. Torrie, J. P. Singh, and A. Gupta. The splash-2 programs: characterization and methodological considerations. In ISCA ’95, pages 24–36, 1995.
- [52] M. Xu, R. Bodik, and M. D. Hill. A ”flight data recorder” for enabling full-system multiprocessor deterministic replay. In ISCA’03, pages 122–135, 2003.
- [53] J. Zhai, W. Chen, and W. Zheng. Phantom: predicting performance of parallel applications on large-scale parallel machines using a single node. In PPoPP’10, pages 305–314, 2010.