11email: skamio@spd.aas.org 22institutetext: School of Space Research, Kyung Hee University, Yongin, Gyeonggi 446-701, Korea
Continuous upflows and sporadic downflows observed in active regions
Abstract
Aims. We present a study of the temporal evolution of coronal loops in active regions and its implications for the dynamics in coronal loops.
Methods. We analyzed images of the Atmospheric Imaging Assembly (AIA) on the Solar Dynamics Observatory (SDO) at multiple temperatures to detect apparent motions in the coronal loops.
Results. Quasi-periodic brightness fluctuations propagate upwards from the loop footpoint in hot emission at 1 MK, while sporadic downflows are seen in cool emission below 1 MK. The upward motion in hot emission increases just after the cool downflows.
Conclusions. The apparent propagating pattern suggests a hot upflow from the loop footpoints, and is considered to supply hot plasma into the coronal loop, but a wavelike phenomenon cannot be ruled out. Coronal condensation occasionally happens in the coronal loop, and the cool material flows down to the footpoint. Emission from cool plasma could have a significant contribution to hot AIA channels in the event of coronal condensation.
Key Words.:
Sun : corona – Sun: transition region – Sun : UV radiation1 Introduction
Heating of a coronal loop is a fundamental problem in solar physics. Coronal loops, which are thin thread-like structures seen in coronal emission lines, must be continuously heated to account for their radiative and conductive energy losses. However, models of coronal loops are not mature enough to reproduce the observations sufficiently Winebarger et al. (2002),Warren & Winebarger (2006), and Aschwanden et al. (2009) show that a static loop model is not consistent with observations. A dynamic model with a collection of impulsive heatings is in better agreement with observations, but still not satisfactory (Warren et al., 2003, 2007). A detailed study of the temporal evolution of coronal loops is therefore crucial for understanding them.
Observations of nonflaring active regions show that coronal loops are visible over a wide temperature range and are highly variable. Brightness distribution of EUV emission lines indicates that hot loops ( K) are concentrated in the cores of active regions, while lower temperature loops ( K) are located on the periphery of the active region (Aschwanden et al., 2008; Tripathi et al., 2008; O’Dwyer et al., 2011). Loop-like structures are also seen at transition-region and chromospheric temperatures. Kjeldseth-Moe & Brekke (1998) have shown that cool loops seen at K change significantly within one hour, while hot loops are less variable. Schrijver (2001) finds cool plasma ( K) flowing down along the loop, which he interprets as a result of catastrophic cooling at the loop top. Numerical simulations shows that frequent occurrence of falling blobs in chromospheric lines, or coronal rain, favors a heating concentrated near the footpoints of a coronal loop (Müller et al., 2003, 2004, 2005; Antolin et al., 2010). Clearly, in order to understand the energy balance of coronal loops, it is important to study both the cooling and heating processes.
The Atmospheric Imaging Assembly (AIA; Lemen et al., 2011; Boerner et al., 2011) on the Solar Dynamics Observatory (SDO) records high-cadence EUV images at multiple temperatures. In this paper, we selected nonflaring active regions at the limb and on the disk to study the temporal evolution of coronal loops. Unprecedented data from AIA allowed studying the flows along the loops over a wide temperature range.
The paper is organized as follows. Observations with AIA are described in Sect. 2. Section 3 shows the temporal evolution of selected loops in the active region and simulated lightcurves of cooling plasma under constant pressure and Sect 4 summarizes the results and discusses the implications for coronal loop models.
2 Observations
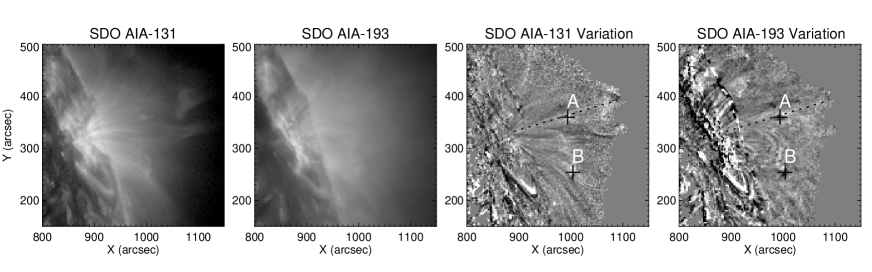
AIA records full-Sun images with 0.6″ spatial sampling and 12 s temporal cadence, and covers all active regions visible from Earth. We mainly analyzed the following AIA channels to pick up different temperatures: 304Å (He ii, ), 131Å (Fe viii, ), 171Å (Fe ix, ), 193Å (Fe xii, ), and 335Å (Fe xvi, ). The primary ions in the AIA channels are adopted from Lemen et al. (2011). Flare lines () are excluded since they are negligible in a nonflaring active region. A six-hour series of AIA data was extracted from the calibrated level-1 data archive to study the active region NOAA 11117 near the limb on 31 October 2010 (Fig. 1).
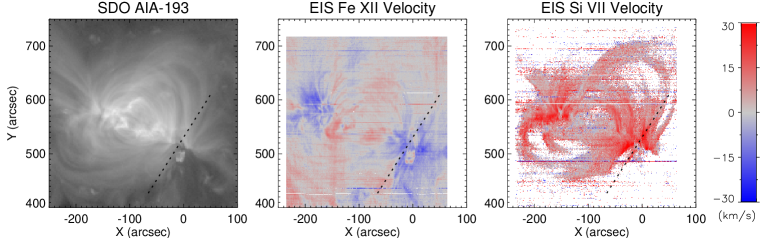
Another five-hour series of the active region NOAA 11120 crossing the meridian on 5 November 2010 is selected to provide a different view angle. At that time, the EUV Imaging Spectrometer (EIS; Culhane et al., 2007) on Hinode (Kosugi et al., 2007) recorded spectra by employing a 1″ wide slit with 30 s exposure time. A scan of 300″400″ took 158 min. The calibration of EIS data including dark current subtraction and removal of hot pixels is performed by using a standard procedure provided in the Solar Software tree (SSW; Freeland & Handy, 1998). The Doppler shifts of Fe xii 195.12 Å and Si vii 275.35 Å are deduced by fitting their spectra with single Gaussians and by applying the calibration procedure described in Kamio et al. (2010). The rest positions of spectra are determined by spectra at the limb obtained on 1 November 2010 using the same observing sequence of EIS.
3 Results
3.1 Continuous propagating pattern
An AIA-193Å image and Doppler maps in two spectral lines from EIS scans of NOAA 11120 are plotted in Fig. 2. The shifts in Fe xii indicate upflows of up to km s-1 at the footpoint of the loop system, while Si vii, formed at K, exhibits downflows of up to 30 km s-1. A temporal variation is computed from a pair of AIA images recorded ten minutes apart,
| (1) |
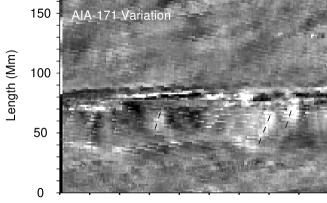
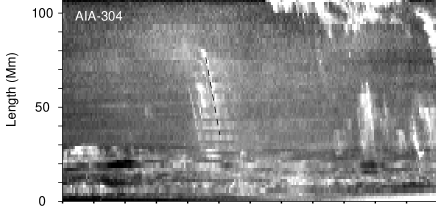
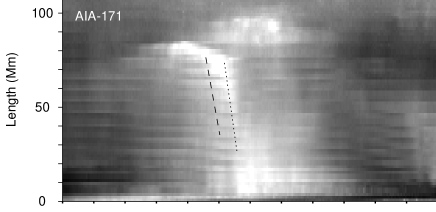
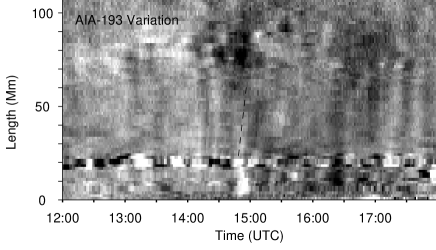
where and are the radiance from the image pair. We employ instead of to highlight relative changes, which are appropriate since the radiance displays a wide range of values over the field of view. Figure 3 displays time distance plots of AIA-171Å and 193Å temporal variations along the line in Fig. 2. The slice is chosen to cross the footpoint of the loop system. In the footpoint region between 70 Mm and 90 Mm, the time slice plots only indicate long-term variation. Outside the footpoint region, the AIA-193Å exhibits an oppositely directed quasi-periodic pattern, present throughout the data series, indicating motions away from the footpoint.
Occasionally, bright streaks moving towards the footpoint are observed in the AIA-171Å time distance plot, which are indicated on the plot. The apparent velocities are 35 to 43 km s-1. The nonuniform and variable background emission hinders any detection of such a pattern in AIA-131Å and AIA-304Å. When the bright streak in AIA-171Å reaches the footpoint, a noticeable propagation in AIA-193Å is initiated from the footpoint. The dashed lines in AIA-193Å plot mark the distinct events that occur right after the AIA-171Å downflow event. The magnitude of the outward velocities vary from 57 km s-1 to 88 km s-1. The outward streaks show quasi-periodic pattern of about 10 minutes.
3.2 Sporadic downflow
Apparent downflows are frequently observed in a time sequence at temperatures lower than 1 MK. The two righthand panels in Fig. 1 show the temporal variations of AIA-131Å and 171Å between 13:15 UTC and 13:25 UTC, at the beginning of a falling event. A brightening in AIA-131Å and a darkening in the AIA-193Å are simultaneously detected at the cross signs A and B.
Figure 4 presents a time distance plot, where the two upper panels of Fig. 4 display original radiance in AIA-304Å and 171Å, while the bottom panel shows a temporal variation of AIA-193Å to enhance small variations. The brightening in AIA-171Å began at 13:40 UTC around a height of 80 Mm. Small blobs in AIA-304Å are seen to fall at a speed of 51 km s-1 starting 14:15 UTC. A bright streak in AIA-171Å appears at around 13:40 UTC and moves down slowly until 14:40 UTC when it starts falling at a speed of 65 km s-1, following the cooler falling material seen in AIA-304Å. Just as the cool material reaches the surface, a noticeable upward motion at a speed of 82 km s-1 in AIA-193Å is initiated. Similarly, in Fig. 3, an outward motion in AIA-193Å is induced immediately following the inward motion in AIA-171Å. The results indicate that the hot upflowing pattern is enhanced after cool downflowing events.
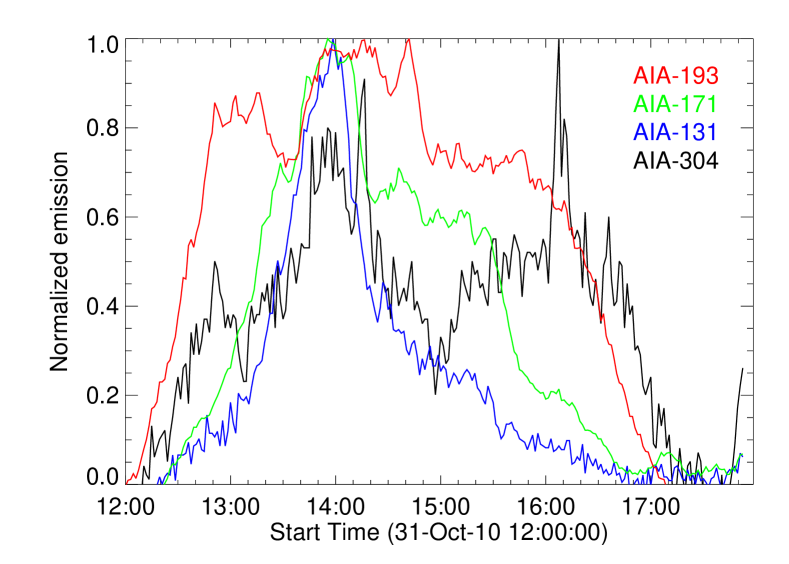
Figure 5 displays normalized lightcurves integrated over the 5″5″ box surrounding A in Fig 1. The radiance at 17:30 UTC is subtracted from the measured radiance to compensate for the background. The assumption of a constant background is reasonable, since the pre-event radiance at 12:00 UTC and the postevent radiance at 17:30 UTC were quite similar. AIA-193Å shows a broad peak with a small dip at 13:30 UTC, when AIA-131Å and 171Å rapidly increased. This emission variation is interpreted as the cooling of plasma. However, AIA-193Å attained its maximum after AIA-131Å and 171Å reached their peak emissions. Then the AIA-131Å and 171Å decrease as the plasma cooled and moved out of the box. A small peak was noticed in AIA-304Å at 14:15 UTC, when falling blobs in AIA-304Å started falling. The AIA-335Å only indicated a gradual change over several hours, so it is not related to the falling event (not shown in Fig.5). The later AIA-304Å peak at 16:08 UTC is due to another falling event originating in the higher corona so is not directly related to this cooling event. In a six-hour movie in AIA-131Å, eight sporadic downflowing events are identified in this active region. They seem to be seen in different loops rather than repeatedly in the same loop.
3.3 AIA response to cooling structures
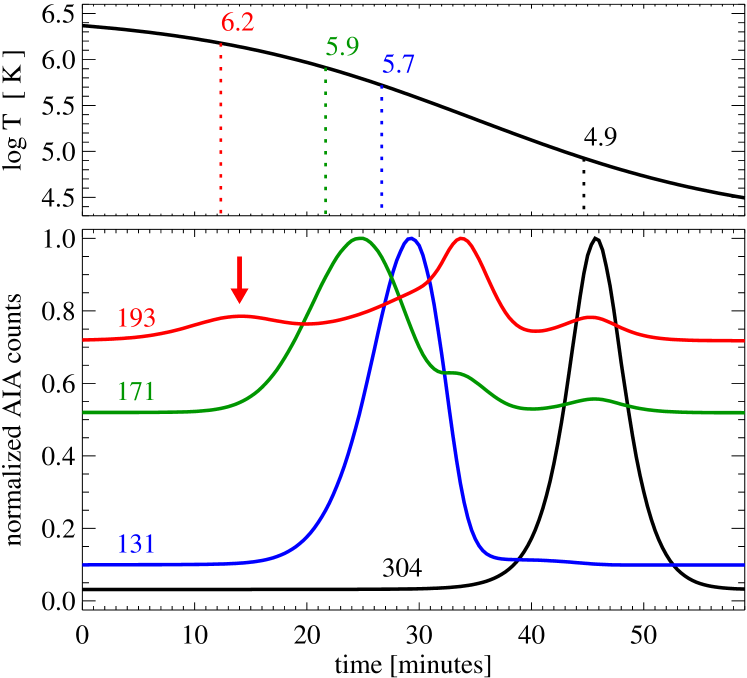
When observing a cooling loop with AIA one would expect a successive brightening in the bandpasses according to the maximum of the temperature response functions, i.e. in the sequence AIA-193Å, 171Å, 131Å, and 304Å. However, close inspection of the AIA response shows that the hot channels 211Å and 193Å show non-negligible contributions from cooler lines, e.g. there are numerous O v lines in the 193Å channel. This leads to a secondary maximum of the AIA-193Å response at about , which is about a factor of 10 weaker than the main peak at due to Fe xii.
A loop that is cooling after the heating stopped will show a simultaneous decrease in temperature and pressure, and consequently the the AIA channels will indeed brighten according to their maximum response temperatures. However, the situation is different for a loop that is undergoing catastrophic cooling (Schrijver, 2001). In this case there is a loss of equilibrium between heating, radiative cooling, and heat conduction (Müller et al., 2003, 2004), and condensation forms, typically in the upper part of the loop. Through inflows from the lower parts of the loop, the pressure across this condensation remains roughly constant. Thus, as the temperature drops, the density rises in the condensation. As the emission is proportional to the density squared, the contribution at low temperatures can even dominate the hot channels while the condensation is forming.
This is shown through a simple example in Fig. 6. In a volume at constant pressure where the temperature drops gradually, multiple peaks can be found in some of the AIA bandpasses. In particular, the main peak of the hot 193Å channel occurs after the peaks of the cooler 171Å and 131Å channels. A smaller peak for the 193Å channel can also be seen earlier (an arrow in Fig. 6), when the structure reaches the temperature of maximum response in the 193Å channel. As mentioned above, that the 193Å channel peaks after the cooler channels is due to the AIA temperature response functions, namely the contribution of cool lines to hot channels.
This gives a simple qualitative explanation of the peculiarities of the AIA lightcurves shown in Fig. 5 and discussed in Sect. 3.2. However, the model does not perfectly agree with observations because decay times of AIA-131Å, 171Å, and 193Å lightcurves are longer than the predictions. This model is too simple to attempt a more quantitative comparison.
4 Discussion
AIA data in active regions reveal brightness variations propagating both upward and downward. In AIA-193Å, the variations are always present and propagate upward with the speeds of 57 km s-1 to 88 km s-1. Our study from different viewing angles indicates that these fluctuations originate at the footpoints of the loop system and propagate along magnetic field lines diverging from the footpoint. The blueshift observed at loop footpoints supports an interpretation in terms of a constant hot upflow, although the magnitude of the Doppler shift (up to km s-1) is smaller than the propagation speed along the investigated cut in AIA-193Å. The low velocity could result from a superposition of different velocity components under the spatial resolution of EIS. It has been reported in hot emission lines (2 MK) that the blue wing of the line profile is enhanced in active regions, which is interpreted as a signature of subsonic upflows (Hara et al., 2008; De Pontieu et al., 2009; Peter, 2010). A detailed study of spectral profiles at the coronal loop footpoints will be presented in a future paper. We cannot rule out that the quasi-periodic intensity fluctuation is caused by a propagating magneto-acoustic wave (Fig. 3); however, De Pontieu & McIntosh (2010) demonstrated that lightcurves from randomly driven upflows and propagating waves are indistinguishable.
Sporadic downflows towards the loop footpoint are detected in the cooler AIA-304Å, 131Å, and 171Å channels, which we interpret as a cool plasma flowing down along the magnetic field lines. The downflow of cool emission is reported in previous studies (Schrijver, 2001; Ugarte-Urra et al., 2009). Our study revealed that the downflowing plasma is initiated by a cooling in the corona. The increase in AIA-171Å and AIA-131Å lightcurves coincide with a small decrease in the AIA-193Å lightcurve (Fig. 5). The results support the idea of coronal condensation occurring in the coronal loop (Müller et al., 2003, 2004, 2005). However, AIA-193Å increased again and remained high, while AIA-131Å decreased. Although the observed sequence of peak emissions in multiple AIA channels does not agree with the order of maximum temperature response of the AIA channels, it can be qualitatively explained by a cooling plasma at a constant pressure (Fig. 6). The simulated lightcurve of AIA-193Å shows that the contribution of cool emission lines within the broad passbands of the AIA channel is not negligible in the event of coronal condensation. Care should be taken when interpreting the lightcurves of AIA. There is also a need for more realistic modeling of cooling loops, which can be used to carry out a more quantitative comparison with our observations.
The descent of cool plasma is seen in AIA-304Å first, and is followed by AIA-171Å (Fig.4). It seems a cool dense core in AIA-304Å is surrounded by diffuse hotter plasma in AIA-171Å. This might be a reason for long decay times of lightcurves from AIA-131Å, 171Å, and 193Å. It is interesting to note that the propagation pattern in AIA-193Å becomes more pronounced after a falling event in cool emission (Figs. 3 and 4). A possible explanation is that the coronal loop is emptied after the descent of cool plasma, so there is plenty of room for hot upflows to propagate into the coronal loop. This work demonstrates that a dynamic modeling is essential for understanding the nature of coronal loops.
Acknowledgements.
Authors are grateful to the SDO team for providing excellent data. The German Data Center (GDC) for SDO is extensively used in this work. Hinode is a Japanese mission developed and launched by ISAS/JAXA, with NAOJ as domestic partner and NASA and STFC (UK) as international partners. It is operated by these agencies in co-operation with ESA and NSC (Norway). This work has been partly supported by WCU grant No. R31-10016 funded by the Korean Ministry of Education, Science, and Technology.References
- Antolin et al. (2010) Antolin, P., Shibata, K., & Vissers, G. 2010, ApJ, 716, 154
- Aschwanden et al. (2008) Aschwanden, M. J., Nitta, N. V., Wuelser, J., & Lemen, J. R. 2008, ApJ, 680, 1477
- Aschwanden et al. (2009) Aschwanden, M. J., Wuelser, J., Nitta, N. V., Lemen, J. R., & Sandman, A. 2009, ApJ, 695, 12
- Boerner et al. (2011) Boerner, P., Edwards, C., Lemen, J., et al. 2011, Sol. Phys., submitted
- Culhane et al. (2007) Culhane, J. L., Harra, L. K., James, A. M., et al. 2007, Sol. Phys., 243, 19
- De Pontieu & McIntosh (2010) De Pontieu, B. & McIntosh, S. W. 2010, ApJ, 722, 1013
- De Pontieu et al. (2009) De Pontieu, B., McIntosh, S. W., Hansteen, V. H., & Schrijver, C. J. 2009, ApJ, 701, L1
- Freeland & Handy (1998) Freeland, S. L. & Handy, B. N. 1998, Sol. Phys., 182, 497
- Hara et al. (2008) Hara, H., Watanabe, T., Harra, L. K., et al. 2008, ApJ, 678, L67
- Kamio et al. (2010) Kamio, S., Hara, H., Watanabe, T., Fredvik, T., & Hansteen, V. H. 2010, Sol. Phys., 266, 209
- Kjeldseth-Moe & Brekke (1998) Kjeldseth-Moe, O. & Brekke, P. 1998, Sol. Phys., 182, 73
- Kosugi et al. (2007) Kosugi, T., Matsuzaki, K., Sakao, T., et al. 2007, Sol. Phys., 243, 3
- Lemen et al. (2011) Lemen, J. R., Title, A. M., Akin, D. J., et al. 2011, Sol. Phys., submitted
- Müller et al. (2005) Müller, D. A. N., De Groof, A., Hansteen, V. H., & Peter, H. 2005, A&A, 436, 1067
- Müller et al. (2003) Müller, D. A. N., Hansteen, V. H., & Peter, H. 2003, A&A, 411, 605
- Müller et al. (2004) Müller, D. A. N., Peter, H., & Hansteen, V. H. 2004, A&A, 424, 289
- O’Dwyer et al. (2011) O’Dwyer, B., Del Zanna, G., Mason, H. E., et al. 2011, A&A, 525, A137
- Peter (2010) Peter, H. 2010, A&A, 521, A51
- Schrijver (2001) Schrijver, C. J. 2001, Sol. Phys., 198, 325
- Tripathi et al. (2008) Tripathi, D., Mason, H. E., Young, P. R., & Del Zanna, G. 2008, A&A, 481, L53
- Ugarte-Urra et al. (2009) Ugarte-Urra, I., Warren, H. P., & Brooks, D. H. 2009, ApJ, 695, 642
- Warren et al. (2007) Warren, H. P., Ugarte-Urra, I., Brooks, D. H., et al. 2007, PASJ, 59, S675
- Warren & Winebarger (2006) Warren, H. P. & Winebarger, A. R. 2006, ApJ, 645, 711
- Warren et al. (2003) Warren, H. P., Winebarger, A. R., & Mariska, J. T. 2003, ApJ, 593, 1174
- Winebarger et al. (2002) Winebarger, A. R., Warren, H., van Ballegooijen, A., DeLuca, E. E., & Golub, L. 2002, ApJ, 567, L89