Confinement of Anomalous Liquids in Nanoporous Matrices
Abstract
Using molecular dynamics simulations, we investigate the effects of different nanoconfinements on complex liquids—e.g., colloids or protein solutions—with density anomalies and a liquid-liquid phase transition (LLPT). In all the confinements, we find a strong depletion effect with a large increase in liquid density near the confining surface. If the nano confinement is modeled by an ordered matrix of nanoparticles (NPs), we find that the anomalies are preserved. On the contrary, if the confinement is modeled by a disordered matrix of NPs, we find a drastically different phase diagram: the LLPT shifts to lower pressures and temperatures, and the anomalies become weaker, as the disorder increases. We find that the density heterogeneities induced by the disordered matrix are responsible for the weakening of the LLPT and the disappearance of the anomalies.
pacs:
64.70.Ja,65.20.-w, 66.10.C-Many experiments in recent years have shown that a number of liquids exhibit highly anomalous properties vilaseca2011 . The data for liquid metals, metalloids, nonmetals, oxides and alloys—including Ga, Bi Te, S, Be, Mg, Ca, Sr, Ba, SiO2, P, Se, Ce, Cs, Rb, Co, Ge, Ge15Te85—colloids, protein solutions, organophosphates, such as triphenyl phosphite (TPP), AY20 melts [(Al-O)80–(Y-O)20] and water, reveal the presence of a temperature of maximum density (TMD) below which the density decreases under isobaric cooling vilaseca2011 . In a number of these systems, such as P, TPP, and AY20 P , it has been shown the existence of a liquid-liquid phase transition (LLPT) ending in a liquid-liquid critical point (LLCP) between two coexisting liquids with the same composition but different structure: the high density liquid (HDL) and the low density liquid (LDL). Data from experiments on silica, C, Se, Co, and water are consistent with a LLPT sio2 . Here we ask how the structure of the nanoconfinement may change the anomalous behavior of the liquid and affect the LLPT and the LLCP. This question is relevant across a wide range of nanotechnological applications, biological systems, and is of general interest for phase transitions in confined systems referee .
We model the liquid using two different potentials, (i) the Jagla ramp potential Jagla and (ii) the continuous shoulder potential Fr , which reproduce thermodynamic and dynamic anomalies, LLPT and LLCP in bulk. We model the nanoconfinement by a fixed matrix of NPs connected by bonds which the liquid particles can penetrate. Potential (i) has a hard-core at distance , and a linear ramp for decreasing from interaction energy to , plus a linear ramp for increasing from to 0. We adopt , and . The liquid particles interact with NPs via hard core repulsion at distance , where is the NP diameter. Potential (ii) has a repulsive shoulder and an attractive well with energy minimum , with parameters chosen to fit a potential proposed in Ref. HG93 . The interaction with NPs is given by a power law.
For both potentials we perform simulations at constant number of liquid particles, constant volume , and constant temperature , with periodic boundary conditions. For (i) we employ a discrete molecular dynamics (MD) algorithm by discretizing the linear ramp potential into steps, with Buldyrev . For (ii) we use a standard MD with a velocity Verlet integrator and the Allen thermostat Fr .
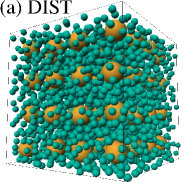
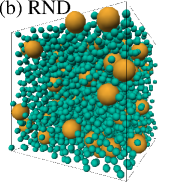
We consider three different structures for the matrix: a perfect cubic lattice (CUBE); a cubic lattice with Gaussian distortions (DIST) with a standard deviation equal to 1/4th the separation between centers of NPs, which still preserves an approximately periodic and ordered structure of the confinement (Fig. 1a); and a completely random (RND) configuration of NPs obtained by simulating a gas of hard spheres (Fig. 1b). The volume fraction of NPs is , where is the volume of the cubic simulation box and is the volume inaccessible to the liquid. Our results here, if not otherwise indicated, are for liquid (i) confined by the matrix of NPs with diameter at and . We control the density of the liquid particles by changing in the interval between 1845 and 3887. We take into account that the excluded volume rescales the pressure by . We find that the results for liquid (ii) are consistent in similar conditions.
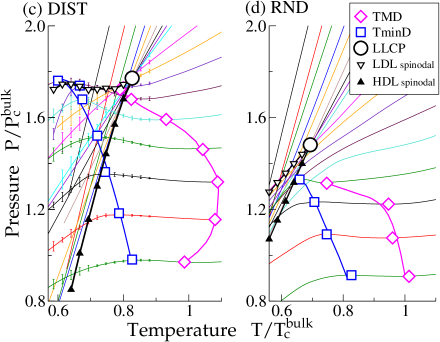
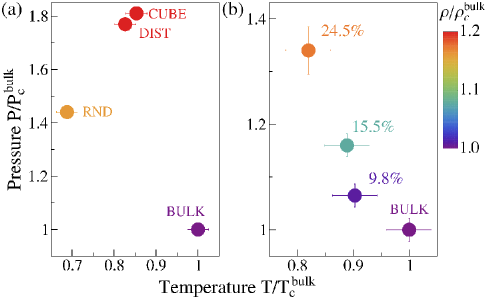
For liquid (i), the bulk system displays a LLCP at , , and Jagla . Figures 1(c) and 1(d) show simulated isochores for DIST and RND confinement, respectively, with the HDL-LDL spinodal lines calculated using conditions and , and the LLCP obtained at the point of merging of the spinodal lines where . We find that every confinement causes the LLCP to shift to a lower , a higher , and a higher than in the bulk liquid (Fig. 2a). As the disorder in the confining matrix increases, the shift is more pronounced and the and shifts less pronounced. We find the same qualitative trend in the LLCP shifts for liquid (ii), and that the LLCP progressively approaches the bulk case when the NP concentration decreases (Fig. 2b), consistent with previous results for NP-liquid mixtures CorradiniPRE10 .
While the periodic DIST confinement preserves the LDL-HDL coexistence region observed in bulk liquid (Fig. 1c), which is consistent with a strong first-order LLPT, the RND confinement shrinks the coexistence region (Fig. 1d) and weakens at the LLPT, which manifests itself in the shrinking of the region between the spinodals in the – plane. This shrinking is qualitatively consistent with that found for a model of water in a random hydrophobic pore-like confinement Strekalova .
The region of density anomaly is bounded by the lines of the TMD and the temperature of minimum density (TminD) located by the extrema of the isochores. In the bulk system the TminD line for high densities is hindered by the glass temperature line and cannot be observed in the equilibrium liquid. Here we observe that the periodic structure of the confinement can dramatically affect density anomaly manifestations. Compared to the bulk, confinement decreases TMD and increases TminD, shrinking the range of the density anomaly. The density anomaly is still well defined in the DIST case, but it appears much less pronounced in the RND case. For a RND matrix of large confining NPs with diameter at and , the TMD and TminD are completely absent (not shown).
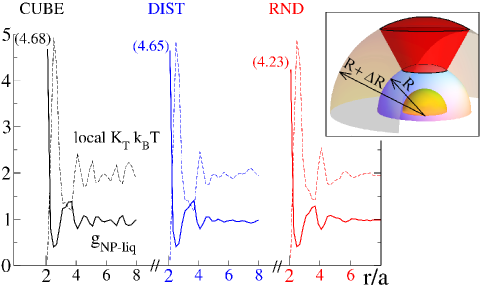
To understand the origin of the different effects of the different confinements, we study the density of the liquid in the vicinity of NPs. We find that a layer of liquid adsorbs onto the NPs, as revealed by the fluid density profile (Fig. 3). We understand the increase of density near the NP surface as a consequence of entropy maximization. By packing near the fixed NPs, the adsorbed liquid particles allow more free space to the the rest of the liquid, maximizing the entropy of the system (depletion effect). This result evokes a similar effect found for water at confining surfaces, regardless of the hydrophobic or hydrophilic interaction with the surface Garde , and for hard-sphere fluids in contact with purely repulsive particles Konig , showing that the increase of contact density is not related to specific interactions or anomalous behaviors and making a bridge between water and simple fluids.
We find that, by increasing randomness in the confinement, the probability of overlap of NP exclusion volumes increases and the depletion effect decreases. As a consequence, the density of liquid near the NPs decreases (Fig. 3). In addition, we analyze the density fluctuations and the associated measurable response function, the local isothermal compressibility (Fig. 3), of the liquid in the vicinity of the NPs. We find that is extremely small at the interface, consistent with a tight packing of liquid particles around the NPs. Near the first minimum of , is, instead, twice as high as in the bulk. A high local density causes the density increase of the LLCP (Fig. 2) because, when part of the liquid is adsorbed onto the NPs, an average liquid density larger than bulk is necessary to build up the critical fluctuations. The shift is more pronounced for CUBE and DIST confinement, with respect to RND, because the more ordered the confinement the larger the NP surface available for the depletion effect.
To better understand how confinement structure affects the physical properties of a liquid, we study the liquid’s local density distribution inside the confinement matrix. We identify the region not occupied by the NPs and partition it into disconnected cavities (inset Fig. 4c) based on the Delaunay tessellation algorithm described in Ref. Sastry . We define the exclusion spheres concentric with NPs and gradually increase their radius with a small step . We designate the space not occupied by exclusion spheres as void of size and denote it . For , is a connected set for both RND and DIST confinements. The volume of is equal to .
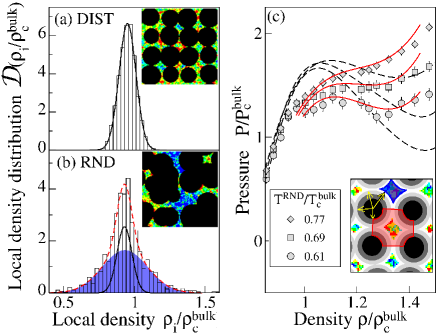
In DIST confinement, when , breaks into 64 small disconnected cavities, associated with 64 distorted cubic pockets formed by 8 adjacent NPs. The volume of each pocket is given by the volume of all Delaunay tetrahedra comprising the corresponding pocket minus the volume occupied by the NPs forming the pocket. We define the particle density of liquid in each pocket , where is the number of liquid particles inside pocket . We find that the volumes are narrowly distributed, with the local liquid density distribution given by a Gaussian with variance (Fig. 4a).
In RND confinement, remains fully connected up to . As we increase , small pockets break away from the largest part of one by one. When we count, for different random configurations, approximately 60 pockets, for which we calculate and , finding a large variety of sizes and shapes. We compute and find that in RND it can be approximated with the sum of two Gaussian distributions: one similar to the DIST case with and the other resulting from the heterogeneity of volumes of the pockets with (Fig. 4b).
We hypothesize that in RND confinement the observed pressure results from averaging local pressures in each pocket. At temperature we estimate using the average of the over all heterogeneous pockets (Fig. 4c),
| (1) |
Due to averaging over different densities , the non-monotonic subcritical isotherm at becomes a monotonic critical isotherm that closely fits the simulation results for the RND confinement in the vicinity of the LLPT. Thus our averaging technique allows us to reproduce quantitatively the differences we found when we compared DIST and RND confinements, i.e., the critical temperature, pressure, and density decrease (Fig. 2a) and density anomaly region shrinks (Fig. 1c,d). Thus the presence of density heterogeneity and the reduced depletion effect in the RND confinement matrix give us the key to understanding the effect of confinement structures. It is important to stress the differences of the effect of confinement on the LLPT and the liquid-gas phase transition (LGPT). While in both cases the critical temperature is significantly reduced, the effects of random confinement and ordered confinement are practically indistinguishable in the case of LGPT. This is because in LGPT, the density of liquid particles has a much smaller increase near NPs than in LLPT. Thus in LGPT randomness does not lead to local density heterogeneities, which produce a strong effect on the LLPT.
In conclusion, we predict that anomalous liquids with a LLPT retain their bulk phase diagram and density anomalies when they are confined in a porous matrix with an ordered structure. Furthermore, when there is a small distortion of the confinement, the glass temperature is reduced with respect to bulk, allowing the direct observation of the TminD locus. A strong depletion effect induces a large increase of density in the vicinity of the NPs. The effect is smaller when the confinement has a random structure. Randomness induces heterogeneity in the local density, which weakens the LLPT, narrows the LLPT coexistence region, and washes out the density anomalies.
Although the anomalous liquids considered here are in principle different from water, our results could qualitatively explain recent experiments for confined water, the prototypical anomalous liquid. While the TminD locus has been observed in supercooled water under hydrophilic confinement by the MCM-41 silica nanoporous matrix Mallamace-density-min , its absence has been reported in the hydrophobic mesoporous material CMK Zhang09 . MCM-41 forms a regular matrix Mallamace-density-min , but CMK consists of grains, each with a disordered pore structure Zhang09 . This suggests that the disparity of results for different confinements may arise from the different amount of disorder in the confining structures, independent of the interaction details of the anomalous liquid.
We thank D. Corradini, P. Gallo, S. Sastry and K. Stokely for discussions. EGS, JL, and HES acknowledge the support of NSF grants CHE0908218 and CHE0911389, SVB the Dr. Bernard W. Gamson Computational Science Center at Yeshiva College, and GF the MICINN grant FIS2009-10210 (co-financed FEDER) and the EU FP7 grant NMP4-SL-2011-266737.
References
- (1) P. Vilaseca, G. Franzese, J. Non-Crys. Sol. 357 419 (2011) and references therein.
- (2) Y. Katayama et al., Nature (London) 403, 170 (2000); Science 306, 848 (2004); G. Monaco et al., Phys. Rev. Lett. 90, 255701 (2003); H. Tanaka et al., ibid. 92, 025701 (2004); R. Kurita and H. Tanaka, Science 306, 845 (2004); J. Phys.: Condens. Matter 17, L293 (2005); G. N. Greaves et al., Science 322, 566 (2008).
- (3) C. A. Angell et al., J. Non-Cryst. Solids 207, 463 (1996). D. J. Lacks, Phys. Rev. Lett. 84, 4629 (2000); M. van Thiel and F. H. Ree, Phys. Rev. B 48, 3591 (1993); V. V. Brazhkin et al., Rev. High Pressure Sci. Technol. 7, 1129 (1998); M. G. Vasin and V. I. Ladýanov, Phys. Rev. E 68, 051202 (2003); S. Aasland and P. F. McMillan, Nature (London) 369, 633 (1994); M. C. Wilding and P. F. McMillan, J. Non-Cryst. Solids 293, 357 (2001).
- (4) F. Detcheverry et al., Phys. Rev. E 72, 051506 (2005).
- (5) E. A. Jagla, Phys. Rev. E 63, 061501 (2001); L. Xu et al., Proc. Natl. Acad. Sci. 102, 16558 (2005); Phys. Rev. E 74, 031108 (2006); J. Chem. Phys. 130, 054505 (2009).
- (6) G. Franzese, J. Mol. Liq. 136, 267 (2007); A. B. de Oliveira et al., J. Chem. Phys. 128, 064901 (2008); P. Vilaseca, and G. Franzese, ibid. 133, 084507 (2010).
- (7) T. Head-Gordon and F. H. Stillinger, J. Chem. Phys. 98, 3313 (1993).
- (8) S. V. Buldyrev, Springer Lect. Notes Phys. 752, 97 (2008).
- (9) D. Corradini et al., Phys. Rev. E. 81, 061504 (2010).
- (10) E. G. Strekalova et al., Phys. Rev. Lett. 106, 145701 (2011).
- (11) A. Geiger et al., Fluid Phase Equil. 183, 331 (2001); T. Werder et al., J. Phys. Chem. B 107, 1345 (2003); F. W. Starr et al., Phys. Rev. E 72, 051503 (2005); J. Marti et al., J. Chem. Phys. 124, 094703 (2006); G. Cicero et al., J. Am. Chem. Soc. 130, 1871 (2008); R. Godawat et al., Proc. Natl. Acad. Sci. 106, 15119 (2009).
- (12) P.-M. König et al., Europhys. Lett., 69, 832838 (2005).
- (13) S. Sastry et al., Phys. Rev. E, 56, 5524, (1997).
- (14) F. Mallamace et al., Proc. Natl. Acad. Sci. 104, 18387 (2007).
- (15) Y. Zhang et al., J. Phys. Chem. B 113, 5007 (2009).