Attosecond control of electrons emitted from a nanoscale metal tip
Attosecond science is based on steering of electrons with the electric field of well-controlled femtosecond laser pulses Corkum2007 . It has led to, for example, the generation of XUV light pulses Antoine1996 with a duration in the sub-100-attosecond regime Goulielmakis2008 , to the measurement of intra-molecular dynamics by diffraction of an electron taken from the molecule under scrutiny Niikura2002 ; Baker2006 , and to novel ultrafast electron holography Huismans2011 . All these effects have been observed with atoms or molecules in the gas phase. Although predicted to occur Lemell2003 ; Stockman2007 , a strong light-phase sensitivity of electrons liberated by few-cycle laser pulses from solids has hitherto been elusive. Here we show a carrier-envelope (C-E) phase-dependent current modulation of up to recorded in spectra of electrons laser-emitted from a nanometric tungsten tip. Controlled by the C-E phase, electrons originate from either one or two sub-500 as long instances within the 6-fs laser pulse, leading to the presence or absence of spectral interference. We also show that coherent elastic re-scattering of liberated electrons takes place at the metal surface. Due to field enhancement at the tip, a simple laser oscillator suffices to reach the required peak electric field strengths, allowing attosecond science experiments to be performed at the 100-Megahertz repetition rate level and rendering complex amplified laser systems dispensable. Practically, this work represents a simple, exquisitely sensitive C-E phase sensor device, which can be shrunk in volume down to 1 cm3. The results indicate that the above-mentioned novel attosecond science techniques developed with and for atoms and molecules can also be employed with solids. In particular, we foresee sub-femtosecond (sub-) nanometre probing of (collective) electron dynamics, such as plasmon polaritons Stockman2004 , in solid-state systems ranging in size from mesoscopic solids via clusters to single protruding atoms.
A nanoscale solid-state system is of interest also for a more applied reason. The steering of electrons with the force exerted by a synthesized few-cycle light field is predicted to allow reaching ultimate speeds in electronics, i.e. up to optical frequencies with a typical time scale of femtoseconds (“lightwave electronics” Goulielmakis2007 , in analogy to microwave electronics with semiconductor chips). However, typical electron energies in conventional electronics lie in the few electron volt range, corresponding to a velocity of a free electron of 1 nmfs. Thus, the speed-up of the drive can only be utilized in conventional electronics’ complexity if a nanometre-scale solid-state system is employed Stockman2007 . Because the electron current is switched on and off by the light field, one might call such a device an optical attosecond field-effect transistor. This work constitutes first research along these lines.
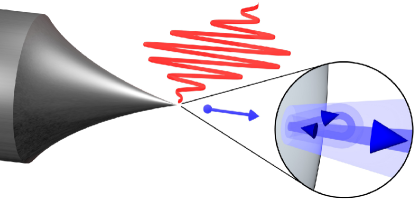
The experiment centers on a nm-radius metal tip, whose apex lies in the focus of a linearly polarized laser beam consisting of few-cycle laser pulses, see Fig. 1. The tip is instrumental for two reasons. First, because of its sharpness electric field enhancement takes place Novotny2011 . At the tip apex, the electric field is around five times higher than in the bare laser focus, corresponding to a 25-fold increase in intensity. Therefore, a laser oscillator suffices to reach the regime where Newton’s equations of motion describe the electron’s response quite well, marking attosecond science Corkum2007 . Field-enhancement near nano-structures has also facilitated the generation of high-harmonic radiation from gas atoms with an oscillator only Kim2008 , whereas in conventional gas phase experiments amplified laser systems are employed Bucksbaum2007 . Second, because of the localized nature of field enhancement, electron emission is limited to a single well-defined site with a diameter of 10 nm right on the tip’s apex. As this is much smaller than the focal diameter of the laser beam, the laser intensity is well approximated as constant over the electron emission area. Thus electrons are emitted from a single nanometric area exposed to a well-defined laser intensity.
This does usually not hold for photoemission from plane surfaces, where local laser intensities greatly differ due to the Gaussian profile of the laser beam and hot-spot effects due to a contingent surface roughness. We conjecture that C-E phase effects are therefore blurred when the electron emission current from a larger area is measured. For presumably these reasons, only minuscule C-E phase effects have so far been observed in nonlinear photoemission from a gold cathode, even though record-short near-infrared laser pulses with a duration of 4 fs were used Apolonski2004 . A previous attempt to measure a C-E phase dependence in photoemission from sharp tips lacked spectral information, which presumably hid the signal Hommelhoff_PRL2006_2 . An attosecond streaking experiment from a solid has been reported in Ref. 16, but there the electrons were photo-emitted from the metal surface by XUV pulses before they interacted with the infrared light field, thereby mitigating hot-spot effects. Collective electron and strong-field effects have been observed in tip-enhanced electron emission in Ref. 17 and Refs. 18 and 19, respectively, while Ref. 20 shows that thermal effects can be ruled out here.
In the experiment we focus 6-fs pulses from a C-E phase stabilized, 80-MHz repetition rate Ti:sapphire oscillator tightly on a tungsten tip (Fig. 1. The setup is described in more detail in Ref. 19 and in the Supplementary Information). A small negative extraction voltage is applied to the tip, resulting in a d.c. electric field strength of 0.4 GVm at the tip’s apex. We record photoelectron spectra with a retarding field spectrometer.
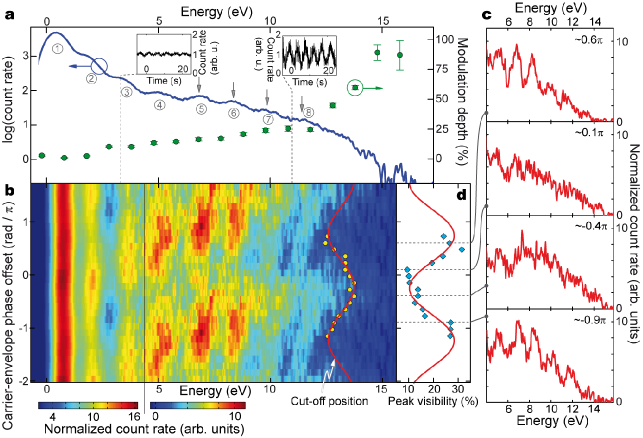
Already from the overall shape of the spectra conclusions can be drawn about the dynamics of the photoelectrons. In Fig. 2a we present a C-E phase averaged spectrum obtained with 240 pJ pulse energy (peak intensity of Wcm2 in the bare focus), with an average yield of about one electron per pulse. The spectrum is governed by above-threshold photoemission (ATP) peaks approximately spaced by the photon energy (1.56 eV) on top of an overall exponential decay 19. This decay is followed by a plateau, a region of almost constant count rate extending from 4.5 eV to a soft cut-off located at 13 eV. The appearance of the plateau indicates that coherent elastic re-scattering of electrons takes place, an effect well known in ionization of atoms in the gas phase: A small fraction of the photoelectrons is driven back into the tip by the laser field, scatters elastically off the tip, and gains more energy in the laser field before being detected 21. Theory models presented below strongly support this notion. A more detailed investigation of electron re-scattering dynamics from a metal is currently under way. Note that recombination of the active electron can lead to emission of high-harmonic radiation 1. We expect this process to also take place at tips.
The electric field of the laser pulses can be written as with describing the pulse envelope, the laser’s center (circular) frequency, and the C-E phase. Fig. 2b shows a contour plot of individual electron spectra as a function of the C-E phase offset, which is given by the sum of and a constant experimental phase difference to be determined by theory (set to 0 here, see later). Clearly, the spectral features are strongly modulated with the C-E phase: Both maxima and minima show pronounced modulation effects with a period of . In Fig. 2a (green points) we display the modulation depth of the count rate for different energy positions (for a definition see Supplementary Information). At low energy the modulation depth amounts to several percent and gains strength in the plateau (). In the region of the 13 eV-cut-off it increases up to 100 . Thus, here the C-E phase almost perfectly determines if a photoelectron is detected.
The visibility of the plateau peaks is particularly strongly affected by the C-E phase. Fig. 2c depicts individual spectra for four C-E phase settings spaced by . It is evident that for certain C-E phases peaks are clearly visible, whereas for others the peaks almost fully disappear. An analysis of the average peak visibility is shown in Fig. 2d (for details see Supplementary Information). It is approximately sinusoidally modulated with the C-E phase, ranging from for to for . We will show below that the peaks arise from quantum mechanical interference of electron wavepackets re-scattering at the tip in different optical cycles. The visibility can be identified as the degree of spectral interference. Strong interference indicates that (at least) two wavepacket components contribute to the plateau. In contrast, the absence of interference implies that only a single electron wavepacket from one optical cycle contributes.
In addition, we observe that the position of the high-energy cut-off changes with C-E phase as shown in Fig. 2b (red line). It varies between eV and eV. Notably, the behaviour of peak visibility and cut-off position is maximally out of phase: the phase-difference amounts to mrad.
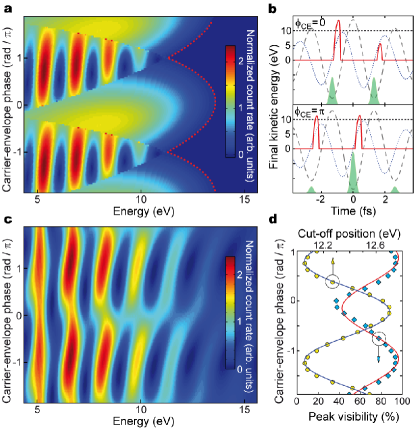
We interpret our experimental findings with the aid of two theoretical models. The first model employed is the semiclassical Simple Man’s Model (SMM) 22. In brief, an electron is liberated by optically induced tunnelling and subsequently propagates in the laser electric field on classical trajectories. The model has been extended to account for the matter wave nature of liberated electrons by including the accumulated quantum mechanical phase of the corresponding wavepackets 23. Trajectories with different start times within the pulse that lead to the same final energy interfere, resulting in interference structures in the energy domain 24.
In Fig. 3a we present SMM spectra similar to Fig. 2b assuming a 6.3-fs pulse with a peak electric field of . All main features of the experimental data are qualitatively reproduced, notably the shift of the cut-off position and the correlated change in peak visibility. A region is observed where no spectral interference occurs, centered around corresponding to a “cosine-like” pulse. Simultaneously, the cut-off position is located at the highest energy. Fig. 3b illustrates the physical origin of both effects for : Only a single trajectory from one optical half-cycle, reaching the highest possible kinetic energy, yields a significant contribution. In contrast, the region around , which corresponds to a “minus-cosine-like” pulse, exhibits the strongest peak structure and the lowest cut-off energy. Two trajectories from subsequent cycles contribute here with the time instants of both emission and rescattering differing approximately by the duration of an optical cycle . This translates into interference fringes in the energy domain with a spacing of eV, about the photon energy 23. A similar behaviour was demonstrated for strong-field photoemission from atomic gases 24, and also in Ref. 25 where the generation of single sub-femtosecond XUV radiation bursts was deduced from the absence of interference in the cut-off region of the XUV spectrum. Accordingly, single electron matter wavepackets with initially sub-femtosecond emission duration (Fourier limit of cut-off part 450 as) can be generated from a metallic tip by appropriately setting the C-E phase. Moreover, the timing of emission and propagation of electron wavepackets undergoing re-scattering near the metal surface can be controlled with a precision of 80 as by changing the C-E phase, as inferred from the fit error of the phase offset in the sinusoidal fits to cut-off and visibility. The presence of interference indicates the coherent nature of the re-scattering process off a metal surface, which has not been reported before.
The second model, a fully quantum mechanical treatment, shows decent quantitative agreement with the experiment. In Fig. 3c we present energy spectra retrieved from a numerical integration of the one-dimensional time-dependent Schrödinger equation (TDSE) 15. The parameters were adapted to match the experimental data (see Supplementary Information for details). The average peak visibility and the cut-off position are depicted in Fig. 3d and behave similarly compared to the experimental data. We have shifted the C-E phase axis of the experimental data so that the maxima of the cut-off position curves coincide, thereby zeroing the experimental phase offset. Thus, the pulse is cosine-like () for the C-E phase offset of . The spectral shift of the cut-off with C-E phase in the TDSE model is a weaker effect (peak-to-peak eV) than in the experimental data (peak-to-peak eV, cf. Fig. 3d and Fig. 2b) mainly because strong smoothing had to be applied to the TDSE spectra in order to suppress effects caused by the pronounced peak structure. The SMM model (Fig. 3a), in contrast, reveals a larger shift (peak-to-peak eV) mainly due to its semiclassical nature. Given the simplicity of the models, the agreement is satisfactory.
The peak visibility is lower in the experiment than in both theoretical treatments, which we attribute to the spectrometer resolution and low counting statistics. Moreover, in both models we consider only a single initial electronic state at the Fermi level. A metal, however, comprises many populated states with a large spread of initial energies. In future work, a more elaborate simulation 7, 8 is needed to fully take this as well as possible plasmonic effects into account and to use the technique to draw conclusions about the underlying sub-femtosecond dynamics.
Three points are noteworthy. The observable C-E phase of the enhanced field at the tip’s surface should be phase-shifted with respect to the phase of the driving laser field due to the plasmonic response of the metal 8, 12. Spectra measured from a tip with strong plasmonic behaviour such as a silver tip will thus allow obtaining information of the collective electron response on the (sub-) nanometre–sub-femtosecond scale. Second, in the SMM an emission process according to optically induced tunnelling has been assumed, with the electrons’ classical trajectories starting at the tunnel exit with zero initial momentum 6, 26 and with an emission probability modelled along the lines of the ADK rate (see Supplementary Information). We also tried other emission processes (non-adiabatic tunnelling 27, multiphoton photoemission) but found the best agreement using tunnelling, although here the Keldysh parameter is 2. We stress that in this parameter range the emission process encompasses and cannot be separated from strong-field effects after the electron has been born classically. Third, while the comprehensive understanding of the exact quantum dynamics of electrons in this new system is complex and requires much further investigation, it has become clear from experiments with neutral atoms 21 and negatively charged ions 28 that the re-scattering scenario and the concomitant telltale plateau seem to be universal in the sense that they exist despite qualitatively different potentials (long 21 vs. short range 28). First theoretical work on photoemission from metals also hints in this direction 29. Our experimental results bear strong evidence for very similar underlying physics, even though here the dimensions involved are wholly different than in the atom or ion case: The electron source and scatterer, namely the solid tip, is much larger than the classical oscillation amplitude of the electron in the laser field (a few angstrom). It will be interesting to investigate what the implications are. For example, does scattering take place at the extended surface or at individual surface atoms? Does this depend on the material and its orientation? Angle-resolved spectra might yield information.
With longer laser wavelengths, the energy of the re-colliding electron increases and can surpass several ten electronvolts. Hence, new forms of (time-resolved) surface science techniques such as low-energy electron diffraction (LEED), with electrons originating from and probing the surface, might come into reach, with typical time scales of 100 as. Extending this work towards more complex, lithographically grown nano-objects 11, 30 will pave the way towards lightwave electronics, where the light electric field steers electrons and thereby, for example, can switch between the conducting or insulating state between a source and a drain structure. Also, a simple record-sensitive stand-alone die-sized sensor device for the C-E phase, comprising of a tip, a retardation grid, and an electron multiplier, might result.
References
- 1 Corkum, P. B. & Krausz, F. Attosecond science. Nat. Phys. 3, 381–387 (2007).
- 2 Antoine, P., L’Huillier, A. & Lewenstein, M. Attosecond pulse trains using high-order harmonics. Phys. Rev. Lett. 77, 1234–1237 (1996).
- 3 Goulielmakis, E. et al. Single-cycle nonlinear optics. Science 320, 1614–1617 (2008).
- 4 Niikura, H. et al. Sub-laser-cycle electron pulses for probing molecular dynamics. Nature 417, 917–922 (2002).
- 5 Baker, S. et al. Probing proton dynamics in molecules on an attosecond time scale. Science 312, 424–427 (2006).
- 6 Huismans, Y. et al. Time-resolved holography with photoelectrons. Science 331, 61–64 (2011).
- 7 Lemell, C., Tong, X.-M., Krausz, F. & Burgdörfer, J. Electron emission from metal surfaces by ultrashort pulses: Determination of the carrier-envelope phase. Phys. Rev. Lett. 90, 076403 (2003).
- 8 Stockman, M. I. & Hewageegana, P. Absolute phase effect in ultrafast optical responses of metal nanostructures. Appl. Phys. A 89, 247–250 (2007).
- 9 Stockman, M. I. Nanofocusing of optical energy in tapered plasmonic waveguides. Phys. Rev. Lett. 93, 137404 (2004).
- 10 Goulielmakis, E. et al. Attosecond control and measurement: Lightwave electronics. Science 317, 769–775 (2007).
- 11 Novotny, L. & van Hulst, N. Antennas for light. Nat. Phot. 5, 83–90 (2011).
- 12 Kim, S. et al. High-harmonic generation by resonant plasmon field enhancement. Nature 453, 757–760 (2008).
- 13 Bucksbaum, P. H. The future of attosecond spectroscopy. Science 317, 766–769 (2007).
- 14 Apolonski, A. et al. Observation of light-phase-sensitive photoemission from a metal. Phys. Rev. Lett. 92, 073902 (2004).
- 15 Hommelhoff, P., Kealhofer, C. & Kasevich, M. A. Ultrafast electron pulses from a tungsten tip triggered by low-power femtosecond laser pulses. Phys. Rev. Lett. 97, 247402 (2006).
- 16 Cavalieri, A. L. et al. Attosecond spectroscopy in condensed matter. Nature 449, 1029–1032 (2007).
- 17 Yanagisawa, H. et al. Optical control of field-emission sites by femtosecond laser pulses. Phys. Rev. Lett. 103, 257603 (2009).
- 18 Bormann, R., Gulde, M., Weismann, A., Yalunin, S. V. & Ropers, C. Tip-enhanced strong-field photoemission. Phys. Rev. Lett. 105, 147601 (2010).
- 19 Schenk, M., Krüger, M. & Hommelhoff, P. Strong-field above-threshold photoemission from sharp metal tips. Phys. Rev. Lett. 105, 257601 (2010).
- 20 Kealhofer, C., Foreman, S. M., Gehrlich, S. & Kasevich, M. A. Ultrafast laser-triggered emission from hafnium carbide tips. Phys. Rev. B (submitted); preprint at http://www.arxiv.org/abs/1104.1452 (2011).
- 21 Paulus, G. G., Nicklich, W., Xu, H. L., Lambropulos, P. & Walther, H. Plateau in above-threshold ionization spectra. Phys. Rev. Lett. 72, 2851–2854 (1994).
- 22 Corkum, P. B. Plasma perspective on strong-field multiphoton ionization. Phys. Rev. Lett. 71, 1994–1997 (1993).
- 23 Milošević, D. B., Paulus, G. G., Bauer, D. & Becker, W. Above-threshold ionization by few-cycle pulses. J. Phys. B: At. Mol. Opt. Phys. 39, R203–R262 (2006).
- 24 Lindner, F. et al. Attosecond double-slit experiment. Phys. Rev. Lett. 95, 040401 (2005).
- 25 Baltuška, A. et al. Attosecond control of electronic processes by intense light fields. Nature 421, 611–616 (2003).
- 26 Zherebtsov, S. et al. Controlled near-field enhanced electron acceleration from dielectric nanospheres with intense few-cycle laser fields. Nat. Phys. (in press); advance online publication at http://dx.doi.org/10.1038/nphys1983 (2011).
- 27 Yudin, G. L. & Ivanov, M. Y. Nonadiabatic tunnel ionization: Looking inside a laser cycle. Phys. Rev. A 64, 013409 (2001).
- 28 Gazibegović-Busuladžić, A. et al. Electron rescattering in above-threshold photodetachment of negative ions. Phys. Rev. Lett. 104, 103004 (2010).
- 29 Faisal, F. H. M., Kamiński, J. Z. & Saczuk, E. Photoemission and high-order harmonic generation from solid surfaces in intense laser fields. Phys. Rev. A 72, 023412 (2005).
- 30 Aeschlimann, M. et al. Adaptive subwavelength control of nano-optical fields. Nature 446, 301–304 (2007).
Acknowledgements
We thank M. Kling, C. Lemell, G. Wachter, and B. Bergues for discussions and J. Hoffrogge for proofreading. This work has been supported in part by the European Union (FP7-IRG).
Author Contributions
All authors contributed to all parts of the work.
Author Information
Correspondence and requests for materials should be addressed to P.H. (peter.hommelhoff@mpq.mpg.de).