Synthesis, crystal structure and magnetism of -Fe1.00(2)Se1.00(3) single crystals
Abstract
Understanding iron based superconductors requires high quality impurity free single crystals. So far they have been elusive for -FeSe and extraction of intrinsic materials properties has been compromised by several magnetic impurity phases. Herein we report synchrotron - clean -FeSe superconducting single crystals grown via LiCl/CsCl flux method. Phase purity yields evidence for a defect induced weak ferromagnetism that coexists with superconductivity below Tc. In contrast to Fe1+yTe - based superconductors, our results reveal that the interstitial Fe(2) site is not occupied and that all contribution to density of states at the Fermi level must come from in-plane Fe(1).
pacs:
74.70Xa, 61.72y, 74.62Dh, 74.62BfI Introduction
The physics of complex superconductors, such as the cuprates and iron-based superconductors, cannot be understood unless pure, high quality materials are available that allow the intrinsic properties to be separated from extrinsic and impurity effects. In FeAs and Fe(Se)Te, just as in high-Tc cuprate and heavy fermion materials, competing or coexisting magnetic order is closely associated with superconductivity. Mazin1 This suggests proximity to a magnetic critical point and an unconventional origin of superconductivity where spin fluctuations may contribute to pairing. Mazin3 ; Kuroki ; Drew The observation of weakly localized rather than itinerant magnetism sensitive to structural changes raises the fundamental question of how strongly correlated are the charges in Fe superconductors and what is the origin of the magnetic order? Cvetkovic ; YangW ; Bao1 Of particular interest is superconducting -FeSe, a compensated semimetal, without a crystallographic charge reservoir, that superconducts at about 8 K without any carrier doping.Hsu It has a giant pressure coefficient of of 9.1 K/GPa enhancing Tc up to a maximum of 37 K, the third highest known critical temperature for any binary compound.Medvedev
A major obstacle in understanding intrinsic magnetism in -FeSe has been the purity of the material itself. Magnetic impurities such as -FeSe, Fe7Se8, Fe3O4 and elemental Fe are ubiquitous in all as-grown crystals and sometimes polycrystals.Zhang ; Patel ; McQueen ; Phelan They contribute to the large ferromagnetic (FM) background, seen in the M-H loops below superconducting Tc. Modification of the original Fe-Se phase diagram near 1:1 stoichiometry suggested that -FeSe is not stable at the room temperature since it converts to hexagonal -FeSe below 300∘C.McQueen ; Okamoto Consequently, the absence of an exposed liquidus surface in the binary alloy phase diagram and the metastable nature of the superconducting FeSe are considered to be prohibitive and insurmountable factors for single crystal preparation using standard synthesis methods.
Here we describe a synthetic approach that yields stoichiometric and phase pure material and we report intrinsic structural and magnetic properties of superconducting -FeSe. These include evidence for defect - induced weak ferromagnetism (WFM) and the absence of interstitial Fe(2) whose occupancy governs the magnetic and structural phase diagram in isostructural Fe1+yTe.Bao1
II Experiment
Powders of LiCl and CsCl, elemental Fe and Se were added together with the flux into an alumina crucible and sealed under partial Ar atmosphere. The ampoule was heated to a homogenization temperature of 715∘C, where it was kept for 1 h and then removed into a preheated furnace at 457∘C. After slow cooling to 300∘C, it was quenched in water.
Medium resolution, room temperature (300 K) X-ray diffraction measurements were carried out at X7B beam-line at National Synchrotron Light Source (NSLS) at the Brookhaven National Laboratory, using a 0.5 mm2 monochromatic beam of 38.92 keV ( = 0.3184 Å). Pulverized sample was filled into a 1 mm diameter cylindrical Kapton capillary and the data collection was carried out in a forward scattering geometry using a Perkin Elmer 2-D detector mounted orthogonal to the beam path 378.3 mm away from the sample.
Single crystals of -FeSe were also mounted on glass fibers for examination using an Oxford - Diffraction Xcalibur 2 CCD 4-circle diffractometer with graphite monochromated MoK radiation. Elemental and microstructure analysis were performed on several -FeSe crystals as well as on the particular crystals chosen for resistivity and magnetization using energy-dispersive X-ray spectroscopy in a JEOL JSM-6500 scanning electron microscope (SEM).
Sample dimensions were measured with an optical microscope Nikon SMZ-800 with 10 m resolution and M/H values were corrected for straw background at each (T,H) of the measurement, real sample volume and demagnetization factor. Thin Pt wires were attached to electrical contacts made of Epotek H20E silver epoxy for a standard four-probe measurement with current flowing in the (101) plane of the tetragonal structure. Magnetization and resistivity measurements were carried out in a Quantum Design MPMS and PPMS respectively.
III Results
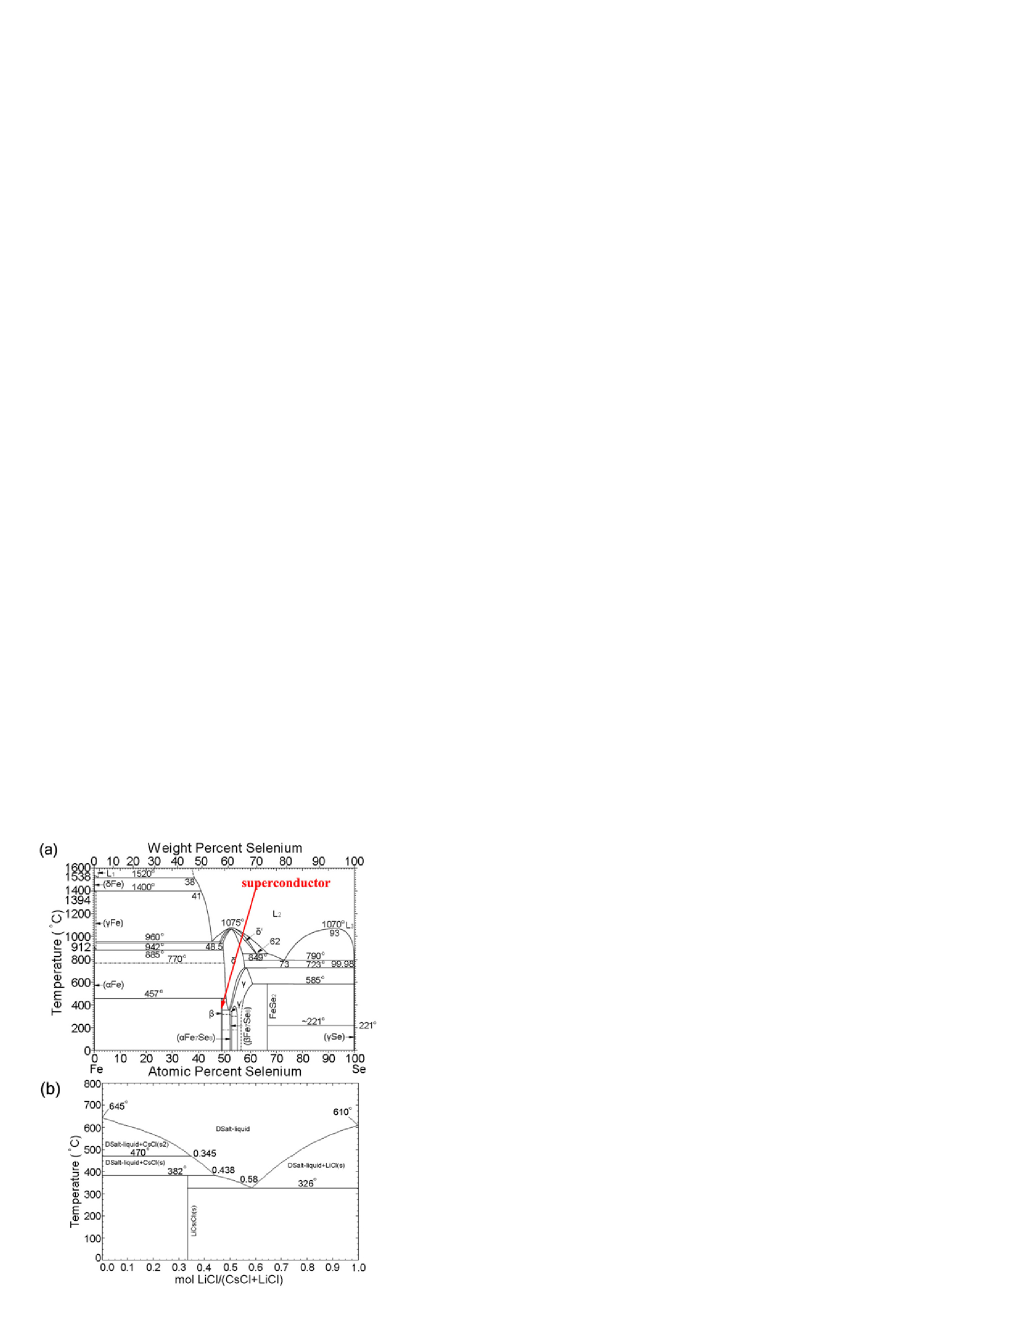
Fig. 1 shows Fe-Se and LiCl-CsCl phase diagrams.Okamoto ; Chartrand The superconducting PbO-type -FeSe is a low temperature crystallographic phase that decomposes into Fe and hexagonal NiAs phase (-FeSe) at 457∘C (Fig. 1(a)). It coexists with hexagonal -Fe7Se8 below 300∘C for certain Fe-Se stoichiometry.Okamoto Previous attempts (for example Refs. 10, 11, 16) to prepare single crystals of -FeSe involved nucleation and growth using KCl/NaCl flux or vapor transport reactions. We choose a LiCl - CsCl flux method of synthesis due to the presence of a low temperature eutectic at 326∘C, well below the decomposition temperature of -FeSe.Chartrand The crystal growth possibly includes nucleation of Fe7Se8 above 700∘C and structural phase transition at low temperatures. As opposed to crystals grown in KCl,Mok the low temperature eutectic (Fig. 1(b)) allows for complete transition to tetragonal -FeSe from (457 - 300)∘C in a large fraction of crystals grown in a batch. Platelike FeSe crystals with the (101) plane exposed and elongated in one direction up to 1.5 0.5 0.05 mm3 can be separated by dissolving the flux in de-ionized water and rinsing in ethanol.
Crystals of -FeSe were separated from -Fe7Se8 by a combination of a permanent magnet and a powder X - ray diffraction (XRD) spectra from a Rigaku Miniflex with CuK radiation ( = 1.5418 Å). We observed only (h0l) peaks (Fig. 2) of the tetragonal phase in selected crystals for further analysis (Fig. 2 inset). Crystals contaminated with Fe7Se8 and/or oxides showed additional peaks in the spectra.
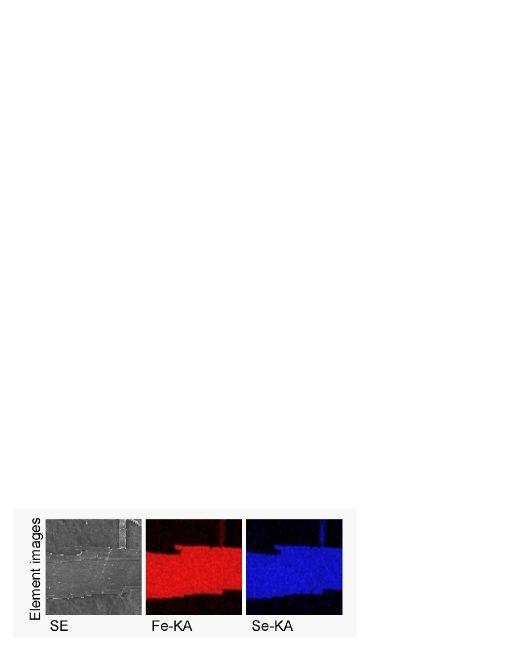
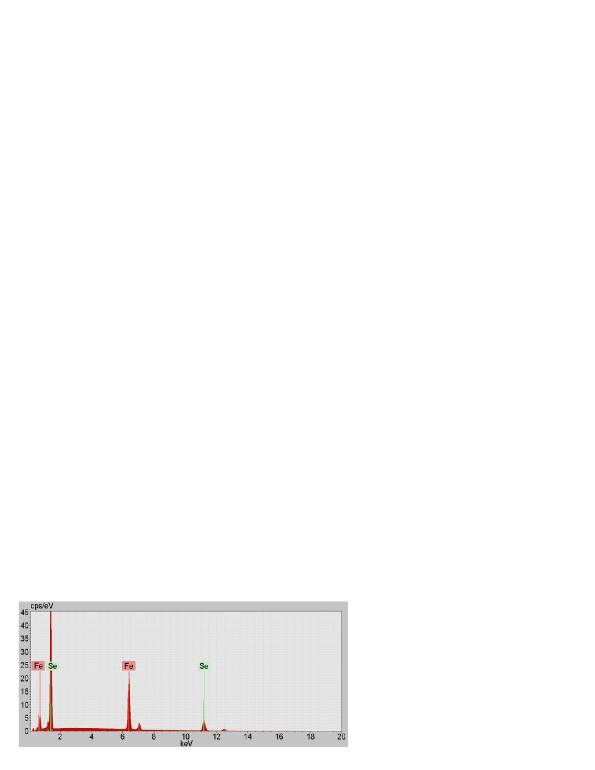
Fig. 3 and Fig. 4 show electron density maps and elemental analysis of as-grown -FeSe single crystals. The relative stoichiometry of multiple points on the as-grown crystals were measured and a composition of Fe0.99(4)Se was obtained. Electron density maps of these crystals confirmed a uniform distribution of Fe and Se.
Crystals are moderately air sensitive. After one week of air exposure, a selenium oxide layer is visible on the crystal surface. After about a month of air exposure Fe3O4 is detectable in laboratory X-ray diffraction (XRD) and by the observation of a Verwey transition in M(T).Yang The first attempts to carry out synchrotron XRD experiments on samples that were exposed to air for several months revealed the presence of multiple additional phases including appreciable amounts of several selenium oxide and iron oxide phases. It has been found that while pure stoichiometric FeSe crystals can be grown, these tend to degrade through oxidation over the course of time. This suggests that the surface of FeSe crystals may be Se-terminated and that selenium oxide forms first, with further degradation involving iron oxide phases or Fe2[SeO3]2O as well. Results reported here are based on samples whose exposure to air was minimized, and only traces of selenium oxide were found in crystals that were pulverized for the powder XRD experiments.
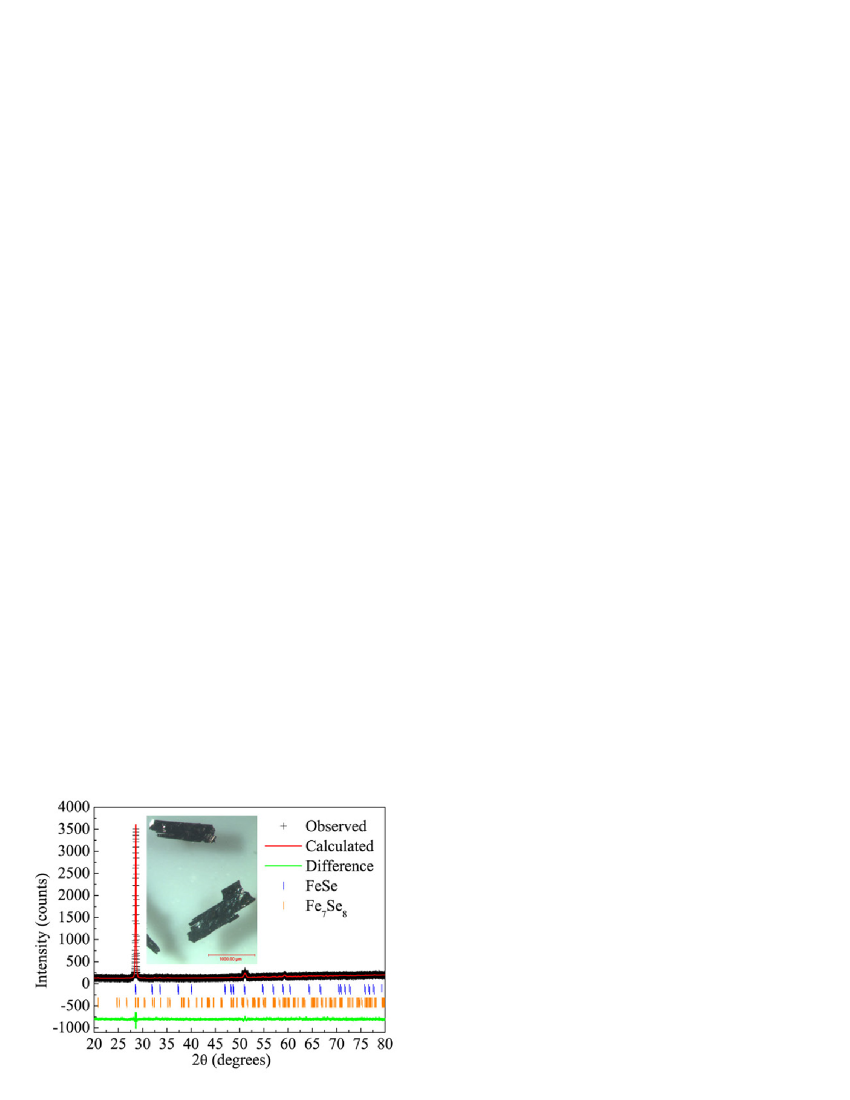
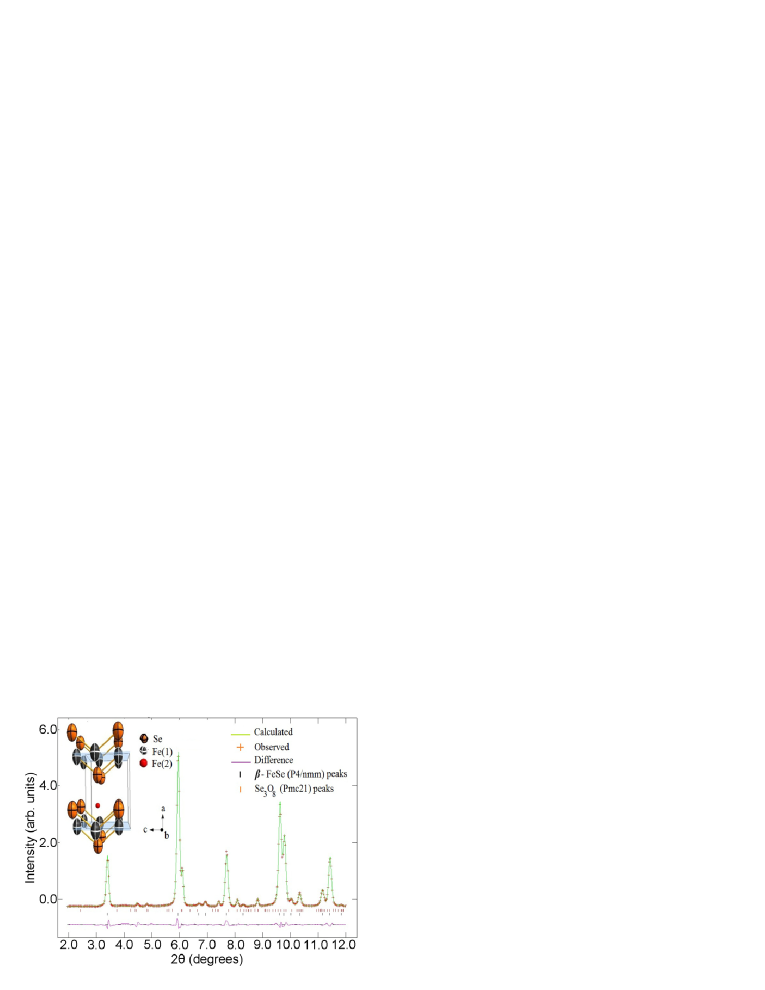
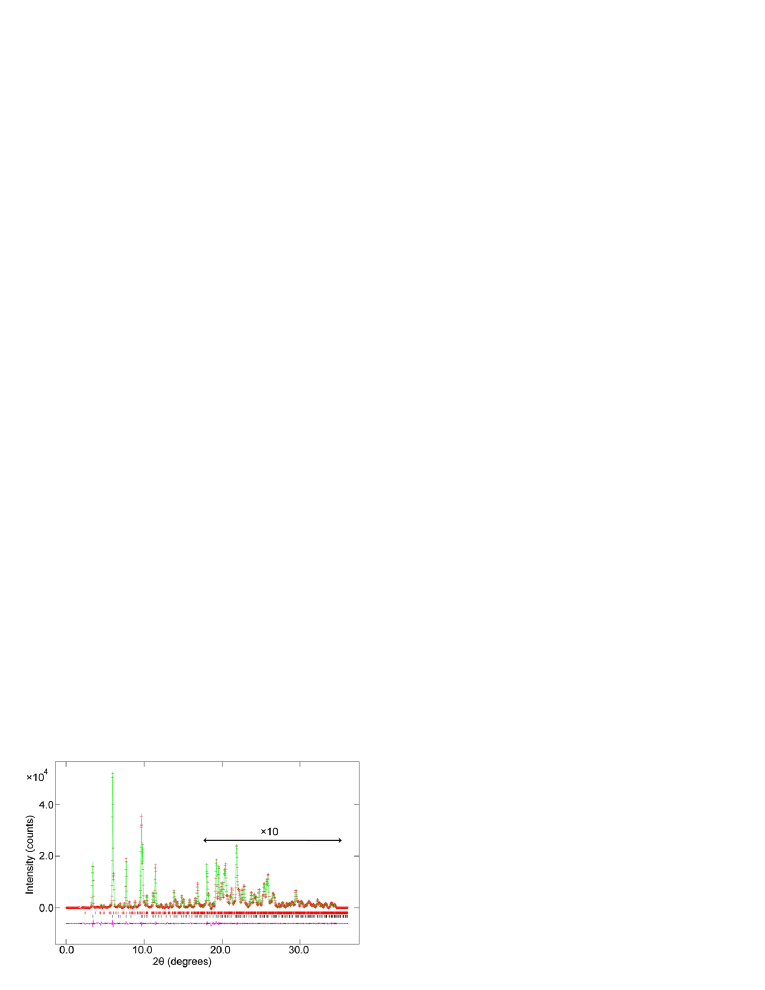
Synchrotron powder XRD data of FeSe sample were successfully refined using a two phase structural model (Fig. 5). The best fit contained 96.1 mol% (90.7 wt%) of FeSe of P4/nmm space group, with a = 3.7622(2) Å, c = 5.5018(5) Å, with Se at (1/4,1/4,0.2624(1)) and Fe at (3/4,1/4,0). Compared to the high Tc stoichiometric polycrystalline -FeSe,McQueen ; LiZ the unit cell parameters are reduced by 0.3% (a -axis) or 0.4% (c-axis), whereas c/a is smaller or identical. The anisotropic atomic displacement parameters (ADP) ratio U33/U11 is the ratio of thermal vibrations along crystallographic c and a axes in tetragonal strucutre. The U33/U11 was 1.12 for Se and 1.41 for Fe. To illustrate this, anisotropic ADP’s are shown as exaggerated thermal ellipsoids in Fig. 5 inset. In Van der Waals bonded crystals, such as FeSe, U33/U11 ADP ratio is expected to be larger than 1 and the observed ratios are within the expected range. A somewhat larger ADP ratio of Fe, 1.41, suggests that it is underbonded and can move along the c-axis. The FeSe4 units are found to deviate from perfect tetrahedra, with an Fe-Se distance of 2.379(5) Å, and tetrahedral angles of 104.5(5) and 112.0(5) degrees. The anisotropic ADP ratio (tetrahedral angles) are smaller (equal) than the values obtained for -FeSe polycrystals on powders containing several magnetic impurity phases.McQueen ; Margadonna ; Margadonna2 However, the anisotropic ADP ratio observed here is similar to values found in pure Fe1.08Te.Onoda As expected, the observed tetrahedral bond angles deviate from the ideal tetrahedral angle found in iron based superconductors with optimal Tc.Kimber The second phase, constituting 3.9 mol% (9.3 wt%), was found to be Se3O8 with Pmc21 space group with the refined lattice parameters a = 4.977(1) Å, b = 4.388(2) Å, c = 15.377(2) Å. No other phases were observed. Within the main phase we investigated in detail the issue of stoichiometry and occupancy of the interstitial site, Fe(2) at (3/4,3/4,z) (Fig. 5 inset). The stoichiometry was found to be Fe1.00(2)Se1.00(3).
Difference Fourier analysis (DFA) is a standard method to find missing electron densities in refined atomic structures. In this technique, the difference between the observed and the calculated (model based) Fourier maps is used to locate missing atoms in atomic structures. In this study, DFA did not reveal any appreciable electron density at the interstitial Fe(2) positions. Attempts to explicitly refine Fe(2) site occupancy yielded 0.00(1), in agreement with the DFA and strongly suggesting that no iron resides on this site. However, DFA indicated a possibility for additional electron density in the vicinity of Se. This, along with the observation of relatively large anisotropic ADPs (U33) of Se and Fe, may point to the presence of static and/or dynamic disorder associated with these sites. A small number of Se vacancies may lead to relaxation of the surrounding Fe atoms, resulting in static and/or dynamic disorder.
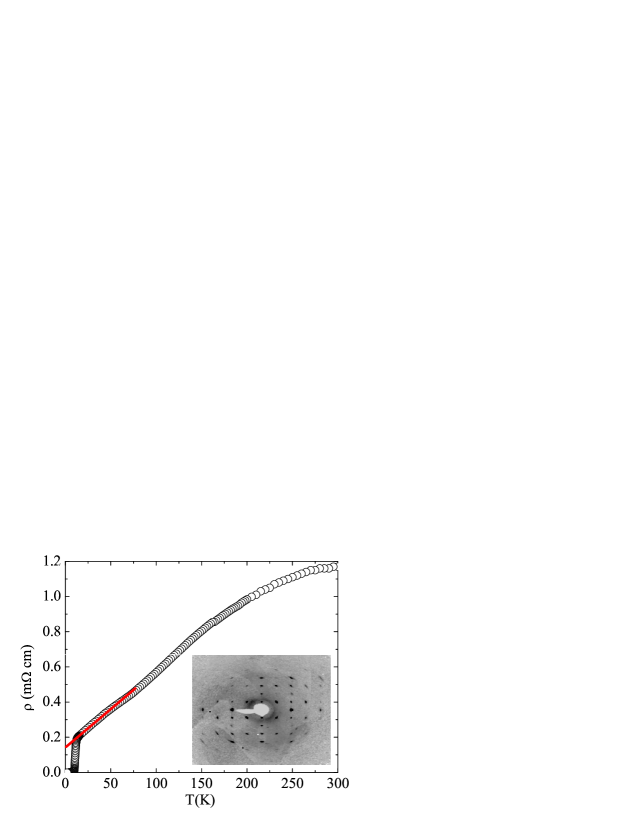
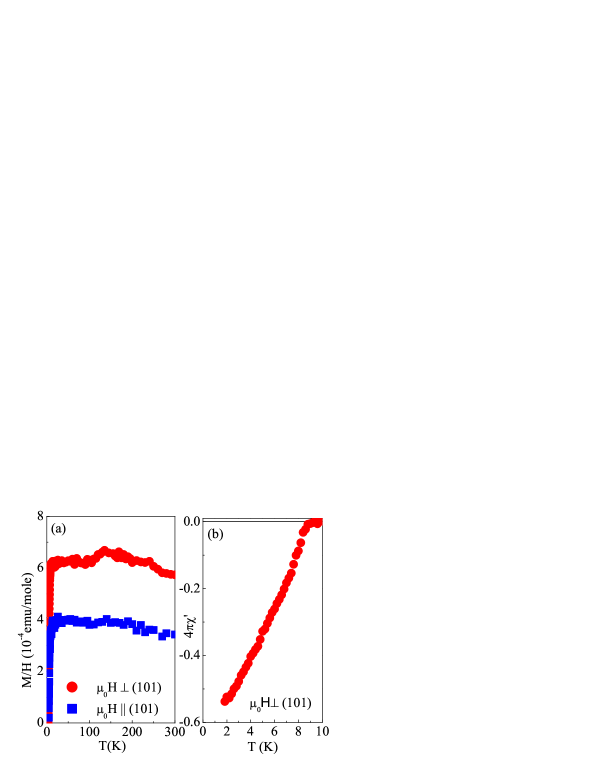
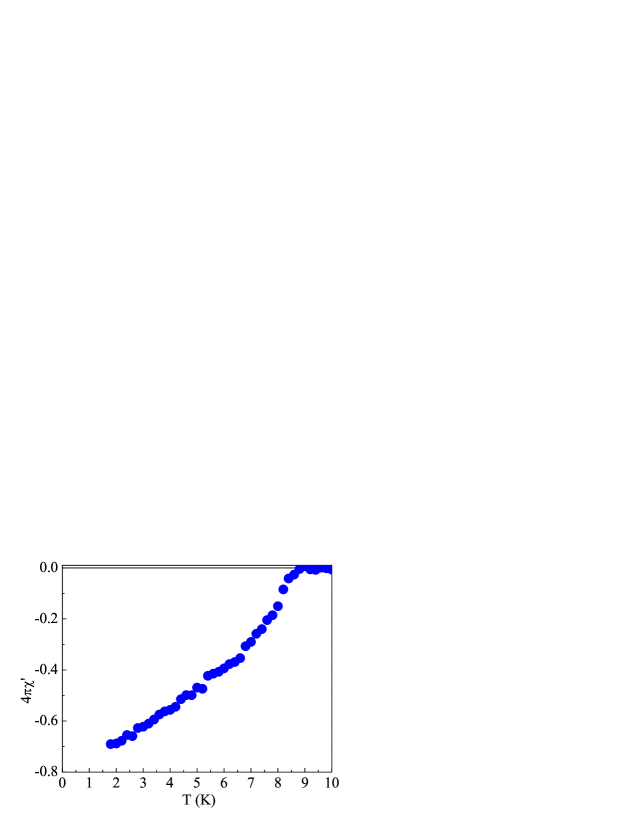
The resistivity (T) of LiCl/CsCl flux grown crystals smoothly changes to linear at low temperature where the onset of Tc and zero resistivity were observed at temperatures about 1 K or more higher than in polycrystals (Fig. 6).Hsu The residual resistivity ratio (RRR) of 14 indicates good crystal quality whereas the single crystal diffraction pattern shows no impurities present. Reciprocal space planes (hk0) and (h0l) were reconstructed from several series of CCD frames (inset in Fig. 6). A mosaic structure is observed perpendicular to the c - axis, consistent with the arrangement of FeSe layers in the structure. The observed X-ray reflections are all consistent with the -FeSe structure. M/H exhibits weak temperature dependence for both H (101) and H(101) (Fig. 7(a)). Below 135 K the M/H signal drops and then remains constant below the structural transition temperature K.Hsu This is more pronounced for H (101). Low temperature M/H taken in H = 10 Oe confirms superconductivity (Fig. 7(b)) below 9.0(2) K. Extrapolation of 4 data to T = 0 gives about 60 % of diamagnetic screening. Complete transition and partial superconducting volume fraction have been observed in SmFeAsO1-xFx and CaFe1-xCoxAsF,Drew ; Takeshita where temperature dependent magnetic moment coexists and inversely scales with the superconducting volume fraction.
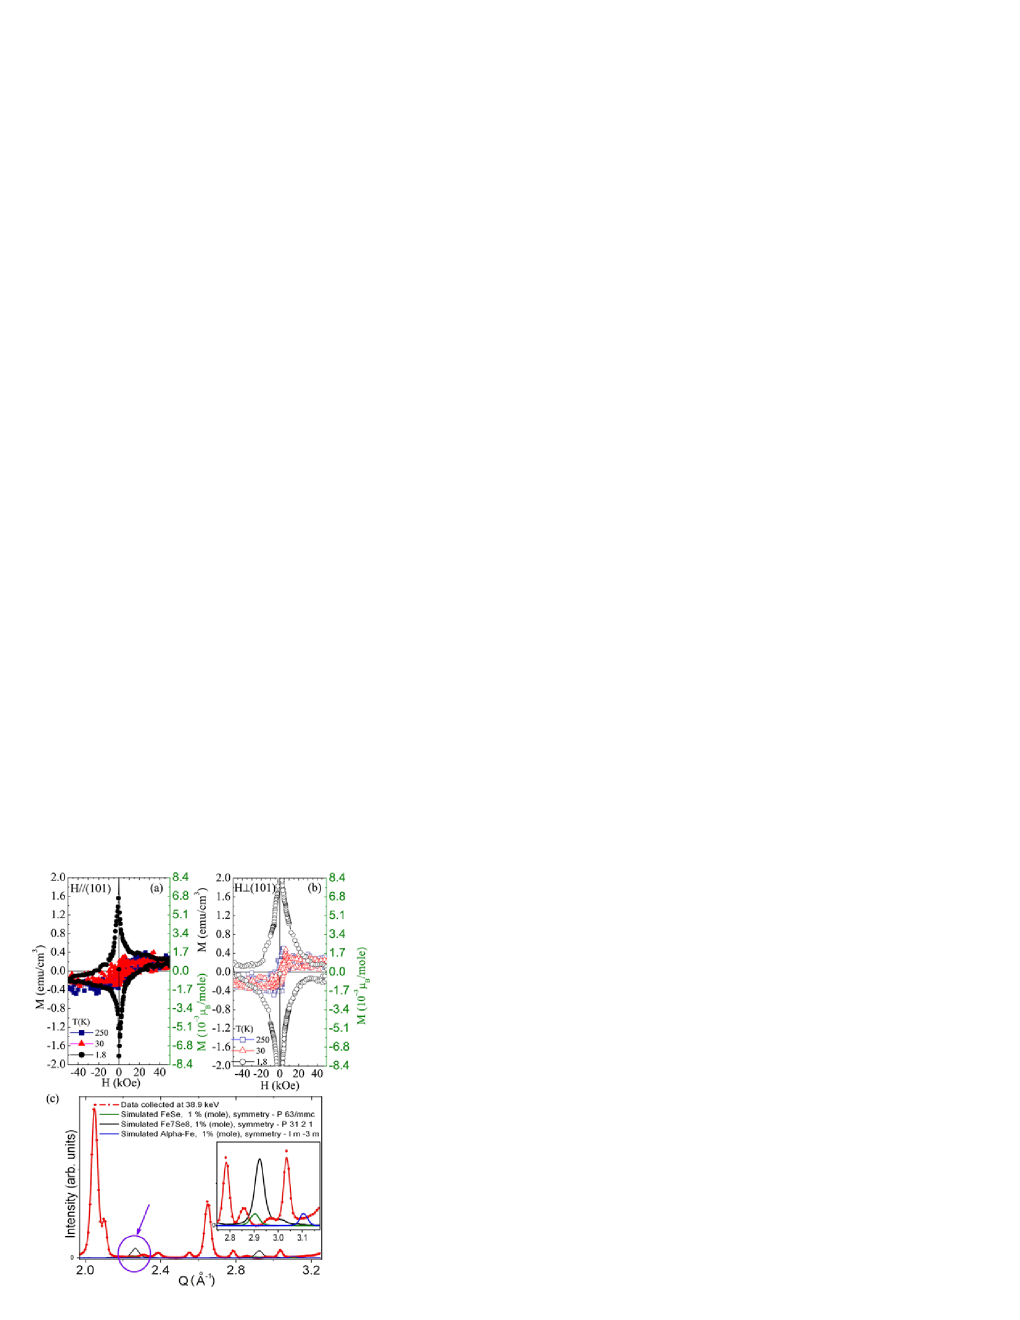
In -Fe1.01Se polycrystals contaminated with magnetic impurity phases a static moment was found above 1 GPa, Bendele was ascribed to traces of Fe impurity at ambient pressure due to its weak nature,Khasanov ; Fedorchenko or was not detected. Medvedev ; Imai In our crystals, s - shape of M(H) for H(101) (Fig. 8(a) is typical of a type-II superconductor with a superimposed isotropic weak ferromagnetic (WFM) moment both above and below Tc.Patel In contrast, the M(H) curves are symmetric for H (101) at T = 1.8 K (Fig. 8(b) within the experimental resolution (0.05 emu/cm3) with no evidence for WFM below Tc.
IV Discussion
Is the observed WFM intrinsic or extrinsic? Fig. 8(c) shows background-subtracted data compared to a simulated pattern for 1 mole % of commonly found magnetic phases. Based on the scattering power and distribution of peaks in our synchrotron powder XRD we can exclude contamination by -FeSe and Fe7Se8 (Fig. 8(c) and Appendix A), leaving only elemental Fe, or some unknown ferromagnetic phase with lattice periodicity commensurate with -FeSe, Mang as a possible source of magnetic contamination. By focusing on information sensitive to the total number of Fe ions in a given volume we make several observations that support the intrinsic WFM scenario in as-grown crystals. Mössbauer quadrupole splittings and isomer shifts for binary Fe-Se materials differ by up to a factor of 4 whereas the signal component originating in the -FeSe phase dominates the Mössbauer spectrum below room temperature in 50 kOe even for the sample containing more than 6 mole % of -FeSe, Fe3O4 and elemental Fe impurities.McQueen ; KimE ; Blachowski Moreover, the coercive field of bulk Fe or Fe nanoparticles (Hc (0.4 - 2.5) kOe)is several orders of magnitude lower than in Fig. 8(a,b) (15 kOe).Brown ; Carvell Furthermore we observe the signature of the structural phase transition in the normal state (Fig. 7(a)), implying that a considerable fraction of the M(T) signal must come from the -FeSe. Finally, WFM due to an unknown Fe - based high Tc ferromagnetic phaseMang is unlikely to have Hc in kOe range and is expected to provide an isotropic constant (or increasing) background (bias) to M(H) loops both above and below Tc, as in ref. 11. This is in contrast to anisotropic M(H) below Tc (Fig 8(a,b)). Note that M(H) in Fig. 8(b) is symmetric with respect to the M = 0 line. This suggests that most of WFM signal in -FeSe crystals is unrelated to extrinsic impurities. The WFM signal is well reproduced in several crystals grown in one batch and in crystals grown from multiple batches, whereas the magnitude of WFM increases in time (Appendix B).
The proposed spin-density-wave (SDW) mechanism of magnetic order may not apply to iron chalcogenides and perhaps it could be more complex even for iron pnictides.Balatsky ; Yin Density functional calculations indicate that magnetic state with 0.15 /mole is induced in Fe1-xSe for = 0.0625.Li2 The saturation moment observed (Fig 8(a,b)) is about 1/150 smaller and would correspond to an Fe deficiency of less than 0.4 atomic %, a value below resolution limit of our diffraction measurement. However, in this calculation Li2 the partial density of states (PDOS) of Fe(2) dominates the total density of states (DOS) and, more importantly, the stoichiometry variation. Negligible occupancy of Fe(2) within experimental error in our crystals implies that Fe nonstoichiometry is not the dominant mechanism of WFM. On the other hand, it is possible that some fraction of the WFM arises due to a Se vacancy induced magnetic cluster.Lee The Se – Se distances are Van der Waals distances and may produce Se – Se time dependent bonding. We cannot distinguish between static and dynamic displacements but since the refinement results are giving 1:1 stoichiometry, then vacancies could be equally distributed on both sites. In particular, theory predicts that the main effect of Se displacement would be to shift Fe(1) towards the vacant site, shifting the Fermi level EF into a sharp peak in the DOS that would promote a more stable magnetic state than in material without Se defects.Lee The net moment at 1.25 mole % Se deficiency is expected to be in 10-2 /mole range. This is arising from both Fe(1) and Fe(2) contributions. Since the theoretical contribution of Fe(2) PDOS at the Fermi level is about 50% of the total DOS,Lee the calculated moment is somewhat higher but generally in line with the observed (1.00.5)10-3 /mole above Tc in our crystals with neglibible Fe(2) occupancy. This is different from most FeAs superconductors where small moment magnetic order from a SDW mechanism is found below the structural transition. This is also different from Fe1+yTe where subtle crystal chemical effects, with both Fe(1) and Fe(2) occupied, induces WFM and structural and magnetic differences below the magnetostructural transition at 75 K - 55 K.Bao1 Since lattice distortions were also recently foundSaha to induce both superconducting and magnetic phases in SrFe2As2, this suggests that nanoscale defects and short range structural features are important in a wider class of iron based superconductors. Indeed, there is emerging evidence that both conducting and magnetic properties in the recently discovered KxFe2-ySe2 superconductors are governed by Fe vacancies. Bao2 ; Bao3 In -FeSe, defect - induced magnetism coexists with superconductivity that sets in far below Tc. Though rather unlikely, our analysis allows for some contribution of different impurity phase to WFM. The unknown high temperature FM phase would be present in quantities too small to detect by diffraction and/or would have the lattice periodicity commensurate with -FeSe and its moment would anisotropically diminish between 30 K and 1.8 K.
In summary, single phase superconducting single crystals of -FeSe have been synthesized. Unlike isostructural Fe1+yTe, the Fe(2) site is not occupied at all in these samples. The ADP anisotropy is consistent with dynamic disorder/defects associated with Fe and Se sites and/or Se vacancies. We present evidence for intrinsic defect induced WFM which anisotropically diminishes with an increase in the superconducting volume fraction.
V Acknowledgments
We thank Sang-Wook Cheong and Hai-Hu Wen for useful discussion and J. C. Hanson for help with XRD measurements. This work was carried out at the Brookhaven National Laboratory, which is operated for the U.S. Department of Energy by Brookhaven Science Associates DE-Ac02-98CH10886. This work was in part supported by the U.S. Department of Energy, Office of Science, Office of Basic Energy Sciences as part of the Energy Frontier Research Center (EFRC), Center for Emergent Superconductivity (CES). A portion of this work was performed at the National High Magnetic Field Laboratory, which is supported by NSF Cooperative Agreement No. DMR-0654118, by the state of Florida, and by the DOE.
VI Appendix A: Magnetic impurities from diffraction
Magnetization measurements were performed on a sample volume V = 4.53210-5 cm3 (a = 0.223476 cm, b = 0.0555613 cm, c = 0.00365025 cm), corresponding to (1.450.23)10-5 emu MPMS signal. Assuming that magnetization (M) of -FeSe is negligible when compared to impurity magnetization, we discuss possible magnetic impurity levels.
First we assume that the sample contains 1 mole % of elemental -Fe since any higher Fe content would have been detected (Fig. 8(c)). In order to obtain volume ratio we need to multiply mole (i.e. formula unit) ratios of Fe and -FeSe by (M/D) where M is the molar mass and D is the density in g/cm3. Using M(Fe) = 55.8 g/mole, D(Fe) = 7.83 g/cm3, M(-FeSe) = 134.8 g/mole, D(-FeSe) = 5.72 g/mole, we get 0.3 volume %.
| (1) |
That would correspond to 1.3710-7 cm3 volume of Fe in our sample. What would be its magnetic contribution? By dividing D/M we get 0.14 mole/cm3 of Fe. In 1.3710-7 cm3 iron volume we have 1.9210-8 mole Fe. Iron saturation moment is 2.2 /mole, therefore that volume would have M = 4.2210-8 . Using conversion factor 5585 emu/ we obtain M = 2.3610-4 emu. This is more than 100 % of raw M (emu) signal in MPMS. Hence, it is possible that Fe impurity content in our crystal (mole % and consequently volume %) is below detection capacity of synchrotron powder X-ray diffraction data since only a fraction of 1 mole % Fe would generate such signal. This is about 0.05 atomic % of Fe.
Similarly, 1 mole % impurity of -FeSe is approximately identical to 1 % volume since -FeSe has the identical molar mass M and 95% of -FeSe density. Therefore 1 % mole -FeSe impurity would correspond to 4.510-7 cm3 volume (using eq. (1)). Applying the same argument as above, 4.510-7 cm3 volume -FeSe contains 1.910-8 mole -FeSe. The -FeSe saturation moment is Ms 0.2 /mole.Hirone Therefore such volume would contribute M = 3.8110-9 . Using conversion factor 5585 emu/ we obtain M = 2.1310-5 emu. Our raw MPMS signal is 70 % that value. However, 0.7 mole % of -FeSe would have been detected, if present (70 % of its peak height, (Fig.8(c), main text)).
Finally, 1 mole % of Fe7Se8 impurity (using M(Fe7Se8) = 1022.59 g/mole, D(Fe7Se8) = 6.43 g/cm3 and eq. (1)) would correspond to 6.75 % of measured sample volume, which is 3.05910-6 cm3. Since the expected Fe7Se8 saturation moment is Ms 80 (emu/cm3)Kamimura we would expect that such volume would contribute with 2.4410-4 . Our raw MPMS emu signal is 6 % of that value, but still above the threshold of scattering power detection in synchrotron experiment. If we multiply the observed intensity of 2.92 Å-1 Fe7Se8 peak (Fig. 8(c) main text) by 0.06, it is still above the background.
VII Appendix B: Reproducibility, impurities and magnetic signal over time
Figure 9 shows Rietveld refinement over the full 2 range with only selenium oxide present due to oxidation.
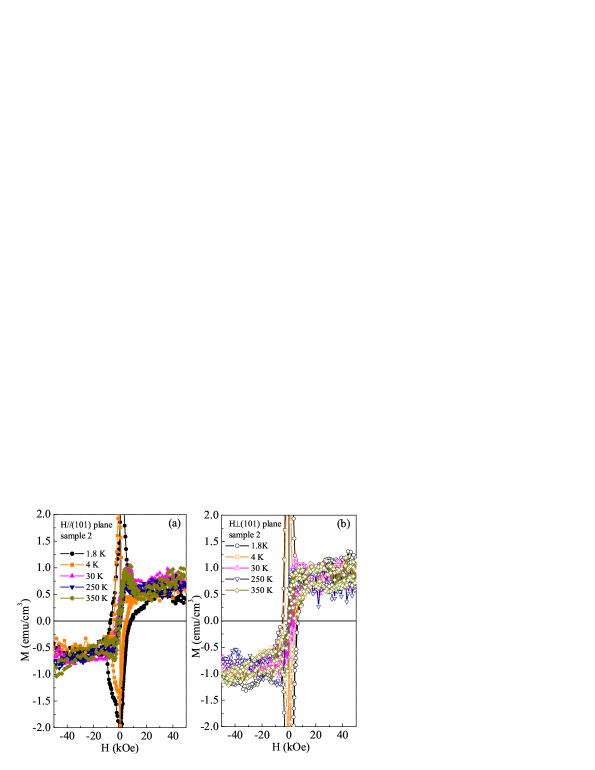
Powder X-ray diffraction taken on single crystals found no extrinsic peaks in 10 out of 10 crystals that were separated by a magnet. Only clean -FeSe single crystals are used in further analysis. Samples that were contaminated by Fe7Se8 (from synthesis or oxidation) showed dominant FM hysteresis loop below Tc with only traces of type-II superconductor MvsH. Resistivity and magnetization data were well reproduced in several independently grown crystals from multiple batches. Both bulk Tc, as measured by 4 and resistive Tc (as defined in the text) varied by Tc = 1 K. This variation is probably due to sample degradation induced by variable air exposure. However, the onset of resistive Tc was always above the bulk. Fig. 10 shows example of superconducting Tc and volume fraction for different, independently grown sample. Figures 11(a) and 11(b) show hysteresis curves below Tc for independently grown crystal from the same batch (sample 2) as the crystal used in the main text (sample 1). Unlike sample 1 (that was measured within a day from the moment of its synthesis), sample 2 was exposed to air for several days. In addition, it was slightly heated when sealing in quartz tube and kept in the low vacuum (several Torr) for about 3 months. Dominant type-II superconducting MvsH hysteresis is evident whereas small WFM is superimposed on the main signal. As expected, the magnitude of WFM signal is about two times larger in sample 2 than in crystal that was exposed to air for shorter time (Fig. 8(a,b), main text). Based on our synchrotron powder X-ray results taken on samples that were exposed to air for several months, the larger WFM magnitude should also originate from Fe - based compounds (impurities) that form over a course of time (see main text). The thickness of sample 2 was identical and ab plane was considerably smaller than sample 1, hence the crystal was more isotropic (a = 0.1535 cm, b = 0.036 cm, c = 0.0036 cm). Larger irreversibility fields are expected when geometric edge barrier for vortex penetration dwarfs pinning at the inhomogeneities of the material. If intrinsic, larger WFM signal in sample 2 is expected to originate from more defects that would cause larger irreversibility field if the bulk pinning on inhomogeneities is dominant. However, for thin superconducting strips geometric (specimen shape dependent) barrier is dominant and larger irreversibility fields are expected for more anisotropic samples.Brandt Both sample 1 and sample 2 are rather thin (c/a = 0.016, c/b = 0.06 for sample 1 and c/a = 0.023, c/b = 0.1 for sample 2), whereas sample 1 is more anisotropic and is expected to have larger irreversibility field.
* Present address: Ames Laboratory US DOE and Department of Physics and Astronomy, Iowa State University, Ames, IA 50011, USA
‡ petrovic@bnl.gov
References
- (1) I. I. Mazin, Nature 464, 183 (2010).
- (2) I. I. Mazin and M. D. Johannes, Phys. Rev. Lett. 101, 057003 (2008).
- (3) K. Kuroki, S. Onari, R. Arita, H. Usui, Y. Tanaka, H. Kontani and H. Aoki, Phys. Rev. Lett. 101, 087004 (2008).
- (4) A. J. Drew, Ch. Niedermayer, P. J. Baker, F. L. Pratt, S. J. Blundell, T. Lancaster, R. H. Liu, G. Wu, X. H. Chen, I. Watanabe, V. K. Malik, A. Dubroka, M. Rössle, K. W. Kim, C. Baines and C. Bernhard, Nature Materials 8, 310 (2009).
- (5) V. Cvetkovic and Z. Tesanovic, Europhys. Lett. 83, 47001 (2008).
- (6) W. L. Yang, W. L. Yang, A. P. Sorini, C-C. Chen, B. Moritz, W.-S. Lee, F. Vernay, P. Olalde-Velasco, J. D. Denlinger, B. Delley, J.-H. Chu, J. G. Analytis, I. R. Fisher, Z. A. Ren, J. Yang, W. Lu, Z. X. Zhao, J. van den Brink, Z. Hussain, Z.-X. Shen and T. P. Devereaux, Phys. Rev. B 80, 014508 (2009).
- (7) Wei Bao, Y. Qiu, Q. Huang, M. A. Green, P. Zajdel, M. R. Fitzsimmons, M. Zhernenkov, S. Chang, Minghu Fang,B. Qian,E. K. Vehstedt, Jinhu Yang, H. M. Pham, L. Spinu and Z. Q. Mao, Phys. Rev. Lett. 102, 247001 (2009).
- (8) F. C. Hsu, Jiu-Yong Luo, Kuo-Wei Yeh, Ta-Kun Chen, Tzu-Wen Huang, Phillip M. Wu, Yong-Chi Lee, Yi-Lin Huang, Yan-Yi Chu, Der-Chung Yan and Maw-Kuen Wu, Proc. Natl. Acad. Sci. USA 105, 14262 (2008).
- (9) S. Medvedev, T. M. McQueen, I. A. Troyan, T. Palasyuk, M. I. Eremets, R. J. Cava, S. Naghavi, F. Casper, V. Ksenofontov, G.Wortmann and C. Felser, Nature Materials 8, 630 (2009).
- (10) S B Zhang, X D Zhu, H C Lei, G Li, B S Wang, L J Li, X B Zhu, Z R Yang, W H Song, JMDai and Y P Sun, Supercond. Sci. Technol. 22, 075016 (2009).
- (11) U. Patel, J. Hua, S. H. Yu, S. Avci, Z. L. Xiao, H. Claus, J. Schlueter, V. V. Vlasko-Vlasov, U. Welp, and W. K. Kwok, Appl. Phys. Lett. 94, 082508 (2009).
- (12) T. M. McQueen, Q. Huang, V. Ksenofontov, C. Felser, Q. Xu, H. Zandbergen, Y. S. Hor, J. Allred, A. J. Williams, D. Qu, J. Checkelsky, N. P. Ong and R. J. Cava, Phys. Rev. B 79, 014522 (2009).
- (13) D. Phelan, J. N. Millican, E. L. Thomas, J. B. Le o, Y. Qiu and R. Paul, Phys. Rev. B 79, 014519 (2009).
- (14) H. Okamoto, J. Phase Equillibria 12, 383 (1991).
- (15) P. Chartrand and A. D. Pelton, Canad. Metall. Quart., 39(4), 405-420 (2000).
- (16) B. H. Mok, S. M. Rao, M. C. Ling, K. J. Wang, C. T. Ke, P. M. Wu, C. L. Chen, F. C. Hsu, T. W. Huang, J. Y. Luo, D. C. Yan, K. W. Ye, T. B. Wu, A. M. Chang and M. K. Wu, Cryst. Growth Des. 9, 3260 (2009).
- (17) J. Yang, M. Matsui, M. Kawa, H. Ohta, C. Michioka, C. Dong, H. Wang, H. Yuan, M. Fang and K. Yoshimura, J. Phys. Soc. Japan 79 074704 (2010).
- (18) Zhaofei Li, J. Ju, J. Tang, K. Sato, M. Watahiki and K. Tanigaki, Phys. Chem. Solids 71, 495 (2010)
- (19) S. Margadonna, Y. Takabayashi, M. T. McDonald, K. Kasperkiewicz, Y. Mizuguchi, Y. Takano, A. N. Fitch, E. Suard and K. Prassides, Chemm. Commun. 43, 5607 (2009).
- (20) S. Margadonna, Y. Takabayashi, Y. Ohishi, Y. Mizuguchi, Y. Takano, T. Kagayama, T. Nakagawa, M. Takata and K. Prassides, Phys. Rev. B 80, 064506 (2011).
- (21) M. Onoda, Y. Kawasaki, M. Tsubokawa and T. Koyano, J. Phys. Cond. Matter. 22, 505702 (2010).
- (22) S. A. J. Kimber, A. Kreyssig, Yu-Z. Zhang, H. O. Jeschke, R. Valenti, F. Yokaichiya, E. Colombier, J. Yan, T. C. Hansen, T. Chatterji, R. J. McQueeney, P. C. Canfield, A. I. Goldman and D. N. Argyriou, Nature Materials 8, 471 (2009).
- (23) S. Takeshita, R. Kadono, M. Hiraishi, M. Myazaki, A. Koda, S. Matsuishi and H. Hosono, Phys. Rev. Lett. 103, 027002 (2009).
- (24) M. Bendele, A. Amato, K. Conder, M. Elender, H. Keller, H.-H. Klauss, H. Luetkens, E. Pomjakushina, A. Raselli and R. Khasanov, Phys. Rev. Lett. 104, 087003 (2010).
- (25) R. Khasanov, K. Conder, E. Pomjakushina, A. Amato, C. Baines, Z. Bukowski, J. Karpinski, S. Katrych, H.-H. Klauss, H. Luetkens, A. Shengelaya and N. D. Zhigadlo, Phys. Rev. B 78, 220510 (2010).
- (26) A. V. Fedorchenko, G. E. Grechnev, V. A. Desnenko, A. S. Panfilov, S. L. Gnatchenko, V. V. Tsurkan, J. Deisenhofer, H.-A. Krug von Nidda, A. Loidl, D. A. Chareev, O. S. Volkova and A. N. Vasiliev, Low Temperature Physics 37, 83 (2011).
- (27) T. Imai, K. Ahilan, F. L. Ning, T. M. McQueen and R. J. Cava, Phys. Rev. Lett. 102, 177005 (2009).
- (28) P. K. Mang, S. Larochelle, A. Mehta, O. P. Vajk, A. S. Erickson, L. Lu, W. J. L. Buyers, A. F. Marshall, K. Prokes and M. Greven, Phys. Rev. B 70, 094507 (2004).
- (29) Eng Chan Kim, S. G. Kang, I. H. Cho, Y. S. Hwang, H. G. Hwang and J. G. Kim, J. Appl. Phys. 81, 4131 (1997).
- (30) A. Blachowski, K. Ruebenbauer, J. Zukrowski, J. Przewoznik, K. Wojciechowski, Z. M. Stadnik, J. Alloys and Comp. 494, 1, (2010).
- (31) W. F. Brown, Magnetic Materials, Ch 8 in the Handbook of Chemistry and Physics, Condon and Odishaw, eds., McGraw-Hill, 1958.
- (32) J Carvell, E. Ayieta, A. Gavrin, R. Cheng, V. R. Shah and P. Sokol, J. Appl. Phys. 107, 103913 (2010).
- (33) A. V. Balatsky and D. Parker, Physics 2, 59 (2009).
- (34) W. G. Yin, Chi-Cheng Lee and Wei Ku, Phys. Rev. Lett. 105, 107004 (2010).
- (35) Yong-Feng Li, G.-B. Liu, L.-J. Shi and B.-G. Liu, Chin. Phys. Lett. 26, 127505 (2009).
- (36) K-W. Lee, V. Pardo and W. E. Pickett, Phys. Rev. B 78, 174502 (2008).
- (37) S. R. Saha, N. P. Butch, K. Kirshenbaum, J. Pagline and P. Zavalij, Phys. Rev. Lett. 103, 037005 (2009).
- (38) Wei Bao, G. N. Li, Q. Huang, G. F. Chen, J. B. He, M. A. Green, Y. Qiu, D. M. Wang, J. L. Luo and M. M. Wu, arXiv: 1102.3674 (2011).
- (39) Wei Bao, Q. Huang, G. F. Chen, M. A. Green, D. M. Wang, J. B. He, X. Q. Wang and Y. Qiu, arXiv: 1102.0830 (2011).
- (40) T. Hirone and S. Chiba, J. Phys. Soc. Japan 11, 666 (7956).
- (41) T. Kamimura, K. Kamigaki, T. Hirone and K. Sato, J. Phys. Soc. Japan 22, 1235 (1967).
- (42) E. H. Brandt, Physica C 332, 99 (2000).