2 INAF - Osservatorio Astronomico di Brera, Via E. Bianchi 46, I-23907, Merate, Italy
3 European Space Astronomy Center of ESA, Apartado 50727, 28080 Madrid, Spain
4 M.I.T. Kavli Institute for Astrophysics and Space Research, Cambridge, USA
5 INAF-IASF Bologna, via Gobetti 101, I-40129, Bologna, Italy
6 Astronomical Institute, Academy of Sciences, Bocni II 1401, CZ-14131 Prague, Czech Republic
7 Centro de Astrobiología (CSIC-INTA) LAEFF, PO Box 78, Villanueva de la Cañada, Madrid 28691, Spain
8 UJF-Grenoble 1 / CNRS-INSU, Institut de Planetologie et d’Astrophysique de Grenoble (IPAG) UMR 5274, Grenoble, F-38041, France
9 INAF - Osservatorio Astronomico di Roma, via Frascati 33, I-00040, Monteporzio Catone, Roma, Italy
10 School of Physics and Astronomy, University of Southampton, Highfield, Southampton SO17 1BJ, UK
Extreme Warm Absorber variability in the Seyfert Galaxy Mrk 704
Abstract
Context. In about half of Seyfert galaxies, the X-ray emission is absorbed by an optically thin, ionized medium, the so-called “Warm Absorber”, whose origin and location is still a matter of debate.
Aims. The aims of this paper is to put more constraints on the warm absorber by studying its variability.
Methods. We analyzed the X-ray spectra of a Seyfert 1 galaxy, Mrk 704, which was observed twice, three years apart, by XMM-.
Results. The spectra were well fitted with a two zones absorber, possibly covering only partially the source. The parameters of the absorbing matter - column density, ionization state, covering factor - changed significantly between the two observations. Possible explanations for the more ionized absorber are a torus wind (the source is a polar scattering one) or, in the partial covering scenario, an accretion disk wind. The less ionized absorber may be composed of orbiting clouds in the surroundings of the nucleus, similarly to what already found in other sources, most notably NGC 1365.
Key Words.:
Galaxies: active – X-rays: galaxies – X-rays: individual: Mrk 7041 Introduction
Absorption from ionized matter in the X-ray spectrum of AGN (the so-called warm absorber) was discovered many years ago (Halpern 1984). Since then, many advances in its understanding have been made, and we know now that it is present in about half of Seyfert galaxies (e.g. Reynolds 1997) and that the matter is photoionized. Warm absorbers are also known to vary, and indeed the first discovered absorber was variable (Halpern 1984). The location of the warm absorber (or, indeed, of the absorbers, as more than one ionizing zone is often found) is, however, largely uncertain. There is some evidence for its origin as a wind from the dusty torus envisaged in unification models for Seyfert galaxies (Blustin et al. 2005), but cases in which an origin from the disk seems to be preferred do also exist (Krongold et al. 2007).
Mrk 704 is a local (=0.029234) Seyfert 1.2 galaxy (Veron-Cetty & Veron 2010), bright enough in X-rays to be detected by /BAT (Ajello et al. 2008). In this paper we report on extreme warm absorber variability, on yearly time scales, revealed by two XMM- observations, and possible variability on monthly time scales from short Swift/XRT observations.
The paper is organized as follows: in Section 2 we report on the XMM- observations and data reduction, while the relative data analysis are discussed in Section 3. Section 4 presents the analysis of the and observations, while the results are summarized and discussed in Section 5.


2 XMM-: Observations and data reduction
XMM- observed Mrk 704 twice, on 2005-10-21 (obsid: 0300240101) and on 2008-11-02 (obsid: 0502091601). In both cases, EPIC pn and MOS were in Small Window mode (apart from MOS2 in the first observation, which was in Full Frame mode), which ensures that no significant pile-up is present, as verified with the epatplot tool, in the pn detectors (the only one used for the analysis). Mrk 704 is by far the brightest source in the field of view.
Data were reduced with SAS 10.0.0, using calibration files generated on 2010-6-11. Screening for intervals of flaring particle background was done consistently with the choice of extraction radii, in an iterative process based on the procedure to maximize the signal-to-noise ratio described by Piconcelli et al. (2005). After this process, the net exposure time was of about 15 and 68 ks for the 2005 and the 2008 observation, respectively, adopting extraction radii of 36 and 40 arcsec, and patterns 0 to 4. The background spectra were extracted from source-free circular regions with a radius of 50 arcsec. The same regions were used for the timing analysis. Spectra were binned in order to oversample the instrumental resolution by at least a factor of 3 and to have no less than 30 counts in each background-subtracted spectral channel. The latter requirement allows us to use the statistics as a goodness-of-fit-test. RGS source and background spectra were extracted with standard procedures, adopting the data reduction pipeline rgsproc, and choosing the NED optical nucleus of Mrk 704 as the reference point for the attitude solution.
3 XMM-: Data analysis
We will use in this paper only data from the EPIC pn and the RGS camera, because after the latest release of the EPIC pn redistribution and the RGS contamination model (May 2010) their cross-calibration is as good as 3% (A. Pollock, private communication).
In Fig. 1 the 2-10 keV (upper panel), 0.3-2 keV, (middle panel) and the (2-10 keV)/(0.3-2 keV) hardness ratio (HR) light curves are shown for the first (left) and the second (right) observations. Intra-observation variability in the count rates is apparent in both cases. While in the first observation no clear variation in the HR is present, in the second observation an anticorrelation of the hardness ratio with the flux is evident, indicating that the source gets softer when brighter. Therefore, while for the first observation we will use, for the spectral analysis, the time-integrated spectrum only, for the second observation we will also make a time-resolved spectral analysis.
Spectral analysis has been performed using the XSPEC package, version 12.6.0. Unless specifically stated, all errors refer to the 90% confidence level for one interesting parameter.
Let us start with the time-averaged analysis of both observations. In Fig. 2 the best fit models and residuals are shown, assuming a simple power law absorbed by the Galactic column density in the direction of the source (2.971020 cm20, Kalberla et al. 2005). The fits are clearly bad, not surprisingly given the extremely simple model. From the residuals, a soft excess, a broad absorption trough between about 1 and 2 keV - indicative of obscuration by ionised gas - and an iron line at 6.4 keV are apparent.
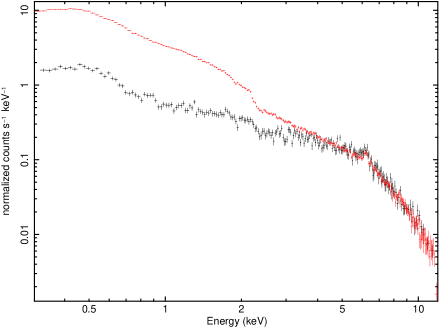
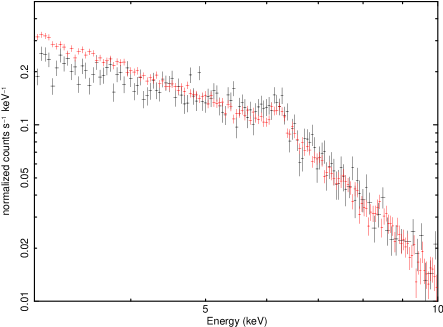
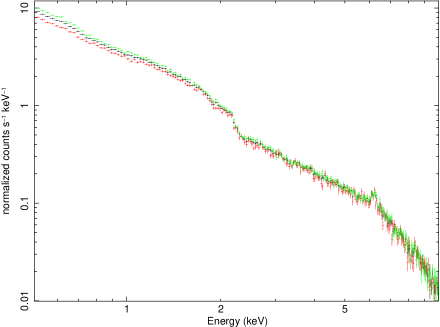
Comparing the spectra of the two observations (Fig. 3), a huge difference in the soft part of the spectrum is clear, suggesting a much stronger absorption in the first observation. Above a few keV, instead, the two spectra are pretty similar (see also Fig. 4).


3.1 The iron line
We first concentrate on the iron line, and to this end we limit the bandwidth to 5-10 keV, where the soft excess and the warm absorber do not have an important impact on the spectral modeling. More specifically, the choice of 5 keV as the lower limit of the band is due, on one hand, on the necessity to have the entire line within the band (which is verified a posteriori), and on the other hand to avoid any effect of the warm absorber. In fact, a fit with a simple power law gives very different values - especially for the first observation - of the photon index depending on the lower limit of the band, stabilizing only above 5 keV. The photon index steepens increasing the lower limit, a clear indication of absorption at low energies.
We fitted the 5-10 keV spectrum with a power law, a Compton reflection component (pexrav model in XSPEC, parameter - the solid angle subtended by the reflecting matter to the nuclear source in units of 2 - fixed to 1) and an iron line, firstly modeled with a narrow Gaussian at 6.4 keV ( fixed to 0). Results are summarized in Table 1, where best fit spectral parameters for this and following models are reported. In both observations, the statistical quality of the fit is not very good, and residuals are evident around the line, suggesting it is resolved. Indeed, leaving free to vary, the quality of the fit significantly improves (see Table 1), with of 100-150 eV, corresponding to a FWHM velocity 2-3 times larger than that of the Broad Line Regions (about 5000 km/s, Stirpe 1990). Letting the centroid energy of the line free to vary, instead, does not improve the quality of the fit.
The most likely broadening mechanism is therefore matter rotation in an accretion disk. We therefore substituded the Gaussian with the diskline model (valid for Schwarschild metric) with outer radius fixed to 1000 gravitational radii and the emissivity index to -2.5. The rest-frame line energy is again fixed to 6.4 keV. The fits are of comparable statistical quality to those obtained with a broad Gaussian. The moderate width of the line translates in a quite large inner radius (much larger than the innermost stable orbit) and in a small inclination angle.
On the other hand, it is possible that the line is actually a blend of a narrow line (originating e.g. in the torus) and of a relativistic line. We therefore fitted the spectrum with the combination of the two, fixing for simplicity the inner radius of the relativistic line to 6 gravitational radii (the innermost stable orbit for Schwarschild metric) and the inclination angle to 30 degrees. The fit is again good, and we cannot really distinguish between the different models on statistical ground. (A fit of similar quality is obtained if a laor model is used for the line, again with the inner radius fixed to the innermost stable orbit.) We limit ourselves to note that a relativistic component seems to be required, but whether the line emitting region is truncated or a narrow component is also present cannot be told.
Comparing the two observations, there is marginal evidence for a stronger (and broader) broad component of the line in the first observation (see Fig. 4). The quality of the data is, however, not good enough to further explore this possible line variability.
For both observations, and for all line models, the power law photon index is around 1.7-1.8.
| Parameters | Obs. 1 | Obs. 2 |
|---|---|---|
| Narrow Gaussian | ||
| Fline (10-5 cgs) | 1.17 | 0.95 |
| EW (eV) | 85 | 72 |
| /d.o.f. | 77.2/73 | 113.3/93 |
| Broad Gaussian | ||
| (eV) | 143 | 116 |
| Fline (10-5 cgs) | 2.18 | 1.51 |
| EW (eV) | 162 | 119 |
| /d.o.f. | 66.2/72 | 91.4/92 |
| Diskline | ||
| () | 52 | |
| 20 | 22 | |
| Fline (10-5 cgs) | 2.24 | 1.32 |
| EW (eV) | 175 | 113 |
| /d.o.f. | 62.6/71 | 90.7/91 |
| Diskline + Narrow Gaussian | ||
| Fline,disk (10-5 cgs) | 2.66 | 1.49 |
| EWdisk (eV) | 208 | 127 |
| Fline,NG (10-5 cgs) | 0.68 | 0.64 |
| EWNG (eV) | 44 | 52 |
| /d.o.f. | 66.7/72 | 96.0/92 |
| Parameters | Obs. 1 | Obs. 2 |
| 1 Zone | ||
| 10.0 | 4.55 | |
| 1.45 | 1.87 | |
| NH (1022 cm-2) | 5.16 | 0.15 |
| (cgs) | 122 | 39 |
| Eline (keV) | 0.900 | – |
| Fline (10-5 cgs) | 4.12 | – |
| /d.o.f. | 295.1/208 | 421.9/230 |
| 2 Zones | ||
| 5.4 | 3.53 | |
| 1.64 | 1.79 | |
| NH,1 (1022 cm-2) | 0.14 | 0.085 |
| (cgs) | 0.39 | 5.1 |
| NH,2 (1022 cm-2) | 6.85 | 1.63 |
| (cgs) | 139 | 1750 |
| Eline (keV) | 0.904 | – |
| Fline (10-5 cgs) | 4.57 | – |
| /d.o.f. | 256.4/206 | 279.4/228 |
| 2 Zones, partial covering | ||
| 6.7 | 2.71 | |
| 1.71 | 1.18 | |
| NH,1 (1022 cm-2) | 0.10 | 0.75 |
| (cgs) | 0.29 | 2.24 |
| Covering Factor (1) | 0.45 | 0.56 |
| NH,2 (1022 cm-2) | 8.8 | 13.3 |
| (cgs) | 97 | 122 |
| Covering Factor (2) | 0.84 | 0.38 |
| Eline (keV) | 0.895 | – |
| Fline (10-5 cgs) | 2.50 | – |
| /d.o.f. | 234.3/204 | 230.2/226 |
-
(*) The asterisk indicates that a parameter is pegged to one of its limits.
3.2 The warm absorber
We now study the broad band (0.5-10 keV) spectra of the source. Having in mind the residuals to a simple power law model (Fig. 2), we added to the model already used to study the iron line (adopting for simplicity a broad Gaussian for the line) a second power law to model the soft excess, and one or more warm absorber region. The warm absorber was modeled with the zxipcf model, based on the XSTAR photoionization code. The main limitations of the model are a fixed ionizing continuum (a power law with photon index of 2) and fixed element abundances (equal to solar). The ionization parameter is . The results are summarized in Table 2. For the first observation, the addition of an emission line around 0.9 keV (to be likely identified with the Neon IX He-like triplet) was also necessary, as also suggested by the RGS analysis. In fact, in the RGS spectrum of obs 1 a line at 0.9030.001 keV (corresponding to the forbidden line of the triplet) with a flux of 1.69(0.72)10-5 ph cm-2 s-1 was found (see below).


| Models | Obs. 1 | Obs. 2 |
|---|---|---|
| 2 Zones | ||
| -3900 km/s | -190210 km/s | |
| +2650 km/s | -100250 km/s | |
| 2 Zones, partial covering | ||
| – | -580340 | |
| +3000 km/s | +140300 km/s |
3.2.1 The first observation
Let us first discuss the first observation, where the absorption is much stronger. A single ionization zone is insufficient, the addition of a second zone improving significantly, even if not dramatically, the statistical quality of the fit. Moreover, in the single zone model (the photon index of the soft power law) is unrealistically steep, while (the photon index of the hard power law) is much flatter than the value found in the hard band.
The addition of the second zone improves the quality of the fit, which however remains not fully satisfactory. Visual inspection of the data/model ratio (see Fig. 5), however, shows that this is due mostly to noise rather than to unfitted features, even if some wiggles are present around the Neon line. Indeed, an improvement (=-16) of the fit is obtained by letting free to vary the width of the line, when a value of 48 eV is found. This may suggest a blend with other lines (mostly iron L), too faint to be individually detected by the RGS. However, it is also possible that the broadening of the line is an artifact to correct for a too strong, in the model, iron UTA (this may occur e.g. if the iron abundance is lower than solar). Unfortunately, with the present data we cannot go much further in this analysis.
No further improvement is found by adding a third absorption region.
We tried to fit the warm absorber also with “home-made” tables built using the cloudy photoionization code. Results are similar and are therefore not reported here.
As a consistency check, we then fitted the RGS data with the best fit model (all parameters fixed) described above. Spectra were rebinned in order to have at least 10 counts per bin111As a check that the rebinning was not altering the fit results, we fitted the RGS spectra also with no rebinning and the Cash quality-of-the-fit statistics, finding no significantly different results. The fit is reasonable (/d.o.f.=333.4/278), with several, but not individually significant features apparent in the residuals, apart from the Ne IX line already included in the spectrum. An improvement (/d.o.f.=296.2/269) is found letting the model parameters free to vary. The best fit parameters, however, are consistent within the errors with those found in the EPIC-pn analysis, and the abovementioned residuals are still there.
We then let the velocities of the absorbing zones free to vary, to account for possible inflows/outflows. A better fit is found (/d.o.f.=281.2/267), with an inflow velocity of 3900 km/s for the low ionization absorber and an outflow velocity of 2650 km/s for the high ionization absorber (see Table 3 where “low” and “high” refers to the low and high ionization components, respectively, and negative velocities indicate inflows).
Back to the EPIC-pn analysis, a slight improvement (=-8) is also found substituting the soft power law with a disk thermal component (diskbb model in XSPEC). The temperature is around 160 eV, but the normalization value is unphysical, corresponding to about 4105 km for the inner radius (the Schwarzschild radius for the 100 million solar masses black hole estimated for Mrk 704, Wang et al. 2009, is about one thousand times larger).
A slightly worse fit (=14) is instead found if an ionized reflection model (reflionx, Ross & Fabian 2005) is adopted (with or without relativistic blurring) for the soft X-ray component. The power law index is pegged to the lower possible value, 1.4.
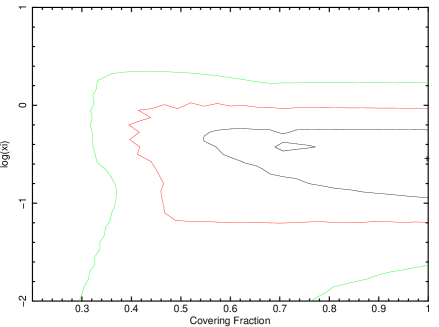
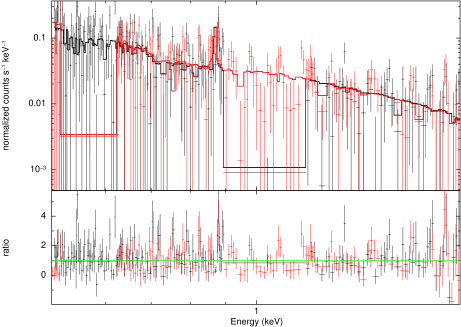
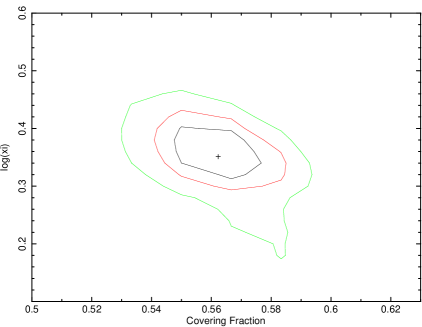
A moderate improvement (=-22) is found letting the absorbers be partial. Best fit covering factors of 1 (but loosely constrained) and 0.85 are found for the colder and warmer ionization zones, respectively (see Table 2). All other parameters are similar to those found in the full absorbers fit. The best fit model and data/model ratio can be found in Fig. 5. In Fig. 6 the contour plots (ionization parameter vs. covering factor) are shown. For the low ionization absorber, a full covering is always acceptable, while at the 99% confidence level a very low ionization (almost neutral) partial absorber is possible. The two parameters are much better determined for the high ionization absorber, with no significant correlation between them.
Regarding the RGS, a check similar to that described above for the full covering scenario was also performed in the partial covering case. With all parameters fixed, the fit is worse than for the full absorbers (/d.o.f.=356.5/278). A slightly better fit is instead found letting the parameters free to vary (/d.o.f.=283.7/267), again with the best fit parameters consistent within the errors with those found in the EPIC-pn analysis. The feature-like residuals are still apparent (see Fig. 7). Letting the velocities of the absorbers free to vary, we found a marginal improvement of the quality of the fit (/d.o.f.=279.2/265), with an outflow velocity of 3000 km/s for the high ionization absorber, while the velocity of the low ionization absorber is basically undetermined (Table 3).
The value of is harder than found in the iron line analysis. This, together with the relatively high , may indicate that the warm absorber model we are adopting is not fully adequate (e.g., the absorption regions may be more structured that single ionization zones, or metal abundances be different than solar).
For simplicity, in the broad band fitting the iron line is modeled with a broad Gaussian. No significant changes in the line parameters are found with respect to the hard X-ray band fits described in the previous section.
The 0.5-2 (2-10) keV observed flux is 1.53(10.1)10-12 erg cm-2 s-1, corresponding to a 0.5-2 (2-10) keV luminosity of 1.17(2.34)1043 erg s-1, after correction for absorption.
3.2.2 The second observation
Due to the much weaker absorption and the absence of the Neon emission line, and despite the better statistics, the analysis of the second observation resulted to be easier. Also in this case, however, the addition of a second zone is definitely required.
Inspection of the data/model ratio (see Fig 8) shows however that some features are still remaining, even if that at about 1.8-2 keV is very likely of instrumental origin. Particularly prominent is the feature around 1 keV, again suggesting a possible problem in the fitting of iron transitions. The addition of a third absorbing zone does not cure this problem.
Also for this observation we find similar results with the cloudy-based, home-made tables. A significantly worse fit is found, instead, substituting the soft power law either with a disk thermal component or with an ionized reflection model.
We then fitted the RGS data with the best fit model (all parameters fixed) above described. Given the much better statistics with respect to the first observation, spectra were rebinned to have at least 50 counts per bin222Also in this case, fits to the unbinned spectra provide substantially the same results. The fit is reasonable (/d.o.f.=856.8/679). An improvement (/d.o.f.=814.4/672) is found letting the model parameters free to vary. The best fit parameters, however, are consistent within the errors with those found in the EPIC-pn analysis. Inspection of the residuals indicates the possible presence of features, but the only significant one (at the 99% confidence level) is an emission line with a centroid energy of 1.1140.002 keV - to be possibly identified with Fe XVII L lines - with a flux of 1.80(0.75) ph/cm2/s-1. However, no such line is found in the EPIC-pn data (upper limit of 3.6 ph/cm2/s-1). Finally, no significant inflow/outflow velocity is found, with upper limits of a few hundreds km/s (Table 3).
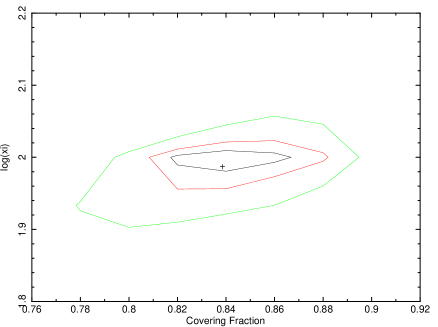
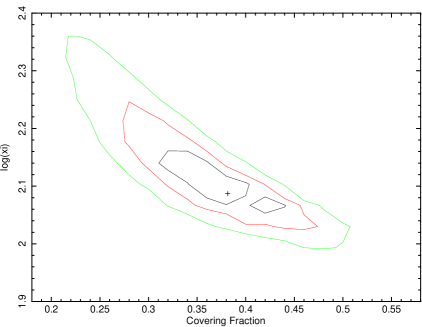
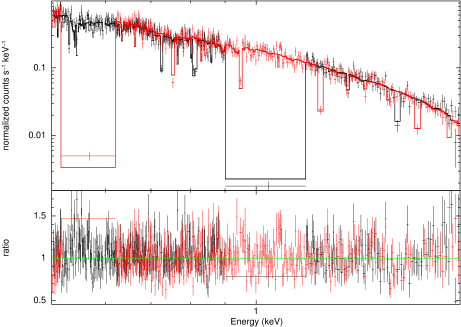
A significant improvement (=-49) is found letting the absorbers be partial. Best fit covering factors of 0.56 (but loosely constrained) and 0.38 are found for the colder and warmer ionization zones, respectively (see Table 2). Both absorbers are now much thicker and slightly less ionized. The power law indices are much harder; in particular, the is now 1.18 (even if loosely constrained), a value unusually hard for Seyfert galaxies. However, it must be noted that fixing =1.8 a good fit is still obtained (=243.0/227), with the parameters of the less ionized absorber almost unchanged while the more ionized absorber gets still more ionized and thicker (41023 cm-2, 230, covering factor of 0.27). The best fit model and data/model ratio can be found in Fig. 8. In Fig. 9, the contour plots (ionization parameter vs. covering factor) are shown. For the low ionization absorber the two parameters are almost uncorrelated, while for the high ionization absorber they are anticorrelated, indicating a certain degree of degeneracy in the model.
The usual check with the RGS is then performed. Fits are better than those obtained with the full absorbers, reflecting the same improvement found in the EPIC-pn spectrum. With all parameters fixed, a /d.o.f.=821.6/679 is found, while letting the parameters free to vary, a /d.o.f.=752.0/670 is found. The best fit parameters are consistent within the errors with those found in the EPIC-pn analysis. The spectrum and data/model ratio can be seen in Fig. 10. Finally, no significant inflow/outflow velocity is found for the high ionization absorber (upper limits of a few hundreds km/s), while for the low ionization absorber a marginally significant inflow velocity of 580340 km/s is obtained (Table 3).
For the second observation, the 0.5-2 (2-10) keV observed flux is 7.62(11.2)10-12 erg cm-2 s-1, corresponding to a 0.5-2 (2-10) keV luminosity of 2.34(2.26)1043 erg s-1, after correction for absorption.
During the revision of the present work, we became aware of a paper by Laha et al. (2011) dealing with the analysis of the second XMM- observation of Mrk 704. The results of their analysis are qualitatively similar to ours, the quantitative differences probably mostly related to the somewhat different spectral model adopted333The main difference in the modeling is that they included a partial, neutral intrinsic absorber, while keeping full coverage for the ionized absorbers. If we did the same for the two full absorbers model, a slightly better fit is found, which however is significantly worse than the one with two partial ionized absorbers. If we did the same for the first observation, a fit very similar to that with two partial ionized absorbers is found, not surprisingly as the lower ionization zone is almost neutral in that observation (see Fig. 6).. The most important qualitative difference is that Laha et al. found the two warm absorbers both outflowing, while in our analysis no significant inflow/outflow is found, with only marginal evidence for an inflow of the low ionization absorber in the partial covering scenario.


3.2.3 Comparison between the two observations
A comparison between the results of the fits to the two spectra of the two observations show, as obvious from Fig. 3, stronger overall absorption in the first observation. Assuming full covering absorbing zones, for both of them the column density decreases (by a factor about 2 for the colder absorber, a factor about 4 for the warmer absorber) and the ionization parameter increases from the first to the second observation. If the absorbers are allowed to partially cover the source, the colder absorber results thicker, warmer and with a lower covering factor in the second observation, while for the warmer zone the most significant difference is the covering factor, again much lower in the second observation (the column density and the ionization parameter both slightly increase).
The detection of a Neon emission line in the first observation only cannot be entirely ascribed to the stronger absorption (which would make by contrast a constant line more visible). In fact, simulations show that a line with that flux should have been detected also in the second observation (even if the upper limit to such a line, about 10-5, is marginally consistent with the value found in the RGS in the first observation). Therefore, an intrinsic variability of the line intensity is required, possibly related to a different covering factor of the absorbing/reflecting clouds.
So, the question is: what drove a so large variation of the warm absorber over three years? The hard 2-10 X-ray luminosity stayed approximately the same, while the soft 0.5-2 keV luminosity was higher by a factor 2 in the second observation (even if the reconstructed values, given the large absorption, are rather uncertain), which may - in part at least - explain the higher ionization parameters. However, the different values in the two observations of the column densities and of the Neon line suggest that also variations in the general properties (size, distance, covering fraction, etc.) of the circumnuclear medium have occurred.
3.2.4 Time dependent analysis of the second observation
Due to its intra-observation spectral variability (see Fig. 1), we divided the second observation in two parts, corresponding to the first 40 ksec (obsA here-in-after) and to the remaining part of the observation (obsB), respectively. The three spectra (obsA, obsB and total) are shown in Fig 11. A reasonable fit (/d.o.f. of 266.2/228 and 274.5/235 for obsA and obsB, respectively) is obtained by imposing all spectral parameters to be fixed to those found in the total spectrum (two absorbing zones model), leaving as free parameters only the normalizations of the two power laws. The observed spectral variability is then explained mainly in terms of a variation of the normalization of the soft power law. Other choices, like leaving instead as a free parameter the column density or the ionization parameter or the covering factor of the warm absorbers do not provide acceptable fits.
Leaving all main parameters free to vary, better fits are of course obtained (/d.o.f=253.5/221 and 265.2/228 for obsA and obsB, respectively) but the parameter which suffered the largest variation is again the normalization of the soft power law, confirming the previous analysis.
4 The Swift and observations
| Parameters | Obs. 1 | Obs. 2 | Obs. 3 | Obs 5 |
|---|---|---|---|---|
| Date | 2006-01-06 | 2006-06-14 | 2006-09-28 | 2007-01-21 |
| XRT exp. time (s) | 671 | 2258 | 5602 | 1750 |
| 2 (fixed) | 2.00 | 1.88 | 2 (fixed) | |
| NH (1022 cm-2) | 12 | 0.85 | 1.58 | 1.1 |
| (cgs) | 95 | 73 | 123 | |
| Flux (2-10 keV) (10-11 cgs) | 0.64 | 1.14 | 0.88 | 0.87 |
| /d.o.f. | 0.31/5 | 38.4/36 | 49.1/54 | 19.3/22 |
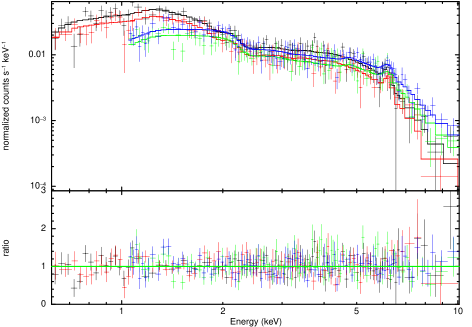
The source was observed by Swift five times. In four occasions, it was also in the XRT field of view (see Table 4), while in the fourth observation it was outside. The four XRT spectra, along with the two XMM ones, are shown in Fig. 12.
From the figure, spectral and flux variability is apparent between Swift observations (even if far less dramatic than that between the two, 3-years apart XMM- observations), implying a variability time scale of a few months or less. In Table 4 the results of the spectral fits are summarized. Due to the modest quality of the spectra, a good fit is already obtained with a single power law absorbed by a single zone, fully covering absorber (no improvement is found letting the covering of the absorber be partial). For the lesser quality first and last observations, we fixed the power law index to 2, a value similar to those found in the second and third observations. The quality of the spectra is insufficient to establish if the variability is due to a variation of the properties of the warm absorber, apart from the first observation, when a much larger absorption is apparent.
Mrk 704 was also observed by on May 12, 1998, for about 35 ks exposure time. A good fit (/d.o.f=348.9/355) is already obtained with a single power law absorbed by a single zone, fully covering absorber (see Fig. 13). The source was in a lower flux state (2-10 keV flux of about 510-12 erg cm-2 s-1. The absorber has a column density of 5.6()1023 cm-2, larger than in any other observation, and an ionization parameter of 1430() (cgs).
5 Discussion and conclusions
The Seyfert 1.2 galaxy Mrk 704 was observed twice by XMM-Newton, about three years apart (first observation in October 2005, the second in November 2008). While the hard (5 keV) spectrum was almost constant between the two observations (with a possible broadening/strenghtening of the iron line in the first observation), the soft part dramatically changed, showing much heavier absorption in the first observation. A strong Neon IX line is also clearly present in the first observation, while it is not detected in the second one. The very similar hard X-ray spectrum in the two observations (the behaviour of the intrinsic soft X-ray spectrum is more uncertain because of the strong absorption), together with the change in the column density, suggest that the variations are due to a change in the properties of the absorbing clouds. Dramatic changes of the column density and/or the ionization state of the absorber have already been observed in other sources, the most spectacular being NGC 4151 (e.g. Schurch & Warwick 2002, de Rosa et al. 2007), NGC 7582 (Bianchi et al. 2009) and NGC 1365 (Risaliti et al. 2005, 2009). In the last two sources, in particular, large variations of the column density of the (cold) absorber occur on time scales as short as less than a day. Here we observe also a strong variation of the ionization state of the absorbers. As the primary continuum (at least the hard one) stayed almost constant, this indicates a variation of the location and/or of the density of the clouds.
It is interesting to note that Mrk 704 is a “polar-scattering” Seyfert 1, i.e. a source with optical polarization aligned perpendicularly to the radio source axis, as usually found in Seyfert 2s (Smith et al., 2004). Smith et al. suggest that in these sources the nucleus is seen through the edge of the torus.
We fitted the spectra with two absorbing regions, either fully or partially covering the primary emission. The improvement in the quality of the fit when letting the aborbers be partial is only moderate for the first observation, but more significant in the second one. As the results are somewhat different in the two cases, let us discuss them separately.
With the full covering absorbers, both absorbing zones are found more ionized and with a lower column density in the second observation (even if the difference in the column density for the low ionization zone is only marginal). The RGS analysis of the first observation suggests a possible (but only marginally significant) inflow for the low ionization, low column density absorber, and an outflow velocity (very poorly determined, with 90% confidence level range between 1800 and 12000 km/s) for the high ionization, high column density absorber. An ionized and unstable torus wind, as suggested by Smith et al., may indeed provide an explanation for the latter zone. No significant inflow/outflow is instead found, for both absorbers, in the second observation.
The partial covering scenario, even if providing better fits, is more demanding geometrically, requiring a size of the obscuring clouds of the same order of the size of the emitting region. This naturally points to a much closer location of the obscuring clouds, as e.g. due to a radiatively-driven accretion disk wind (e.g. Proga 2003). Interestingly, the variability behaviour of Mrk 704 closely resemble that of mini-BAL QSOs (Giustini et al. 2010), strengthening the disk wind scenario, at least for the more ionized absorber (the colder absorber may be composed of orbiting clouds as those found in NGC 1365, Risaliti et al. 2009). Interestingly, a possible outflow has been detected in the first observation (but not in the second, despite very similar column densities and ionization parameters).
The alternative hypothesis, that the partial covering is mimicking the presence of a scattering component originating outside the absorbing region, is ruled out by the short term variability of the X-ray emission.
Mrk 704 was also observed four times by Swift/XRT between January 2006 and January 2007. Spectral and flux variability is apparent between the observations, but the quality of the spectra is not sufficient to establish the nature of the variations.
The iron K line, studied with XMM, is broad, much broader than the optical broad lines but narrower than expected if the entire line would be originated in the innermost accretion disk. However, if a narrow component (which seems to be almost ubiquitous in Seyfert galaxies) is added, then the remaining broad component is consistent with emission down to the innermost stable orbit, even if the quality of the data in not good enough to constrain the spin of the black hole.

Acknowledgements
We thank the anonymous referee for her/his suggestions which helped improving the clarity of the paper. We thank all the members of the collaboration for useful discussions. GM, SB and EP acknowledge financial support from ASI under grant I/088/06/0 and I/090/10/0/. POP acknowledges financial support from CNES and French GDR PCHE. GP acknowledges support from an EU Marie Curie Intra-European Fellowship under contract no. FP7-PEOPLE-2009-IEF-254279.
References
- (1) Ajello M., et al., 2008, ApJ, 673, 96
- (2) Bianchi S., et al., 2009, ApJ, 695, 781
- (3) Blustin A.J., et al., 2005, A&A, 431, 111
- (4) De Rosa A., et al., 2007, A&A, 463, 903
- (5) Giustini M., et al., 2010, in “Accretion and Ejection in AGN: a Global View”, Maraschi L., Ghisellini G., Della Ceca R., Tavecchio F. (eds), ASP Conference Series Volume 427, p.108
- (6) Halpern J.P., 1984, ApJ, 281, 90
- (7) Kalberla P.M., et al., 2005, A&A, 440, 775
- (8) Krongold Y., et al., 2007, ApJ, 659, 1022
- (9) Laha S., Dewangan G.C., Kembhavi A.K., 2011, ApJ, in press (arXiv:1103.6268)
- (10) Piconcelli E., et al., 2005, A&A, 432, 15
- (11) Proga D., 2003, ApJ, 585, 406
- (12) Risaliti G., Elvis M., Fabbiano G., Baldi A., Zezas A., 2005, ApJ, 623, L93
- (13) Risaliti G., et al., 2009, ApJ, 696, 160
- (14) Reynolds C.S., 1997, MNRAS, 286, 513
- (15) Ross R.R., Fabian A.C., 2005, MNRAS, 358, 211
- (16) Schurch N.J., Warwick R.S., 2002, MNRAS, 334, 811
- (17) Smith J.E., et al., 2004, MNRAS, 350, 140
- (18) Stirpe G., 1990, A&AS, 85, 1049
- (19) Veron-Cetty M.-P., Veron P., 2010, A&A, 518, 10
- (20) Wang J., Mao Y.F., Wei J.Y., 2009, AJ, 137, 3388