footnote
The Mass Distribution of the Great Attractor
as Revealed by a Deep NIR Survey
Abstract
This paper presents the analysis of a deep near-infrared imaging survey () aimed at tracing the galaxy distribution of the Great Attractor (GA) in the Zone of Avoidance along the so-called Norma Wall. The resulting galaxy catalog is complete to extinction-corrected magnitudes for extinctions less than and star densities below . Of the 4360 catalogued galaxies, 99.2% lie in the hereby constrained 89.5% of the survey area. Although the analyzed galaxy distribution reveals no new major galaxy clusters at the GA distance (albeit some more distant ones), the overall number counts and luminosity density indicate a clear and surprisingly smooth overdensity at the GA distance that extends over the whole surveyed region. A mass estimate of the Norma Wall overdensity derived from (a) galaxy number counts and (b) photometric redshift distribution gives a lower value compared to the original prediction by Lynden-Bell et al. 1988 (%), but is consistent with more recent independent assessments.
1 Introduction
The motivation for this deep near-infrared (NIR) imaging survey along the Norma Wall (henceforth the Norma Wall Survey, NWS) is described by Wakamatsu 2011 (these proceedings). It includes a description of the survey area and the derived NIR () positional and photometric parameters of the 4360 identified galaxies. The main goal of the project is the mapping of the galaxy distribution in the Great Attractor (GA) region where extinction and star crowding by the Milky Way is so severe that neither optical nor NIR whole-sky surveys (like 2MASX; Jarrett et al. 2000; Jarrett 2004) allow an estimate of the GA mass-density, wheras the deepest systematic HI ZOA surveys to date (Parkes MB; e.g. Kraan-Korteweg et al. 2005), which allow full penetration of the ZOA, remain very shallow (gal). See Kraan-Korteweg & Lahav (2000); Kraan-Korteweg (2005) for a review of the various dedicated multi-wavelength ZOA surveys.
The earlier optical, NIR and HI ZOA results suggest the GA to consist of a Great Wall-like structure, that extends over on the sky (from Pavo to Abell S0639); it includes the massive clusters Norma A3627 (the likely core of this structure), CIZA J1324.7-5736 (CIZA), Cen-Crux and PKS 1343-601 (see e.g. Radburn-Smith et al. 2006 for further details).
We used the InfraRed Survey Facility (IRSF) at the 1.4 m Japanese telescope in Sutherland (SAAO) to obtain -band survey images of to probe the most central, low-latitude () region of the Norma Wall. It starts above the Norma cluster (covered by Skelton et al. 2009) and includes the CIZA and Cen-Crux clusters on the other side of the ZOA. The exposure times of 10 min are an optimization between survey depth versus sky background and star density. The longer integrations times and particularly the higher resolution of the IRSF (pix) compared to 2MASX allows the detection of galaxies deeper into the Milky Way and improved photometry (see also Skelton et al. 2009; Williams et al. these proceedings). Only 5.5% of the identified galaxies have counterparts in 2MASX. Further details are given in Riad (2010, PhD thesis) and the forthcoming catalogue paper (Nagayama, Riad et al., in prep).
2 Completeness as a function of extinction
The first step in the interpretation of the uncovered large-scale structures within this survey is a good understanding of the completeness as a function of foreground extinction and star density. This was assessed from the cumulative number counts for the observed and foremost for the extinction-corrected and . The latter were determined by applying the derivations of Riad et al. (2010) for absorption effects on their observed isophotal magnitudes and radii.
The analysis finds the NWS galaxy catalog complete for isophotal magnitudes , and where dust obscuration does not exceed mag respectively (the apparent limits are = and respectively). For higher extinction values this drops significantly. But note that the great majority (99.2) of the galaxies in the NWS are found in regions with dust obscuration below mag. In fact, almost 90 of the galaxies have foreground extinction less than (, ).
The completeness limit also depends on stellar density. Our analysis indicates that the success rate in identifying and parameterizing galaxies decreases once star densities reach values above (due to crowding as well as the increased sky background). Interestingly, this stellar density contour corresponds closely to the extinction contour of but lies a bit lower below the Galactic Plane (, rather than ().
We therefore conclude that the survey is complete for in the regions delimited by and . This comprises () of the survey area and 99.2% of the 4360 galaxies.
3 Assessment of the 2-D distribution
A first assessment of the large-structure and possible identification of unknown galaxy clusters in the NWS was made by inspecting the galaxy density contour maps for the above derived completeness levels. These are presented in Fig. 1, subdivided in two magnitude intervals and for a rough differentiation between more local and distant density enhancements.
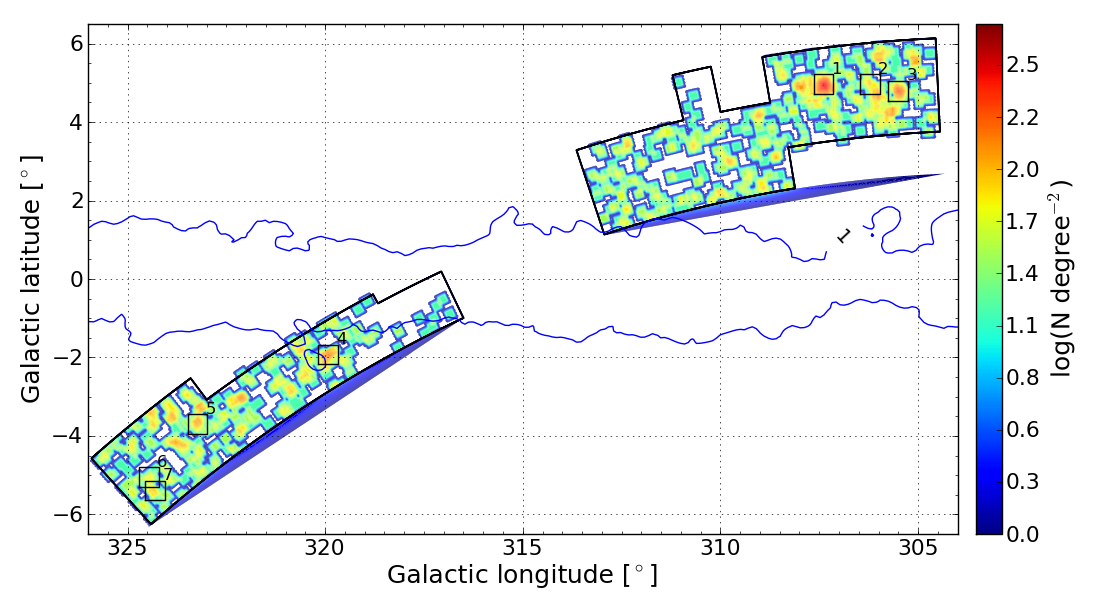
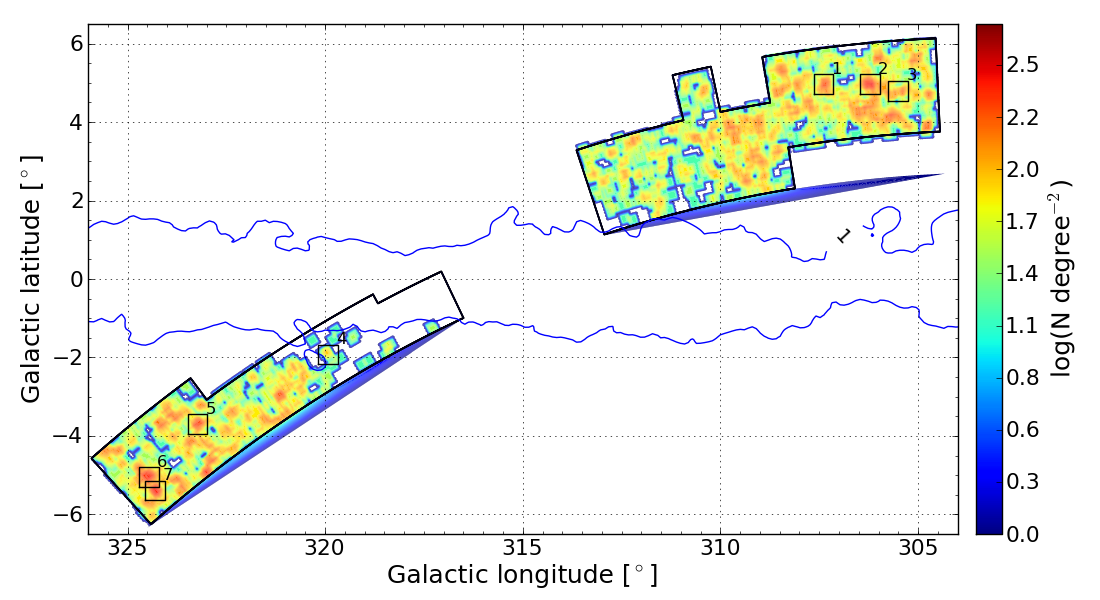
There are seven distinct peaks in the number counts of which six have values ranging from log compared to the mean of the survey . The two prominent ones in the top panel (labeled 1 and 3) coincide with the CIZA J1324.7-5736 (Ebeling et al. 2002) and Cen-Crux cluster cluster (Woudt & Kraan-Korteweg 2001) which at km s-1 and km s-1 are known to form part of the Norma Wall.
A comparison of the magnitude histograms in squares centered on the density peaks (not shown here) supports the notion that the other four density peaks (#2 above the Galactic Plane, and #5, 6, 7 below) must be considerably more distant compared to the CIZA and Cen-Crux histograms. An independent analysis using photometric redshifts (see Sect. 4) confirms that these peaks are about 3 times more distant. They might well be connected to the Ara and Triangulum Australis clusters (both massive X-ray/CIZA clusters), possibly forming a filament that connects to the Shapley Concentration.
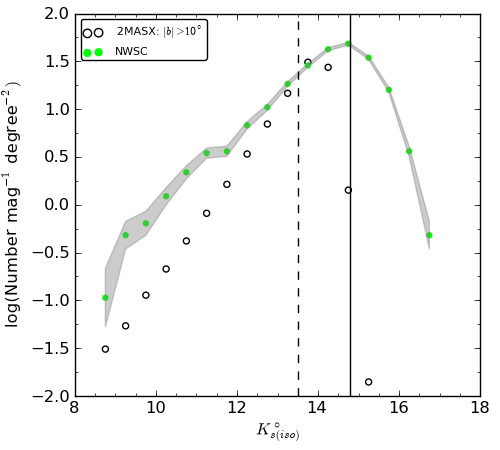
With no new clusters identified in the Norma Wall, the question arises what else we can learn about the mass density distribution. To assess this we compare in Fig. 2 the overall number counts to the mean density counts of the 2MASX all-sky survey outside of the ZOA () where 2MASX is complete for galaxies with (Skrutskie et al. 2006). The NWS counts reveal a clear density enhancement over the magnitude range and is particularly prominent for . This density enhancement is not caused by the CIZA and Cen-Crux clusters. Excluding the galaxies within a regions centered on these clusters affects the overall counts only minimally, even though the clusters themselves have counts that lie far above the NWS counts (e.g. Nagayama et al. 2006 for CIZA; Skelton et al. 2009 Norma). In addition, the bump perseveres whatever sub-area of the NWS we consider.
We then selected regions from the 2MASX redshift slices (Jarrett 2004) covering different environments and redshift intervals to gauge what kind of structures can reproduce the shape of the NWS counts. They include low-density regions, filamentary features connecting clusters, and wall-like features feeding into prominent clusters (but not cluster cores) at distances corresponding to the surroundings such as Virgo, Pavo, Norma, Vela and even Shapley.
The best correspondence was realized with wall-like structures at the approximate GA distance – with a slight improvement for the counts around if the line-of-sight also cuts through a higher redshift structure (like Shapley). The counts clearly are incompatible with more local overdensities (e.g. around Virgo) or very distant filaments (e.g. Shapley surroundings), nor clusters themselves.
In summary, the survey revealed no previously unknown clusters, but a clear excess in galaxies at the distance range of the Great Attractor that extends over the whole NWS area.
4 Assessment of the 3-D distribution
Localizing the density enhancement in space would be easier if the distances to the galaxies were known. However, only few redshifts exist in the literature for these highly obscured, previously mostly unknown galaxies. A search in NED found 128 (2.9%) redshifts – predominantly for galaxies at the lowest extinction levels. As a first proxy we therefore started working with photometric redshifts. This is hard in the ZOA due to the reddening effect of the selective absorption. Photometric redshifts were kindly determined for us by T. Jarrett based on his refined NIR phot-z estimator (Jarrett, in prep.).
A comparison with the 128 published spectroscopic redshifts in common found the errors of the photometric redshifts to be large (30-40%). This resulted in the signature of large-scale structures to be smeared out (galaxies in the GA region with are spread over ) – and skewed towards higher redshifts. This should be taken into account when interpreting the following results.
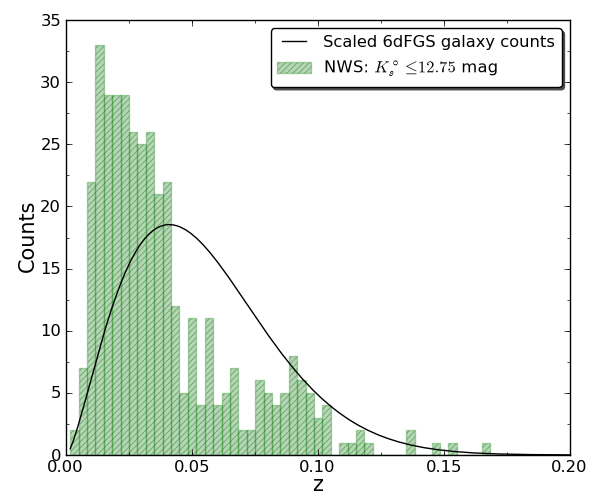
Figure 3 displays the redshift distribution as derived from phot-z for the NWS galaxy sample delimited by . This magnitude limit was imposed to allow a direct comparison with the 6dF Galaxy Survey (6dFGS; Jones et al. 2006) which has the same completeness limit. Their luminosity function is also plotted in Fig. 3, but scaled to the NWS counts. It is given here as a reference for the expected smooth distribution as derived over a large volume of space.
The redshift histogram shows a prominent broad excess in the phot-z range compared to the 6dFGS field counts. As argued above, this excess corresponds to the Norma Wall redshift range, with the broad width originating from the use of photometric redshift. Hence the histogram in Fig. 3 provides independent evidence that the density enhancement observed in Fig. 2 is caused by an excess of galaxies at the GA distance.
It is worthwhile pointing out that the overall height of the 6dFGS-distribution function would be considerably lower if it were scaled to counts that exclude the GA overdensity and be more typical of an average volume. With a lowered 6dFGS curve, however, the second peak that extends from would stand out also quite succinctly. In fact, this second peak is suggestive of an overdensity that corresponds to the high-density peaks identified in the lower panel of Fig. 1 – and the adjacent Ara and Triangulum Australis clusters – making the tantalizing link with the Shapley Concentration even more probable.
5 Mass estimate of the GA Wall overdensity
To derive an actual mass estimate of the overdensity we adopt the extent of the Norma Wall to be Mpc) across the sky (Radburn-Smith et al. 2006), with a mean cross-sectional radius of Mpc as suggested to be typical for filaments (Colberg et al. 2005). We assume the wall-like feature to be homogeneously filled with the here observed galaxy density. We then quantify the density enhancement by fitting a luminosity function to the observed overdensity. This allows a derivation of the excess luminosity density from integrating over the luminosity function. A suitable ratio will then yield a mass estimate for the above defined volume of the Norma Wall.
The density enhancement is quantified by two different methods. The first is based on the total NWS number counts from which the 2MASX whole sky counts are subtracted up to the common completeness limit . The resulting curve for the excess counts is displayed in the left panel of Fig. 4. The second method is based on galaxies that have phot-z values that localize the galaxies in the Great Attractor, i.e. galaxies with . This is plotted in the middle panel. The right-hand panel shows the two resulting curves on the same plot, emphasizing the superb agreement obtained by the two completely independent methods.
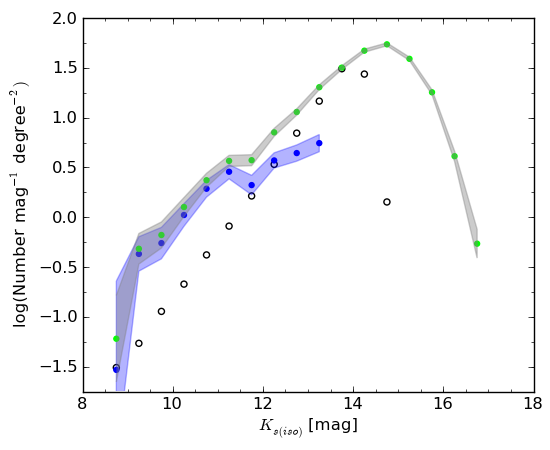
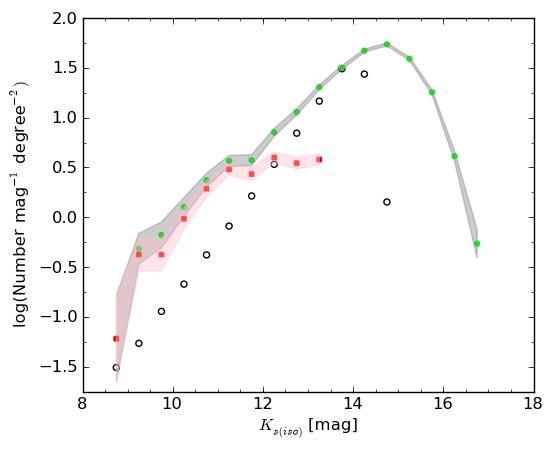
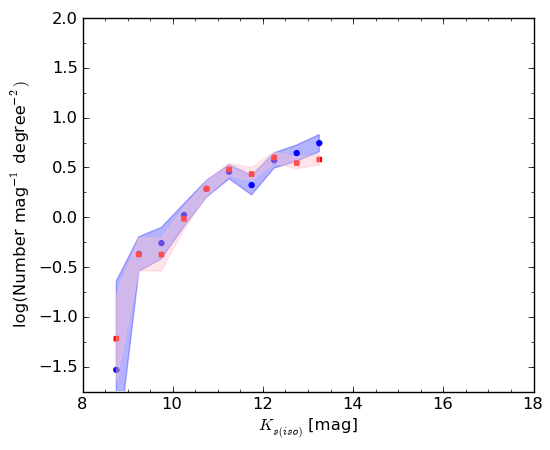
In a next step we determined the luminosity density of the excess galaxies by fitting a Schechter (1976) luminosity function to the above derived curves. To convert apparent magnitudes to absolute magnitudes the excess galaxies in the two distributions in Fig. 4 are assumed to be at the distance of the Norma cluster i.e. a mean of (4844 km s-1; Woudt et al. 2008). This is a simplification as we know the Norma Wall to extend to slightly higher redshifts as it crosses from Norma to the CIZA, Cen-Crux then Vela clusters.
The parameter sets of the resulting luminosity functions lie well within the range of what typically is found for -band cluster and field luminosity functions (Riad 2010). The excess counts have a steeper faint end, but brighter characteristic magnitude compared to the phot-z GA galaxies. This is probably due to the degeneracy in the value of and of the Schechter function. Despite these variations the resulting luminosity densities derived from integrating over the luminosity function are consistent (%).
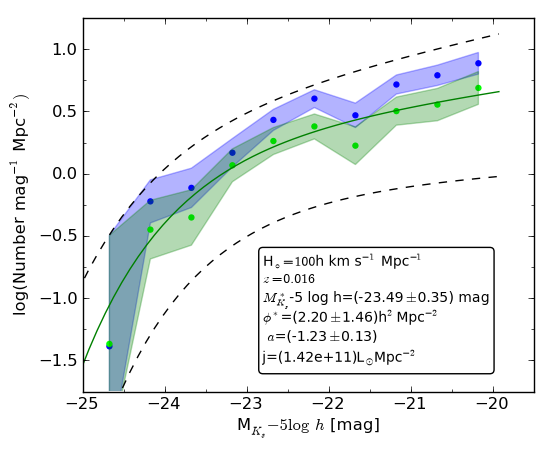
To get a better feel for the overall uniform density enhancement we exclude the clusters in first instance. As shown with Fig. 5, which shows both, the resulting LF is slightly shallower and the luminosity density with L⊙ Mpc-2 a bit lower (64%). To convert this into a mass estimate, we adopt the mass-to-light ratio from Rines et al. (2004) for regions within 1-10 Mpc of a galaxy cluster. The Norma wall is a rich structure with a number of known clusters embedded in it. This makes the use of their value of ML⊙ a reasonable assumption.
Filling a cylindrical volume of 84.5Mpc length and a radius of 2Mpc yields an excess mass in the Norma Wall of M⊙ – excluding clusters. The clusters Norma, Pavo II, CIZA J1324.7-5736, Cen-Crux and Abell S0639 contribute an additional mass of M⊙ (Riad 2010, Riad et al. 2011). This gives a combined mass of M⊙ for the Norma Wall as confined by the considered volume.
6 Conclusions
The homogeneous galaxy distribution over the survey footprint is
suggestive of a continuous structure across the GP, i.e. the so-called
Norma Wall. The Norma Wall survey did not uncover any previously
unknown clusters that form part of the GA overdensity. Assuming the
Great Attractor, respectively the Norma Wall, to be a cylindrical
filament of 84.5 Mpc in length with a radius of 2
Mpc that is filled uniformly by the mean overdensity derived at the
approximate GA distance, and including the Norma, Pavo II, CIZA
J1324.7-5736, Cen-Crux and Abell S0639 clusters, the total mass excess
in galaxies amounts to . This mass
is in good agreement with recent estimates for the mass of the Norma
Wall from optical, X-ray and HI observations (Radburn-Smith et
al. 2006; Kocevski et al. 2007; Stavely-Smith et al 2000) but lower
than the original estimate by Lynden-Bell et al. (1988).
Acknowledgements. — RCKK and IFR acknowledge financial support from the National Research Foundation through a mobility grant from the South African - Japanese (NRF/JSPS) bilateral grant in Astronomy. IFR was supported throughout his PhD studies by the University of Khartoum, South African National and the Stichting Steunfonds Soedanese Studenten. We are grateful to T. Jarrett for his derivation of the photometric redshifts.
References
- XX (xxxx) Colberg J.M., Krughoff K.S., & Connolly A.J. 2005, MNRAS 359, 272
- XX (xxxx) Ebeling H., Mullis C.R. & Tully R.B. 2002, ApJ 580, 774
- XX (xxxx) Jarrett T.H. 2004, PASP, 21, 396
- XX (xxxx) Jarrett T.H., Chester T., Cutri R. et al. 2000, AJ 119, 2498 [2MASX]
- XX (xxxx) Jones D.H, Peterson B.A, Colless M., & Saunders W. 2006, MNRAS 369, 25
- XX (xxxx) Kocevski D.D., Ebeling H., Mullis C.R. & Tully R.B. 2007, ApJ 662, 224
- XX (xxxx) Kraan-Korteweg, R.C. 2005, RvMA, 18, 48
- XX (xxxx) Kraan-Korteweg R.C. & Lahav O. 2000, A&ARv 10, 211
- XX (xxxx) Lynden-Bell D., Faber S.M., Burstein D. et al. 1988, ApJ 326, 19
- XX (xxxx) Nagayama T., Woudt P.A, Wakamatsu K., et al. 2006, MNRAS 368, 534
- XX (xxxx) Radburn-Smith D.J., Lucey J.R., Woudt P.A., Kraan-Korteweg R.C. & Watson F.G. 2006, MNRAS 369, 1131
- XX (xxxx) Riad I.F. 2010, PhD thesis, University of Cape Town
- XX (xxxx) Riad I.F., Kraan-Korteweg R.C. & Woudt P.A. 2010, MNRAS 401, 924
- XX (xxxx) Rines K., Geller M.J., Diaferio A., Kurtz M.J. & Jarrett T.H. 2004, AJ 128, 1078
- XX (xxxx) Schechter P. 1976, ApJ 203, 297
- XX (xxxx) Skelton R.E., Woudt P.A. & Kraan-Korteweg R.C. 2009, MNRAS 396, 2367
- XX (xxxx) Skrutskie M.F., Cutri R.M. Stiening, R. et al. 2006, AJ, 131, 1163
- XX (xxxx) Staveley-Smith L., Juraszek S., Henning P.A., Koribalski B.S. & Kraan-Korteweg R.C. 2000, ASP Conf. Ser. 218, 207
- XX (xxxx) Wakamatsu K. 2011, these proceedings
- XX (xxxx) Williams W.L., Woudt P.A. & Kraan-Korteweg R.C. 2011, these proceedings
- XX (xxxx) Woudt P.A. & Kraan-Korteweg R.C. 2001, A&A 380, 411
- XX (xxxx) Woudt P.A., Kraan-Korteweg R.C., Lucey J., Fairall A.P. & Moore S.A.W. 2008, MNRAS 383, 445