EVLA observations of the nebula around G79.29+0.46
Abstract
We have observed the radio nebula surrounding the Galactic LBV candidate G79.29+0.46 with the EVLA at 6 cm. These new radio observations allow a morphological comparison between the radio emission, which traces the ionized gas component, and the mid-IR emission, a tracer of the dust component. The IRAC () and MIPS ( and ) images have been reprocessed and compared with the EVLA map. We confirm the presence of a second shell at 24 and also provide evidence for its detection at . The differences between the spatial morphology of the radio and mid-IR maps indicate the existence of two dust populations, the cooler one emitting mostly at longer wavelengths. Analysis of the two dusty, nested shells have provided us with an estimate of the characteristic timescales for shell ejection, providing important constraints for stellar evolutionary models.
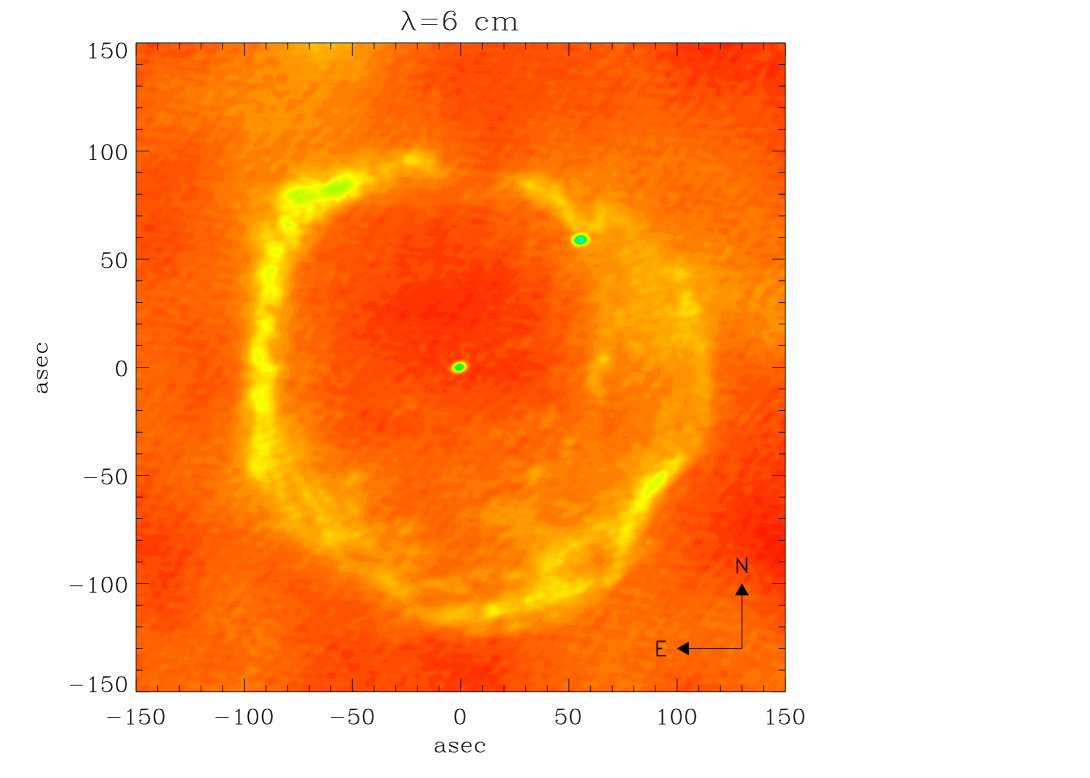
Finer details of the ionized gas distribution can be appreciated thanks to the improved quality of the new 6 cm image, most notably the highly structured texture of the nebula. Evidence of interaction between the nebula and the surrounding interstellar medium can be seen in the radio map, including brighter features that delineate regions where the shell structure is locally modified. In particular, the brighter filaments in the south-west region appear to frame the shocked southwestern clump reported from CO observations.
1 Introduction
Massive stars play a fundamental role in the evolution of galaxies. They are major contributors to the interstellar UV radiation and, via their strong stellar winds, provide enrichment of processed material (gas and dust) and mechanical energy to the interstellar medium. Despite their importance, the details of post-MS evolution of massive stars are still poorly understood. Recent evolutionary models suggest that Luminous Blue Variables (LBVs) and related transition objects may play a key role in the massive star evolution, representing a crucial phase during which a star loses most of its H envelope (Lamers et al., 2001). More recently, it has also been pointed out that LBVs might be direct Supernovae progenitors (Kotak & Vink, 2006; Smith et al., 2008), enhancing their importance in the framework of stellar evolution
LBVs are luminous (intrinsically bright, ) objects, exhibiting different kinds of photometric and spectroscopic variabilities. They are massive (), characterized by intense mass-loss rates (), which can also occur in the form of eruptive events. Although eruptive events have been witnessed very rarely (e.g., Car and P Cyg) the presence of extended, dusty circumstellar nebulae around LBVs (LBVNe) suggests that they are a common aspect of LBV behavior (Weis, 2008). There are, however, many aspects of LBV phenomenon that are not completely understood. Among these are the total mass lost during the LBV phase (a key parameter necessary to test evolutionary models), the origin and shaping of the LBVNe, and how the mass-loss behavior (single versus multiple events, bursts) is related to the physical parameters of the central object.
The mass-loss archeology of the central object can be recovered from an analysis of its associated nebula. A successful approach is based on a synergistic use of different techniques, at different wavelengths, that allows one to analyze the several emitting components coexisting in the nebula. In particular, a detailed comparison of mid-IR and radio maps, with comparable spatial resolution, has provided estimates of both ionized gas and dust masses and allowed us to sort out morphological differences in the maps which can be associated with mass-loss behaviour during the LBV phase (Buemi et al., 2010; Umana et al., 2010).
1.1 The nebula surrounding G79.29+0.46
G79.29+0.46 is considered a LBV candidate because its observed properties to date do not meet the requirements of spectral and photometric variability to be accepted as a bona-fide member. However, variations, suggestive of mass-loss variability during S-Dor variations, have recently been reported by Vink et al. (2008).
The highly symmetric ringlike structure surrounding G79.29+0.46 was first pointed out by Wendker et al. (1991). The thermal nature of the continuum radio emission was determined by Higgs et al. (1994), who suggested that the ringlike nebula is an ionized shell of swept-up interstellar material. By examining the IRAS high-resolution images, Waters et al. (1996) concluded that the ringlike nebula is a detached shell formed during an epoch of high mass loss () followed by a quieter period. This scenario is consistent with G79.29+0.46 being a LBV, where different mass loss events may have occurred in the recent past.
More recently, the Spitzer Space Telescope has provided high-sensitivity, high-resolution IRAC and MIPS maps (The Cygnus-X Spitzer legacy program, Hora et al., 2010) which provides a better understanding of the dust properties (Kraemer et al., 2010). Moreover, the detection of CO millimetre emission in G79.29+0.46 (Rizzo et al., 2008) demonstrates that another component, consisting of molecular gas, is present in the surroundings of this star and should be included in the budget of the total mass lost from the central object. In their CO maps of G79.29+0.46, Rizzo et al. (2008) identified components of warm and dense molecular gas whose morphology closely resembles that of the extended IRAS nebula. They also reported the presence of a shock front, interpreted as a natural consequence of different wind regimes during the central object’s evolution.
Despite the wealth of new mid-IR and mm observations of the sources, our knowledge of the radio emission has been limited to the 1988 VLA data reported by Higgs et al. (1994) and on the 1400 and 350 MHz Westerbork observations, carried out between 1996 and 1997 and reported by Setia Gunawan et al. (2003). In this paper, we present new EVLA observations with sufficient dynamical range, sensitivity, and angular resolution to provide a good match to the Spitzer images. The EVLA observations allow, for the first time, a detailed morphological comparison with other maps tracing the different components of the nebula.
2 Observations and Data Reduction
2.1 EVLA observations
Radio observations of G79.29+0.46 and its associated nebula were carried out with the EVLA111The National Radio Astronomy Observatory is a facility of the National Science Foundation operated under cooperative agreement by Associated Universities, Inc. on 2010 June 1 and 11 and 2010 December 1 and 5. The source was observed at two frequencies (1.4 and 5 GHz), with a total bandpass of 256 MHz and in two different array configurations (D and C). For each configuration and frequency, the same observing scheme was followed; namely, a 5 minute on-source scan preceded and followed by a 1 minute scan on the phase calibrator, for a total of 75 minutes on-source integration time. The source J0137+3309 was used to fix the absolute amplitude scale and to correct for the bandpass. Table 1 contains a summary of the observing details. The data reduction was carried out within the Common Astronomical Software Applications (CASA) package, version 3.0.2. At each frequency, the data from each configuration were first independently calibrated and then combined into a single UV data set. The imaging process was performed by setting the Briggs robust parameter equal to 0, a compromise between uniform weighting of the baseline for highest angular resolution and natural weighting for highest sensitivity. We also used a multi-scale CLEANing algorithm, intended for high resolution image but sensitive to extended structures (Brogan et al., 2006), resulting in a single image with a rms noise of 0.07 and a synthetic beam of 456309 for the 5 GHz observations, and a rms noise of 0.5 and a synthetic beam of 185 186 for the 1.4 GHz observations.
2.2 Spitzer data
2.2.1 IRAC data
Infrared imaging of the field including G79.29+0.46 was performed at 3.6,
4.5, 5.8, and 8.0 m with the InfraRed Array Camera (IRAC) (Fazio et al., 2004) on the Spitzer
Space Telescope (Werner et al., 2004). All available data for G79.29+0.46
from the cryogenic Spitzer mission archive
were used, including AORIDs 6050560, 17330688, 27106560, and 27107584. The observations used the 12 and
30 second HDR modes, which obtain integrations with frame times of 0.6 & 12 seconds and
1.2 & 30 seconds, respectively.
The Basic Calibrated Data (BCD) were retrieved from the archive
(pipeline version S18.18), and additional interactive processing was performed using the
imclean222http://irsa.ipac.caltech.edu/data/SPITZER/docs/dataanalysistools/tools/
contributed/irac/imclean/
tools to remove image artifacts from bright sources, including muxbleed, banding,
and column pulldown effects (Hora et al., 2004).
Mosaics at each wavelength were constructed using
IRACproc (Schuster et al., 2006), combining the data which was taken at different spacecraft
orientations and resampling to a final image pixel size of 06. Outliers due to
cosmic rays or instrument artifacts not previously flagged are removed in this process.
The images were combined using a weighting based on the integration time of the frames.
In pixels that are saturated in the longer exposures, only the shorter frames are used in the final
image.
2.2.2 MIPS data
The MIPS data was taken as part of the Cygnus-X Spitzer Legacy program (PID 40184, PI J. Hora) in the fast scanning mode with a cross scan step of to fill the array, resulting in an integration time of 15.7 seconds per pixel on a single scan leg at both 24 and 70. The data were reprocessed using the MIPSGAL (Carey et al., 2009) data processing pipeline (Mizuno et al., 2008). The 70 data also used the MIPSGAL pipeline (Paladini et al., 2011) with the exception that the non-linearity correction at 70 was done per pixel using the prescription defined by the SINGS Legacy team (Dale et al., 2007), based on the behavior of the MIPS 70 calibrators.
3 The radio nebula associated with G79.29+0.46
As we intend to compare the spatial distribution of the ionized gas component, traced by the radio observations, with the morphology of the dust component, traced by the mid-IR observations, in the following we will analyze and discuss only the 5 GHz dataset, as that image provides details with a spatial resolution comparable to that of Spitzer observations. The morphology of the radio nebula is evident in our 6 cm EVLA multi-configuration image, which reveals a well defined shell-like structure whose overall shape was previously reported by Higgs et al. (1994). However, the improved quality of our image, shown in Figure 1, allows us to discern finer details of the ionized gas distribution, most notably the highly structured texture of the nebula. There is evidence for interaction between G79.29+0.46 and the surrounding interstellar medium: i.e., the bright frontal structures in the northeast and the southwest regions of the nebula that delineate regions where the shell structure is locally modified. In particular, the brighter filaments in the south-west region appears to frame the shocked southwestern clump observed in CO (Rizzo et al., 2008; Jimenez-Esteban et al., 2010).
The central object is well-detected, as is the (probably extragalactic) background object to the northwest. The position, flux density and angular sizes of these components have been derived by fitting two dimensional Gaussian brightness distributions to the map. We obtained a flux density of and mJy for the central and background components, respectively. The uncertainty associated with the flux density estimation is given by:
| (1) |
where is the rms noise in the map, and is the systematic error due to the flux calibrator (typically on the order of 3).
Within the errors, the derived flux densities are in agreement with those determined by Higgs et al. (1994), who derived a spectral index of between 5 and 8.4 GHz. They pointed out that, even though this spectral index is steeper than the canonical , it is still consistent with mass-loss from a stellar object.
Assuming that the central radio source is related to the stellar wind from the LBV, we can derive its current-day mass-loss from the standard formula (Panagia & Felli, 1975):
| (2) |
where full ionization and cosmic abundances have been assumed, is the observed radio flux density, in mJy, and is the terminal velocity of the wind in .
The free-free Gaunt factor is approximated by
(Leitherer & Robert, 1991).
From the radio flux density observed at 5 GHz, assuming as stellar wind velocity a value of (Voors et al., 2000), a wind
temperature of K and a distance of 1.7 kpc (Jimenez-Esteban et al., 2010), we
derive a mass loss rate of
.
Vink et al. (2008) pointed out the possibility that G79.29+0.46 is associated with the nearby DR15 region rather than with Cyg OB2. If this is the case, G79.29+0.46 is likely to be closer, at about .
Since mass-loss scales with the distance as , this would imply a reduced mass-loss of a factor 0.45.
These values are smaller, but still consistent, with previous evaluations obtained by other authors using
different techniques (e.g., Waters et al., 1996), but it is at least an order of magnitude smaller than the current-day mass-loss rates derived from radio measurements for
other LBVs (Umana et al., 2010).
4 Ionized component versus dust components
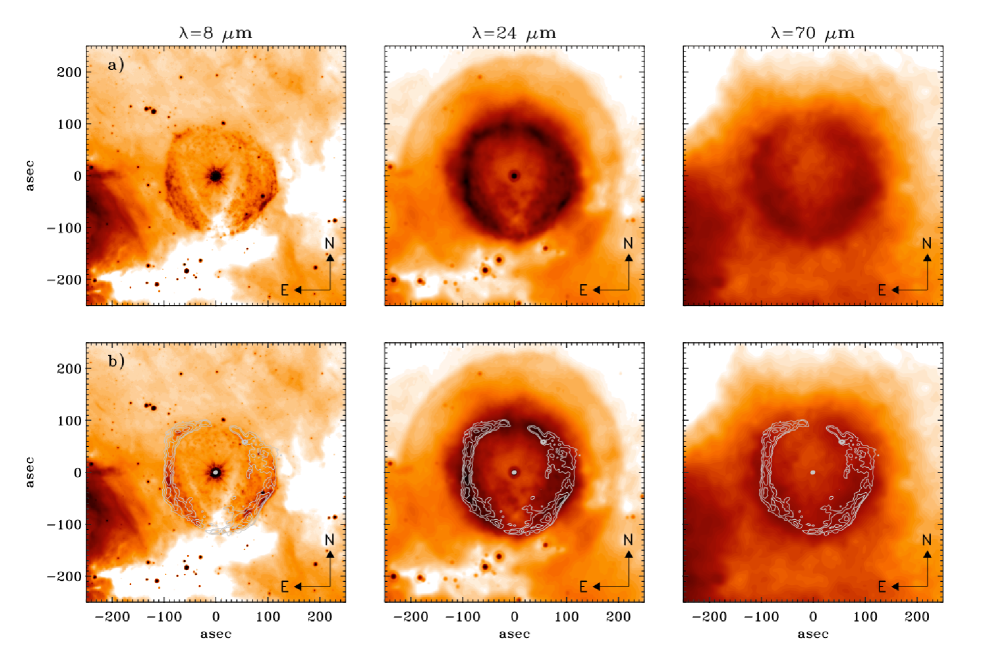
The m IRAC and and MIPS images of G79.29+0.46 are shown in Figure 2a. Previous versions of these images were presented by Kraemer et al. (2010) and Jimenez-Esteban et al. (2010), who both pointed out the presence of a second larger radius shell in the m image. Our reprocessed maps confirm the existence of the second m shell and, thanks to our improved reduction, also provide a hint of its presence at m. Both the and m maps show the same overall distribution of the dust, consistent with at least two nested dusty shells surrounding the LBV. On the contrary, in the m map where a major contribution from warm dust is expected, the dust appears to be more concentrated in two south-west and south-east regions. The new EVLA radio observations allow, for the first time, a morphological comparison between the ionized gas and the dust. In Figure 2b, the same maps are shown but now with the 6 cm EVLA map superimposed using white contours. Once again there is a difference between the IRAC and MIPS maps: while the nebular emission at both m and m is more extended than the ionized gas (radio nebula), the m emission appears well-contained within the ionized part of the nebula. Moreover, while the radio emission from the nebula is incomplete in the north region, the emission at m and m has a more uniform distribution. The apparent lack of dust in the southern regions in both m and m are perhaps due to an absorption effect caused by the infrared dark cloud (IRDC) which may be located in front of the the southern region of the nebula.
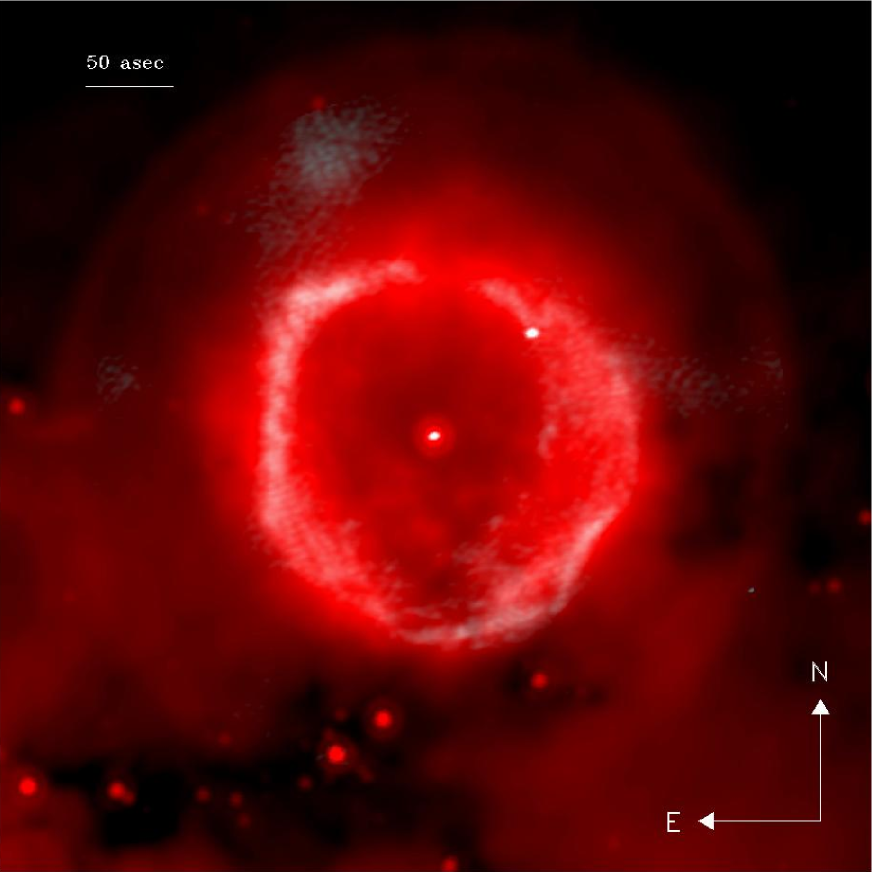
To better visualize the spatial distribution of ionized gas relative to the dust, surface brightness profiles have been extracted along cuts through the nebula from the 6 cm, m and m maps. However, a direct comparison can be performed only between the 6 cm and the m maps, as they share a comparable angular resolution, for the 6 cm EVLA versus for the m MIPS map. A superposition of the 6 cm EVLA map on the m map is shown in Figure 3. We extracted eighteen cuts from each map and determined an azimuthally-averaged source profile, shown in (Figure 4). The radio shell has a smaller thickness and a sharp decreasing trend in the outer part of the nebula. The dust nebula is more extended and shows a smoother distribution in the outer regions. The second shell is clearly evident in the m profile, at a distance of about from the center. At the same distance, less defined peaks are visible in the m profile, smoothed out by the coarser spatial resolution.
5 Discussion and Conclusions
In this letter we present new radio EVLA observations of the nebula surrounding the LBV G79.29+0.46. In particular, we have analyzed the 6 cm map and, for the first time, compared the radio free-free, which traces the spatial distribution of the ionized gas, with maps recently obtained in the mid-IR, which traces the spatial distribution of the dust component.
The dust distribution observed at m appears different than the distribution at and m. The warmer dust, traced by the m emission, is more concentrated in the southwest and southeast regions. Moreover, when compared with the radio nebula, the and m emission appears more extended, while the m emission is well-contained inside the radio nebula. This is consistent with the existence of two dust components: a cooler component traced by the and m emission, and a warmer dust component, probably consisting of smaller grains, traced by the m emission. This warmer component, with morphological properties quite different from those observed at longer wavelengths, could be related to the PAH emission that has been claimed by Jimenez-Esteban et al. (2010).
An improved MIPS m map, constructed using the most updated pipeline from MIPSGAL team, detects the presence of a second shell very similar to that seen at m. Nebular lines and dust continuum are the main possible contributors to the m emission from objects embedded in a dusty nebula with a hot central component. The possibility of such a combination, with one kind of emission being predominant, has been suggested by Mizuno et al. (2010) to explain the m emission detected in the MIPSGAL Bubbles. In the case of G79.29+0.46, the presence of similar shells at m and at m, together with the lack of any prominent emission line falling within the response curve of the MIPS m band, as evident from the low-resolution IRS spectrum of the shell (Jimenez-Esteban et al., 2010), leaves very little doubt that the shell emission is entirely due to thermal dust emission.
The fact that there are at least two nested shells provides strong constraints on the the origin of the nebula, as it is difficult to explain the presence of multiple shells in the hypothesis of a nebula consisting of swept-up ISM material, as suggested by Higgs et al. (1994). It is evident that the dusty shells consist of material ejected by the central object in different mass-loss episodes.
From the m emission profile, we have determined that the inner shell peaks at and the second one at from the central object. Such dust emission peaks can be related to the epoch when enhanced mass-loss took place. Assuming a distance of 1.7 kpc (Jimenez-Esteban et al., 2010), this corresponds to a linear distance of pc and pc, respectively. This implies, assuming a shell expansion velocity of (Waters et al., 1996), that the two mass-loss episodes occurred and years ago, or and years ago, if a distance of 1 kpc, as suggested by Vink et al. (2008), is used. Our results point out that mass-loss can occur in different episodes, for which we derived characteristics timescales, and pose quite strong constraints that stellar evolution models must take into account.
The direct comparison of the 6 cm and m maps (that share comparable spatial resolution) indicates that only part of the inner, brighter nebula is ionized, (i.e. the nebula is ionization bounded). The radio nebula shows a sharper profile, depicting regions where probable interaction between the second and the first dusty shells is taking place. This is evident in several regions, most notably in the northeast and in the southwest part of the nebula, where the overall quite regular shell-like morphology is locally disturbed. The mid-IR dust emission depends linearly on density and as a modified blackbody on temperature; the mid-IR emission is therefore most sensitive to dust temperature. On the other hand, assuming an uniform temperature, the thermal radio emission depends on the square of the ionized gas density. This different dependence on density means that the radio emission will emphasize features that have the largest density. This is consistent with the spatial coincidence of the bright radio features with the CO emission reported by Rizzo et al. (2008) and Jimenez-Esteban et al. (2010). In particular, the high critical density of the CO line () indicates that the CO emission traces higher density regions, confirming that the brighter radio features delineate interactions between the shells where shocks can occur.
| Observing | EVLA | Frequency | Integration time | Phase Cal |
|---|---|---|---|---|
| dates | Conf. | GHz | (min) | |
| 2010 June 1 | D | 1.4 | 90 | J2052+3635 |
| 2010 June 11 | D | 4.9 | 90 | J2015+3710 |
| 2010 Dec. 1 | C | 1.4 | 90 | J2015+3710 |
| 2010 Dec. 5 | C | 4.9 | 90 | J2015+3710 |

References
- Brogan et al. (2006) Brogan, C. L., Gelfand, J. D., Gaensler, B. M., Kassim, N. E., Lazio, T. J. W. 2006, ApJ, 639, 25
- Buemi et al. (2010) Buemi, C. S., Umana, G., Trigilio, C., Leto, P., Hora, J. L., 2010, ApJ, 721, 1404.
- Carey et al. (2009) Carey, S. J., Noriega-Crespo, A., Mizuno, et al. 2009, PASP121, 76.
- Clark et al. (2005) Clark, J. S., Larionov, V. M., Arkharov, A. 2005, A&A, 239, 246
- Dale et al. (2007) Dale, D. A., Gil de Paz, A., Gordon, K. D. et al. 2007, ApJ655, 863
- Fazio et al. (2004) Fazio, G. G., Hora. J. L., Allen, L. E., et al. 2004, ApJS, 154, 10
- Higgs et al. (1994) Higgs, L. A., Wendker, H. J., Landecker, T.L., 1994, 291, 291
- Hora et al. (2004) Hora, J. L., Fazio, G. G., Allen, L. E., et al. 2004, Proc. SPIE 5487, 77
- Hora et al. (2010) Hora, J. L., Gutermuth, R. A., Carey, S. et al. 2010, in Reionization to Exoplanets: Spitzer’s Growing Legacy, ASP Conf. Series, in press
- Kotak & Vink (2006) Kotak, R., Vink, J.S., 2006, A&A, 460, L5.
- Kraemer et al. (2010) Kraemer, K. E. , Hora, J. L., Egan, M. P. et al 2010, ApJ139, 2329.
- Jimenez-Esteban et al. (2010) Jimenez-Esteban, F. M. et al., 2010, ApJ, 713, 429.
- Lamers et al. (2001) Lamers, H. J. G. L. M., Nota, A., Panagia, N., Smith, L. J. & Langer, N. 2001, ApJ, 551, 754
- Leitherer & Robert (1991) Leitherer, C., Robert, C. 1991, ApJ, 377, 629
- Mizuno et al. (2010) Mizuno, D. R., Kraemer, K. E., Flagey, N., Billot, N., Shenoy, S., Paladini, R., Ryan, E., Noriega-Crespo, A., Carey, S. J., 2010 AJ, 139, 1542
- Mizuno et al. (2008) Mizuno, D. R., Carey, S. J., Noriega-Crespo, A. et al. 2008, PASP120, 1028.
- Panagia & Felli (1975) Panagia N., Felli M. 1975, A&A39, 1
- Paladini et al. (2011) Paladini, R., Noriega-Crespo, A., Carey, S. J. et al. (in preparation).
- Rizzo et al. (2008) Rizzo, J.R., Jimenez-Esteban, F. M., Ortiz, E., 2008, ApJ, 681,
- Smith et al. (2008) Smith, N., Chornock, R., Li, W., Ganeshalingam, M., Silverman, J.M., Foley, R.J., Filippenko, A. V., Barth, A.J., 2008, ApJ, 686, 467 355
- Setia Gunawan et al. (2003) Setia Gunawan, D.Y.A., de Bruyn, A.G., Van Der Hucht, K.A., Williams, P. M., 2003, ApJS, 149, 123
- Schuster et al. (2006) Schuster, M.T., Marengo, M., & Patten, B.M. 2006, SPIE Proc. 6270-74
- Umana et al. (2010) Umana, G., Buemi, C. S., Trigilio, C., Leto, P., Hora, J. L., 2010, ApJ, 718, 1036
- Vink et al. (2008) Vink, J. S., Drew, J. E., Steeghs, D., Wright, N.J., Martin, E. L., Gansicke, B. T., Greimel, R., Drakee, J., 2008, MNRAS, 387, 308.
- Voors et al. (2000) Voors, R. H. M., Geballe, T. R., Waters, L. B., F. M., Najarro, F., Lamers, H.J.G.L. M., 2000, A&A, 362, 236.
- Waters et al. (1996) Waters, L.B.F.M., Izumiura, H., Zaal, P. A., Geballe, T.R., Kester, D.J.M., Bontekoe, t.R., 2000, A&A, 313, 866
- Wendker et al. (1991) Wendker, H. J., Higgs, L. A., Landecker, T. L. 1991, A&A, 241, 551.
- Werner et al. (2004) Werner, M. W., et al. 2004, ApJS, 154, 1
- Weis (2008) Weis, K. 2008 in Clumping in hot-star winds: proceedings of an international workshop held in Potsdam, Germany, 18-22 June 2007. W. R., Hamann, A. Feldmeier and L. M. Oskinova (eds). p.183