Discovering the missing 2.2z3 quasars by combining optical variability and optical/near-IR colors 111Observations reported here were obtained at the Bok telescope of Steward Observatory, and at the MMT Observatory, a joint facility of the University of Arizona and the Smithsonian Institution.
Abstract
The identifications of quasars in the redshift range 2.2z3 are known to be very inefficient as their optical colors are indistinguishable from those of stars. Recent studies have proposed to use optical variability or near-IR colors to improve the identifications of the missing quasars in this redshift range. Here we present a case study by combining both factors. We select a sample of 70 quasar candidates from variables in SDSS Stripe 82, which are non-UV excess sources and have UKIDSS near-IR public data. They are clearly separated into two parts on the Y-K/g-z color-color diagram, and 59 of them meet or lie close to a newly proposed Y-K/g-z selection criterion for z4 quasars. 44 of these 59 sources have been previously identified as quasars in SDSS DR7, and 35 among them are quasars at 2.2z3. We present spectroscopic observations of 14 of 15 remaining quasar candidates using the Bok 2.3m telescope and the MMT 6.5m telescope, and successfully identify all of them as new quasars at z=2.36 to 2.88. We also apply this method to a sample of 643 variable quasar candidates with SDSS-UKIDSS nine-band photometric data selected from 1875 new quasar candidates in SDSS Stripe 82 given by Butler & Bloom based on the time-series selections, and find that 188 of them are probably new quasars with photometric redshifts at 2.2z3. Our results indicate that the combination of optical variability and optical/near-IR colors is probably the most efficient way in finding 2.2z3 quasars and very helpful for constructing a complete quasar sample. We discuss its implications to the ongoing and upcoming large optical and near-IR sky surveys.
1 Introduction
Since their discovery in 1960s (Schmidt 1963), quasars have become important extra-galactic objects in astrophysics. They not only can be used to probe the physics of supermassive black holes and accretion/jet process, but also are closely related to the studies of galaxy evolution, intergalactic medium, large scale structure and cosmology. More than 120,000 quasars have been discovered from the large optical sky surveys, such as the Two-Degree Fields survey (Boyle et al. 2000) and the Sloan Digital Sky Survey (SDSS, York et al. 2000; Schneider et al. 2010). The quasar candidates in these surveys were mainly selected by optical colors, namely that, due to the strong UV and optical emissions, quasars at and can be distinguished from the stellar objects in the color-color and color-magnitude diagrams based on optical photometry (Smith et al. 2005; Richards et al. 2002; Fan et al. 2000). However, in the redshift range , the redshifted spectral energy distributions of quasars show similar optical colors to that of normal stars, and quasar selections using the optical color-color diagrams become very inefficient due to the serious contaminations of stars (Fan 1999; Richards et al. 20002; 2006; Scheneider et al. 2007). Because of the crucial importance of z2.2 quasars in studying the Ly forest and cosmic baryon acoustic oscillation (BAO) (White 2003; McDonald & Eisenstein 2007) and in constructing the accurate luminosity function to study the quasar evolution in the mid-redshift universe (Wolf et al. 2003; Jiang et al. 2006), we have to explore other efficient ways to identify the missing quasars.
In the last a few years, two main approaches have been taken to separate quasars and stars rather than using optical color-color diagrams. The first approach is to use optical variability, as this is one of the well known quasar properties (Hook et al. 1994; Cristiani et al. 1996; Giveon et al. 1999). Schmidt et al. (2010) have proposed a method to select quasar candidates by their intrinsic variability. They showed that the quasar structure functions, constructed from the light-curves of known quasars in SDSS Stripe 82 (hearafter S82; see also Sesar et al. 2007), can be modeled by a power-law function with amplitude A and power-law index . Quasars can be separated from stars in the plane, which enables efficient selection of quasar candidates based on long-term single-band optical photometry (Schmidt et al. 2010). They also pointed out that in the redshift range , variability can help to select quasars with a completeness of 90. MacLeod et al. (2011) also developed a method to use the damping timescale and asymptotic amplitude of variable sources in S82 to separate quasars from stars with an efficiency higher than 75%. Butler & Bloom (2011) recently presented a similar time-series study of quasars in S82, and proposed to use two statistics, a quasar-like variability metric and a non-quasar variability metric, to yield the separation of quasar candidates from stars. They claimed that with their method they can achieve nearly a factor of two increase of quasars at . In addition, very recent results from the SDSS-III Baryon Oscillation Spectroscopic Survey (BOSS; Eisenstein et al. 2011) also confirmed the high success rate of spectroscopically identifying variability selected quasars, which leads to a significant increase of z2.2 quasar density in S82 than that based on optical colors only (Palanque-Delabrouille et al. 2011; Ross et al. 2011).
The second approach to separate z2.2 quasars from stars is to utilize their near-IR colors. As the continuum emission from stars usually decreases more rapidly from optical to the near-IR wavelengths than that of quasars, the near-IR colors for stars are different from quasars. This leads to a method to use the K-band excess to identify quasars at z2.2 (eg. Warren, Hewett & Foltz 2000; Croom, Warren & Glazebrook 2001; Sharp et al. 2002; Hewett et al. 2006; Chiu et al. 2007; Maddox et al. 2008; Smail et al. 2008; Wu & Jia 2010). Using the photometric data in the bands of SDSS DR7 (Abazajian et al. 2009) and YJHK bands of UKIRT InfraRed Deep Sky Surveys (UKIDSS222 The UKIDSS project is defined in Lawrence et al. (2007). UKIDSS uses the UKIRT Wide Field Camera (WFCAM; Casali et al. 2007) and a photometric system described in Hewett et al. (2006). The pipeline processing and science archive are described in Hambly et al. (2008).) Large Area Survey (LAS) DR3, Wu & Jia (2010) compiled a sample of 8498 SDSS-UKIDSS quasars and a sample of 8996 SDSS-UKIDSS stars. Based on these two samples they compared different optical/near-IR color-color diagrams and proposed an efficient empirical criterion for selecting z4 quasars in the near-IR YK and optical gz color-color diagram (i.e. , where all magnitudes are Vega magnitudes). With this criterion, they obtained the completeness of 98.6 of recovering z4 quasars with the mis-identifying rate of 2.3 of classifying stars as quasars. A check with the FIRST (Becker, White & Helfand 1995) radio-detected SDSS quasars, which are believed to be free of color selection bias, also proved that with this Y-K/g-z criterion they can achieve the completeness higher than 95 for these radio-detected quasars with z3.5, which seems to be difficult in the case of using the SDSS optical color selection criteria alone where a dip around z2.7 in the redshift distribution obviously exists (Richards et al. 2002,2006; Scheneider et al. 2007,2010). Recently, Peth, Ross & Schneider (2011) extended the study of Wu & Jia (2010) to a much larger sample of 130000 SDSS-UKIDSS selected quasar candidates and re-examined the methods of separating stars and mid-redshift quasars with the near-IR/optical colors. Using the Y-K/g-z selection criterion, Wu et al. (2010a,b) also successfully identified some quasars during the commissioning period of the Chinese GuoShouJing Telescope (LAMOST), which provides further supports to the effectiveness of selecting the mid-redshift quasars using the optical/near-IR colors.
Although both approaches we mentioned above can be used to identify quasars at , a more ideal approach is to combine the variability and optical/near-IR color to achieve the maximum efficiency. In this paper, we present a case study by selecting a sample of variable, non-UV excess, SDSS-UKIDSS quasar candidates in S82 (Schmidt et al. 2010), and spectroscopically identifying 14 new quasars at z=2.36 to 2.88. We also apply this method to some new variable quasar candidates in S82 recently suggested by Butler & Bloom (2011) and found that 188 SDSS-UKIDSS sources are probably new quasars with 2.2z3. We describe the sample selections and spectroscopic observations in Section 2, present more new 2.2z3 quasar candidates in S82 in Section 3 and discuss the results in Section 4.
2 Target selections and spectroscopic observations
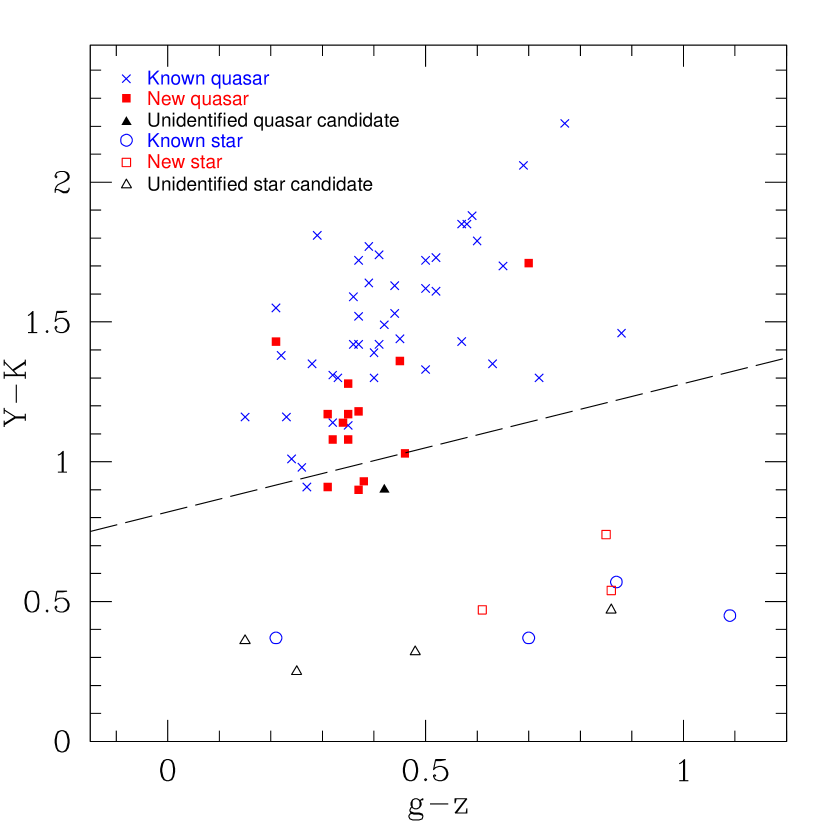
Our purpose is to efficiently select quasars by combining the variability and optical/near-IR colors, so we focus on S82 region where both variability and SDSS-UKIDSS photometric data are available with high quality. A sample of 118 non-UV excess quasar candidates from S82 has been selected with the algorithm presented in Schmidt et al. (2010), which have UV-optical colors similar to that of stars (i.e. consistent with the observed colors of quasars at and optical variability properties consistent with the region defined by quasars on the plane). 70 of them have near-IR YJHK photometric data from the UKIDSS/LAS DR4333Available at http://surveys.roe.ac.uk/wsa/. All photometric magnitudes are corrected for Galactic extinction using a map of Schlegel, Finkbeiner & Davis (1998). We plot the 70 objects on the Y-K/g-z color-color diagram (see Fig. 1). They are clearly separated into two parts on this diagram. 54 sources match the selection criterion of defined for z4 quasars (here we convert the original criterion given in Wu & Jia (2010) to a new one to keep the g and z magnitudes in AB system and Y and K magnitudes in Vega system, see dashed line in Fig. 1). Five sources locate slightly below but very close to the criterion. Therefore, we think these 59 sources are probably quasars. The photometric redshifts of these 59 sources are estimated to be from z=2.43 to 3.05 using their nine-band SDSS-UKIDSS photometric data with a program introduced in Wu & Jia (2010). Indeed, 44 among them have been spectroscopically identified as quasars by SDSS previously. These 44 known quasars have spectroscopic redshifts from 0.59 to 3.29, and 35 of them are quasars. The spectroscopic redshifts for 40 of these 44 known quasars are consistent with their photometric redshifts within . This confirms the high efficiency of selecting quasars by combining the variability and optical (g-z)/near-IR (Y-K) color. Spectroscopic identification of the remaining 15 quasar candidates is needed.
Apart from the above 59 quasar candidates, the other 11 objects are located much below the quasar selection criterion in Fig. 1, and their Y-K and g-z colors are indistinguishable from those of stars in the stellar locus (see Fig. 5 of Wu & Jia (2010)). In addition, ten of them have very bright optical magnitudes (i.e. ) and are unlikely to be quasars at the expected redshifts (). Indeed, four of them (SDSS J034751.14-001730.7, SDSS J035208.92+005919.6, SDSS J224630.25+010018.3 and SDSS J225342.13+011207.1) have already been cataloged as stars in the SIMBAD database444http://simbad.u-strasbg.fr/simbad/.
As we mentioned above, spectroscopic identification is still required for the remaining 15 quasar candidates with in S82. All of them have -band magnitudes brighter than 19.3. In this paper we present optical spectra for 14 of them555The only one left is SDSS J220808.97+002858.3 with a photometric redshift of 2.78. We are planning to observe it in the fall of 2011.. Eight of them were observed using the Boller & Chivens Spectrograph on the Bok 2.3m Telescope at Kitt Peak in November 2010. The observation covers a wavelength range of 3620–6900 with a spectral resolution of 8.3 . The spectra of the other six objects were obtained with the Blue Channel Spectrograph on the MMT 6.5m Telescope at Mt. Hopkins in December 2010, with a wavelength coverage of 3600 to 8000 and a spectral resolution of 5.8 . We reduce the data with IRAF package and some broad line emissions, such as Ly+, +, and , have been clearly detected in the spectra of all of 14 quasar candidates. We measure the redshifts of these 14 new quasars by fitting Gaussian line profiles to the Ly+, + and emission lines. The details of the sources and observational results, including their names, coordinates, magnitudes, exposure times, photometric and spectroscopic redshifts, are summarized in Table 1. The spectra of these 14 new quasars with z=2.36 to 2.88 taken with Bok and MMT are presented in Fig. 2 and Fig. 3, respectively. These observations clearly demonstrated the high efficiency of selecting quasars by combining the variability and optical/near-IR colors.
For the 11 sources located much below the quasar selection criterion of the Y-K/g-z color-color diagram, we also took the spectra of one of them (SDSS J035658.21+003801.8, =18.69) with the Bok 2.3m telescope in November 2010 and two of them (SDSS J034950.99+ 010845.9, =11.63 and SDSS J035816.05+002351.9, =13.58) with the 2.16m telescope of Xinglong/NAOC in January 2011, and confirmed their nature as stars due to the lack of emission lines and the presence of Balmer absorption features. Together with other four previously known stars, seven of these 11 sources located in the stellar locus have been identified as stars. Although there are still four sources remaining unidentified, they are obviously too bright () to be quasars. Therefore, we believe that all these 11 sources are stars with certain level of optical variability. Combining with their optical/near-IR colors we can easily separate them from quasars.
3 More quasar candidates in SDSS Stripe 82
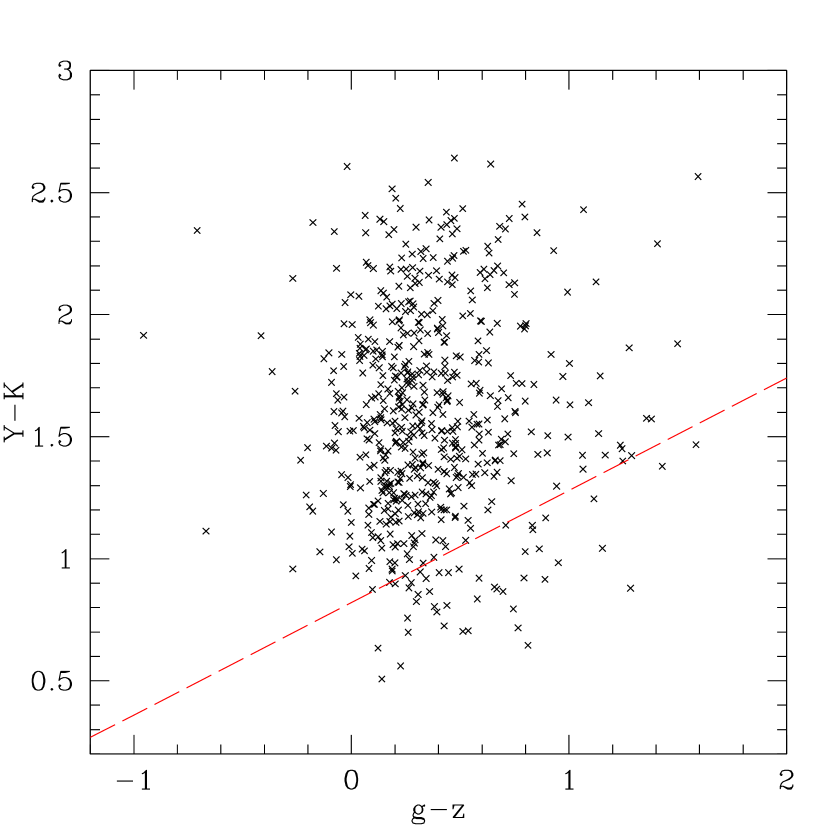
In a recent paper, Butler & Bloom (2011) presented a similar time-series study of quasars in S82 as in Schmidt et al. (2010) and MacLeod et al. (2011). They proposed two different statistics, namely a quasar-like variability metric and a non-quasar variability metric, to separate quasar candidates from stars. They obtained 1875 new quasar candidates in S82 and claimed that with their method they can achieve nearly a factor of two increase of quasars at . Here we use their variable quasar candidates to cross-correlate with the sources in the UKIDSS/LAS DR5 and obtained 643 new quasar candidates with SDSS-UKIDSS nine-band photometric data. In Fig. 4 we plot these sources in the Y-K/g-z diagram, in comparison with the quasar selection criterion suggested by Wu & Jia (2010). 597 of these 643 sources (with a fraction of 93) meet the selection criterion, suggesting that most of them should be real quasars with z4. This comparison also provides mutual support to the quasar selection method based on variability or optical/near-IR colors.
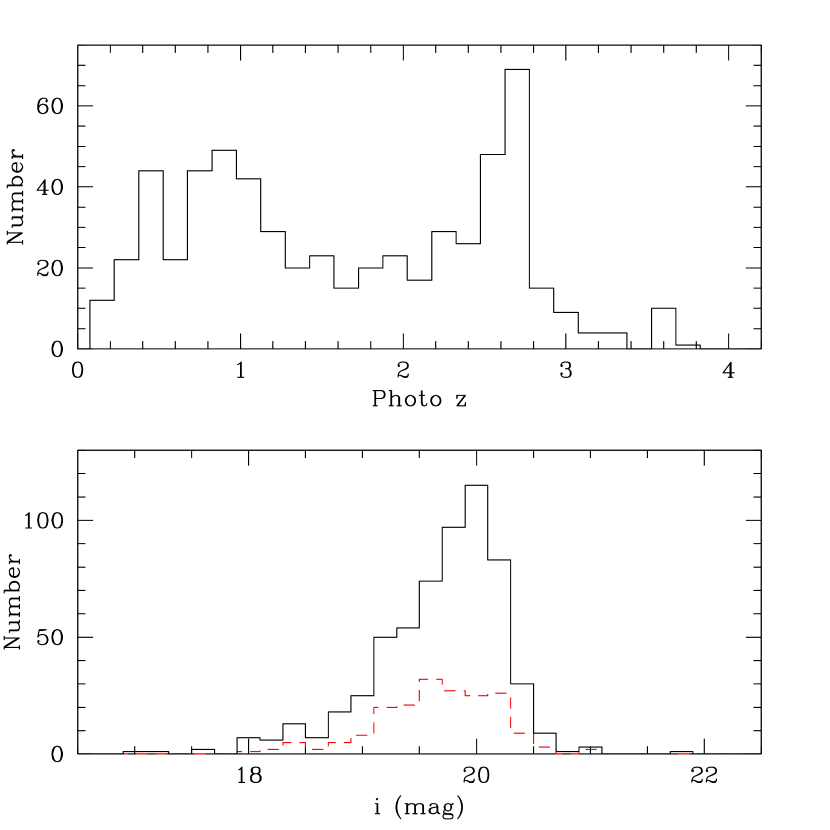
For more reliably selecting quasars from these 597 quasar candidates, we used a program introduced in Wu & Jia (2010) to estimate the photometric redshifts of quasar candidates based on their SDSS-UKIDSS nine-band photometric data. In the upper panel of Fig. 5 we show the photometric redshift distribution of these 596 new quasar candidates. Although they distribute in a broad redshift range from 0.1 to 3.8, obviously a large fraction of them are at . Among these 597 quasar candidates, 244 sources have photometric redshifts larger than 2 and 188 of them are quasar candidates. Considering the fact that only 948 quasars at in S82 have been identifed in the SDSS DR7 (Schneider et al. 2010), the fraction of quasar candidates in our SDSS-UKIDSS variable source sample is significantly higher. This is understandable because SDSS quasar survey mainly focused on finding quasars with z2.2 and z3.5 (Richards et al. 2002). Many quasars with are therefore missing in the SDSS quasar survey but can be discovered by combining variability and optical/near-IR colors as we suggested in this paper.
In the lower panel of Fig. 5 we show the distribution of the dereded -band magnitudes of 597 quasar candidates, as well as that of 188 quasar candidates at . Clearly, majority of them are located between and . This is also the reason why they are missing in the SDSS survey because most of the SDSS known quasars have . We expect that the ongoing BOSS survey in SDSS III, which aims to discover 150000 quasars with z2.2 (Eisenstein et al. 2011; Ross et al. 2011), could confirm the quasar nature and redshifts of these quasar candidates soon. In Table 2 we listed the coordinates, photometric redshifts, and SDSS and UKIDSS magnitudes of the 188 quasar candidates at . We also noticed that three bright sources () among them have been spectroscopically identified by us in Section 2.
4 Discussion
We have presented a case study to demonstrate that we can effectively select quasars by combining the optical variability and optical/near-IR colors. Our successful spectroscopic identifications of 14 new quasars at z=2.36 to 2.88 with the Bok 2.3m telescope and the MMT 6.5m telescope provide further support to this combination approach, which can be used to select quasars with probably the highest efficiency (here we define the efficiency as the percentage of quasars identified from the spectroscopic targets, similar to the definition in SDSS-III (Ross et al. 2011)). We also compiled a catalog of 188 quasar candidates with photometric redshifts at from variable SDSS-UKIDSS sources in S82, and expect that the ongoing SDSS III spectroscopy will confirm their quasar nature and redshifts soon.
We noticed that although combining the optical/near-IR colors and time-series information can help increase the efficiency in identifying quasars, it may decrease the completeness of quasars if both selection criteria on colors and variability are required. This can also be seen from Fig. 1 and Fig. 4 as some quasars selected by variability do not meet our color selection criterion. One possible way to avoid this is to decrease the threshold for each criterion. For example, relaxing our color criterion to would include all variability-selected quasars in Fig. 1 and 98.8% of variability-selected quasar candidates in Fig. 4, without increasing much contamination from stars as most of them are less variable and still far away from our color selection criterion. However, how to best combine both the optical/near-IR colors and time-series information to select quasars with both higher efficiency and higher completeness obviously needs more investigations in the future based on complete samples of quasars and stars in certain sky areas.
For using this combination approach, we need both the optical variability measurements and optical/near-IR photometry in a large sky area. Especially for finding z quasars, deeper imaging and multi-epoch photometry are neccesary. However, so far both variability and optical/near-IR photometric observations have been realized only for a small part of the sky, such as in S82. Because the typical variability timescales of quasars are usually in years in the optical band, we need to measure the variability of sources for many epochs in at least several years in order to get better statistics to determine their variability features. That is why so far the variability studies related to quasars have been done only on some smaller sky areas, which significantly limits the efforts in discovering quasars with variability. However, even if we may not have both time-series and color information for quasar candidate selection in most sky areas, utilizing both information as much as possible often allows us to get the most quasars. Fortunately, there are also several ongoing and upcoming large projects with both photometric and variability information, especially the Panoramic Survey Telescope & Rapid Response System (Pan-STARRS; Kaiser et al. 2002) and the Large Synoptic Survey Telescope (LSST; Ivezic et al. 2008). The multi-epoch photometry in multi-bands covering a large part of the sky by these facilities will hopefully provide better opportunities to use variability to construct a much larger sample of quasars than that currently available.
On the other hand, several ongoing and upcoming optical and near-IR photometric sky surveys will also provide crucial helps to us to extend the SDSS-UKIDSS optical/near-IR color selection of quasars to larger and deeper fields. In addition to SDSS III (Eisenstein et al. 2011), which has taken 2500 deg2 further imaging in the south galactic cap, the SkyMapper (Keller et al. 2007) and Dark Energy Survey (DES; The Dark Energy Survey Collaboration 2005) will also present the multi-band optical photometry in 20000/5000 deg2 of the southern sky, with the magnitude limit of 22/24 mag in -band, respectively. The Visible and Infrared Survey Telescope for Astronomy (VISTA; Arnaboldi et al. 2007) will carry out its VISTA Hemisphere Survey (VHS) in the near-IR YJHK bands for 20000 deg2 of the southern sky with a magnitude limit at K=20.0, which is about five magnitude and two magnitude deeper than the Two Micron ALL Sky Survey (2MASS; Skrutskie et al. 2006) and UKIDSS/LAS limits (Lawrence et al. 2007), respectively. Therefore, the optical and near-IR photometric data obtained with these ongoing and upcoming surveys will provide us a large database for quasar selections. By combining the optical variability and the optical/near-IR colors, we expect that a much larger and more complete quasar sample can be efficiently constructed in the near future.
Although by combining the variability and optical/near-IR colors we can efficiently select quasar candidates and reliably estimate their photometric redshifts, the spectroscopic identifications are still crucial to determine their quasar nature and redshifts. The ongoing BOSS project in SDSS III has identified 29000 quasars with and expects to obtain the spectra of 150000 quasars at (Eisenstein et al. 2011; Ross et al. 2011). We believe that many quasars, including the candidates we listed in this paper, should be spectroscopically identified by BOSS. In addition, the Chinese GuoShouJing telescope (LAMOST; Su et al. 1998), a spectroscopic telescope with 4000 fibers currently in the commissioning phase, is also aiming at discovering 0.3 million quasars with magnitudes bright than (Wu et al. 2010b). By combining the variability and optical/near-IR colors, large input catalogs of reliable quasar candidates will be provided to these quasar surveys for future spectroscopic observations. Therefore, we expect that a much larger and more complete quasar sample covering a wider range of redshift will be constructed in the near future, which will play an important role in studying extra-galactic astrophysics, including the physics of accretion around supermassive black holes, galaxy evolution, intergalactic medium, large scale structure and cosmology.
References
- Abazajian et al. (2009) Abazajian, K., et al., 2009, ApJS, 182, 543
- Arnaboldi et al. (2007) Arnaboldi, M., et al., 2007, The Messenger, 127, 28
- Becker, White & Helfand (1995) Becker, R.H., White, R.L., & Helfand, D.J., 1995, ApJ, 450, 559
- Boyle et al. (2000) Boyle, B.J., et al., 2000, MNRAS, 317, 1014
- Butler & Bloom (2011) Butler, N.R., & Bloom, J.S., 2011, AJ, 141,93
- Casali et al. (2007) Casali, M., et al., 2007, A&A, 467, 777
- Chiu et al. (2007) Chiu, K., Richards, G.T., Hewett, P.C., Maddox, N., 2007, MNRAS, 375,1180
- Cristiani et al. (1996) Cristiani, S., et al., 1996, A&A, 306, 395
- Croom, Warren & Glazebrook (2001) Croom, S.M., Warren, S.J., & Glazebrook, K., 2001, MNRAS, 328, 150
- Eisenstein et al. (2011) Eisenstein, D., et al. 2011, ApJ submitted, arXiv:1101.1529
- Fan (1999) Fan, X., 1999, AJ, 117, 2528
- Fan et al. (2000) Fan, X., et al. 2000, AJ, 120, 1167
- Giveon et al. (1999) Giveon, U., et al. 1999, MNRAS, 306, 637
- Hambly et al. (2008) Hambly, N., et al., 2008, MNRAS, 384, 637
- Hewett et al. (2006) Hewett, P.C., Warren, S.J., Leggett S.K., Hodgkin S.T. 2006, MNRAS, 367, 454
- Hook et al. (1994) Hook, I.M., McMahon, R.G., Boyle, B., & Irwin, M.J., 1994, MNRAS, 268, 305
- Ivezic et al. (2008) Ivezic, Z., et al. 2008, arXiv:0805.2366
- Jiang et al. (2006) Jiang, L., et al. 2006, AJ, 131, 2788
- Kaiser et al. (2002) Kaiser, N., et al., 2002, Proc. SPIE, 4836, 154
- Keller et al. (2007) Keller, S.C., et al. 2007,PASA,24,1
- Lawrence et al. (2007) Lawrence, A., et al., 2007, MNRAS, 379, 1599
- MacLeod et al. (2011) MacLeod, C.L., et al., 2011, ApJ, 728, 26
- Maddox et al. (2008) Maddox, N., Hewett, P.C., Warren, S.J., Croom, S.M. 2008, MNRAS, 386, 1605
- McDonald & Eisenstein (2007) McDonald, P. & Eisenstein, D.J., 2007, Phys. ReV. D, 76, 063009
- Palanque-Delabrouille et al. (2011) Palanque-Delabrouille, P., et al., 2011, A&A, in press (arXiv:1012.2391)
- Peth, Ross & Schneider (2011) Peth, M.A., Ross, N.P. & Schneider D.P., 2011, AJ, 141, 105
- Richards et al. (2002) Richards, G.T., et al., 2002, AJ, 123, 2945
- Richards et al. (2006) Richards, G.T., et al., 2006, AJ, 131, 2766
- Ross et al. (2011) Ross, N., et al., 2011, ApJ submitted, arXiv:1105.0606
- Schlegel, Finkbeiner & Davis (1998) Schlegel, D.J., Finkbeiner, D.P., & Davis, M. 1998, ApJ, 500. 525
- Schneider et al. (2007) Schneider, D.P., et al., 2007, AJ, 134, 102
- Schneider et al. (2010) Schneider, D.P., et al., 2010, AJ, 139, 2360
- Schmidt et al. (2010) Schmidt, K.B., et al. 2010, ApJ, 714,1194
- Schmidt (1963) Schmidt, M., 1963, Nature, 197, 1040
- Sesar et al. (2007) Sesar, B., et al., 2007, AJ, 134, 2236
- Sharp et al. (2002) Sharp, R.G., et al., 2002, MNRAS, 337, 1153
- Skrutskie et al. (2006) Skrutskie, M.F., et al., 2006, AJ, 131, 1163
- Smail et al. (2008) Smail, I., et al., 2008, MNRAS, 389, 407
- Smith et al. (2005) Smith, J.R., et al., 2005, MNRAS, 359, 57
- Su et al. (1998) Su, D.Q., Cui, X., Wang, Y., Yao, Z., 1998, Proc. SPIE, 3352, 76
- The Dark Energy Survey Collaboration (2005) The Dark Energy Survey Collaboration, 2005, astro-ph/0510346
- Warren, Hewett & Foltz (2000) Warren, S.J., Hewett, P.C., & Foltz, C.B., 2000, MNRAS, 312, 827
- White (2003) White, M., 2003, The Davis Meeting on Cosmic Inflation, p. 18, astro-ph/0305474
- Wolf et al. (2003) Wolf, C., et al., 2003, A&A, 408, 499
- Wu et al. (2010a) Wu, X.-B., et al., 2010a, RAA, 10, 737
- Wu et al. (2010b) Wu, X.-B., et al., 2010b, RAA, 10, 745
- Wu & Jia (2010) Wu, X.-B., & Jia, Z., 2010, MNRAS, 406, 1583
- York et al. (2000) York, D.G., et al., 2000, AJ, 120,1579
| Name | RA | Dec | i | Exposure Time | Telescope | ||
|---|---|---|---|---|---|---|---|
| (SDSS) | degree | degree | s | ||||
| J000050.59+010959.1 | 0.21081 | 1.16644 | 19.22 | 2.58 | 2.37 | 3600 | BoK |
| J000121.87000327.1 | 0.34113 | 0.05754 | 18.47 | 2.78 | 2.88 | 300 | MMT |
| J002117.11002841.7 | 5.32131 | 0.47824 | 18.68 | 2.68 | 2.85 | 300 | MMT |
| J013450.27+003537.1 | 23.70948 | 0.59367 | 17.52 | 2.68 | 2.69 | 3600 | Bok |
| J022836.08+000939.2 | 37.15035 | 0.16091 | 18.34 | 2.68 | 2.63 | 3600 | Bok |
| J034025.90+000807.6 | 55.10792 | 0.13545 | 19.08 | 2.63 | 2.64 | 3600 | Bok |
| J034008.54+010714.8 | 55.03557 | 1.12081 | 18.88 | 2.83 | 2.84 | 2400 | Bok |
| J034337.67000350.2 | 55.90698 | 0.06395 | 18.14 | 2.88 | 2.85 | 3600 | Bok |
| J214633.34+000318.5 | 326.63895 | 0.05516 | 17.83 | 2.83 | 2.79 | 600 | MMT |
| J221602.32+005826.5 | 334.00967 | 0.97406 | 17.86 | 2.83 | 2.83 | 1200 | Bok |
| J225257.56+004524.0 | 343.23984 | 0.75669 | 19.25 | 2.83 | 2.74 | 900 | MMT |
| J225355.31+005146.1 | 343.48050 | 0.86281 | 19.24 | 2.43 | 2.37 | 1800 | Bok |
| J231302.58+004105.1 | 348.26074 | 0.68475 | 19.17 | 2.73 | 2.63 | 600 | MMT |
| J233659.54+003843.5 | 354.24808 | 0.64543 | 18.89 | 2.68 | 2.72 | 300 | MMT |


| RA | Dec | u | g | r | i | z | Y | J | H | K | |
|---|---|---|---|---|---|---|---|---|---|---|---|
| degree | degree | ||||||||||
| 0.21081127 | 1.16643864 | 2.575 | 19.731 | 19.138 | 19.090 | 19.181 | 18.985 | 18.294 | 18.142 | 17.669 | 16.891 |
| 0.34113037 | 0.05754064 | 2.825 | 19.751 | 18.737 | 18.499 | 18.386 | 18.452 | 17.578 | 17.212 | 16.799 | 16.529 |
| 0.42223178 | 0.29444873 | 2.425 | 20.592 | 19.933 | 19.786 | 19.754 | 19.469 | 18.910 | 18.494 | 18.290 | 17.374 |
| 0.44474748 | 0.66631052 | 2.775 | 20.408 | 19.471 | 19.249 | 19.215 | 19.244 | 18.437 | 18.166 | 17.645 | 17.079 |
| 0.50900025 | 0.70452072 | 2.425 | 21.735 | 20.360 | 20.146 | 20.089 | 19.735 | 19.245 | 18.777 | 18.296 | 17.136 |
| 0.54000096 | 0.03205093 | 2.675 | 20.864 | 19.865 | 19.728 | 19.802 | 19.773 | 18.913 | 18.825 | 18.170 | 17.920 |
| 0.54369966 | 1.02404081 | 2.775 | 21.279 | 19.679 | 19.220 | 19.206 | 19.267 | 18.204 | 17.953 | 17.524 | 17.044 |
| 0.55005872 | 0.54818141 | 2.675 | 20.648 | 19.664 | 19.610 | 19.555 | 19.472 | 18.729 | 18.538 | 18.192 | 17.671 |
| 0.90385887 | 1.17817945 | 2.325 | 20.304 | 19.843 | 19.953 | 19.934 | 19.889 | 19.346 | 19.307 | 18.910 | 18.002 |
| 1.06989716 | 0.24487200 | 2.475 | 21.075 | 20.298 | 20.305 | 20.353 | 20.079 | 19.190 | 19.119 | 18.678 | 17.877 |
Note: The SDSS ugriz magnitudes are AB magnitudes and the UKIDSS YJHK magnitudes are Vega magnitudes. Only a portion of the table is shown here. The whole table will be available online.