Multi-Wavelength Observations of a Flux Rope Failed in the Eruption and Associated M-Class Flare from NOAA AR 11045
Abstract
We present the multi-wavelength observations of a flux rope that was trying to erupt from NOAA AR 11045 and the associated M-class solar flare on 12 February 2010 using space and ground based observations from TRACE, STEREO, SOHO/MDI, Hinode/XRT and BBSO. While the flux rope was rising from the active region, an M1.1/2F class flare was triggered nearby one of its footpoints. We suggest that the flare triggering was due to the reconnection of a rising flux rope with the surrounding low-lying magnetic loops. The flux rope reached a projected height of with a speed of 90 km s-1 while the soft X-ray flux enhanced gradually during its rise. The flux rope was suppressed by an overlying field and the filled plasma moved towards the negative polarity field to the west of its activation site. We find the first observational evidence of the initial suppression of a flux rope due to a remnant filament visible both at chromospheric and coronal temperatures that evolved couple of days before at the same location in the active region. SOHO/MDI magnetograms show the emergence of a bipole 12 h prior to the flare initiation. The emerged negative polarity moved towards the flux rope activation site, and flare triggering near the photospheric polarity inversion line (PIL) took place. The motion of the negative polarity region towards PIL helped in the build-up of magnetic energy at the flare and flux rope activation site. This study provides a unique observational evidence of a rising flux rope that failed to erupt due to a remnant filament and overlying magnetic field, as well as associated triggering of an M-class flare.
keywords:
Solar flare – coronal loops, magnetic field, flux rope, magnetic reconnection.1 Introduction
Magnetic dynamo action in the solar interior continuously generates magnetic flux tubes that rise through the photosphere, add new magnetic flux systems to the photosphere, and finally fan out in the corona [Schrijver and Title (1999), Aschwanden (2004)]. Such magnetic flux systems in the active regions are aligned with overlying arch filament systems, emerging in the form of /U-loops, or may exhibit “sea-serpent”–like shapes (\inlineciteasc2004 and references therein). The newly emerging and growing magnetic fluxes may compel the topological changes in the overlying coronal magnetic fields, which may involve magnetic reconnection processes and their consequence in the form of eruptions at large and small spatial-temporal scales. MHD simulations of such magnetic flux tubes have been performed in the subphotospheric layers [Fan (2001), Fan and Gibson (2003), Fan and Gibson (2004)] and also in the corona [Shibata et al. (1990)]. Emergence of magnetic field and its reconnection with the pre-existing field is not only responsible for the occurrence of large-scale eruptive phenomena, but it may also be the triggering mechanism for small-scale solar transients and explosive events (\openciteroussev2001a,2001b, 2001c). Recently, the emergence of magnetic flux rope from the convection zone to the corona and its interaction with the pre-existing fields have been modelled and simulated by various authors (e.g., \opencitearch2004, 2005, 2007).
The emergence of a dipole is not a sufficient condition to trigger a flare, because the emerging flux region may be too small or may have a non-favourable orientation Martin et al. (1984); Aschwanden (2004). Pre-flare brightenings and flares probably may not have direct relevance with the emerging flux tubes in many cases. However, they may be associated with the coupled energy release processes such as current driven plasma micro-instabilities, etc.Karpen and Boris (1986). It is most likely that the magnetic flux emergence does not trigger flares directly, but may instead increase the magnetic complexity locally by adding new magnetic flux and, helicity, or by inducing motions of sunspots. When this magnetic complexity crosses the critical threshold, flares and associated eruptions may be triggered Aschwanden (2004); Srivastava et al. (2010). However, flare models that are directly driven by flux emergence have also been reported Heyvaerts, Priest, and Rust (1977); Aschwanden (2004). Moreover, the rising process of the magnetic field through the convection zone and its emergence through the photosphere, chromosphere and corona are not well understood. The exact reason of the activation of helicity and twist in the pre-existing magnetic flux ropes are also not well explored both in the observations and theory.
The magnetic flux from the sub-photospheric levels may also be associated with the helicity and twist, which leads to more stored magnetic energy and instabilities. Recently, more observational signatures became evident that one of the origins of this twist is at a near sub-photospheric level from which the flux tube swirls above the surface Bonet et al. (2008); Wedemeyer-Böhm and Rouppe van der Voort (2009). These phenomena are also described by recent theoretical models Simon and Weiss (1997); Shelyag et al. (2011, 2011); Fedun et al. (2011). The solar flares are mainly distinguished by two categories, i.e., confined and eruptive flares, and both of them usually take place in rather complex morphology of overlying magnetic fields in the active regions. The helicity and instability generated in such complex magnetic fields are the most likely cause of stored excess energy in the active regions that is later released in the form of solar flares and initiates the related plasma eruptions. The emergence of such twisted and unstable magnetic flux tubes, or their activation and interactions in the active regions, may also trigger the flare energy release and associated eruptions as studied recently by ,e.g., \inlinecitepankaj2010a, \inlinecitepankaj2010b, \inlinecitepankaj2010c, \opencitesri2010. On the modelling side, most of the numerical simulations have used magnetic flux emergence and sunspot rotation caused by photospheric plasma flows to increase the magnetic helicity leading to the final eruption (e.g., \openciteamari2000, \opencitetorok2003, 2005).
shen2011 have reported the dynamics of a filament that failed in the eruption several times, and finally succeeded to erupt with the triggering of a C-class flare process and associated CME on 8 February 2010 from active region (AR) NOAA 11045. Before that work, the observational evidence of flux ropes failed in eruption has been reported as well Ji et al. (2003); Alexander, Liu, and Gilbert (2006); Liu et al. (2009). \inlineciteboris2001 have studied the critical height and compared it with the stability criterion of the filaments. However, most of the previous observational studies of failed eruption could not reveal the exact mechanism associated with it. In this paper, we will study the dynamics of a flux rope in the AR 11045 on 12 February 2010 that moved up higher in the corona but still failed in the eruption. We also study the energy build-up and release processes of an M-class flare associated with the activation of this flux rope. We find the first observational signature of the rising flux rope that is failed due to an overlying remnant filament. In Section 2 we will present the multi-wavelength observations. We will discuss the magnetic configuration and scenario of the event in Section 3. Discussion and Conclusions will be presented in the last section.
2 Observations
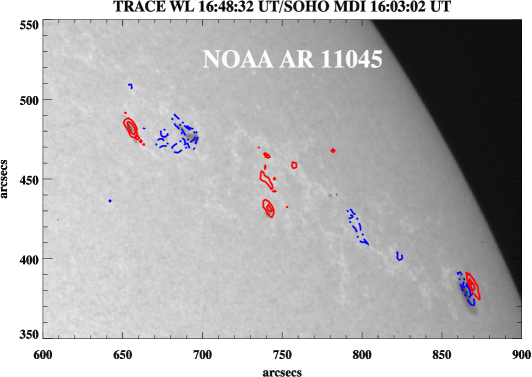
The active region NOAA 11045 appeared to be very dynamic and produced more than 40 flares above C-class from 6 to 14 February 2010 Xu et al. (2010) during its passage over the solar disk. NOAA 11045 continued to decay on 12 February 2010 and was located near the western limb (N22,W66) showing a magnetic configuration (Figure \irefwl_mdi). However, this active region also showed a rapid and large flux emergence during its journey over the solar disk. According to GOES soft X-ray flux measurements the M-class flare on 12 February 2010 was started at 17:52 UT, reached a maximum at 18:08 UT, and ended at 18:15 UT (refer to Figure \irefht). The flare was classified as 2F which initiated at 17:59 UT and ended at 18:41 UT in H. The flare plasma was gradually rising with the activation and upward motion of a rising flux rope at the same site, which finally failed in the eruption. In the following subsections we describe the multi-wavelength observations of a rising twisted flux rope and associated M-class flare.
2.1 BBSO H and STEREO Observations
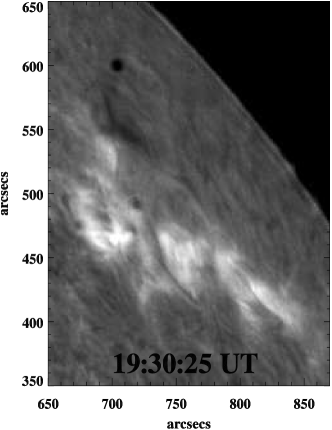
Figure \irefbbso displays selected H images of the active region observed at Big Bear Solar Observatory (BBSO). A careful investigation of the H data reveals a rising bright twisted flux rope structure below the remnant dark filament (indicated by arrows). The H images show a rising bright structure as part of the flux rope, and two ribbon flare nearby one of the footpoints at its activation site. However, we note that there was a small remnant filament structure lying above the rising flux rope. This part of the filament was visible before and after the activation and rise of the flux rope, and acted like a semi-circular cavity inside which the twisted flux rope was situated and confined initially. Here we note only that this moving structure is not a part of an existing filament. However, it can be a part of a complex flux rope containing both the remnant filament and the flux tubes that, were not filled with dense plasma initially. The bright flux rope in H indicates a high temperature of the structure compared to the cool quiescent filaments. Twists in the structure may also be noticed in these images, showing a transversal kink–like structure.
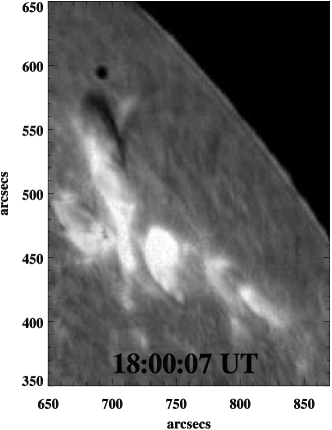
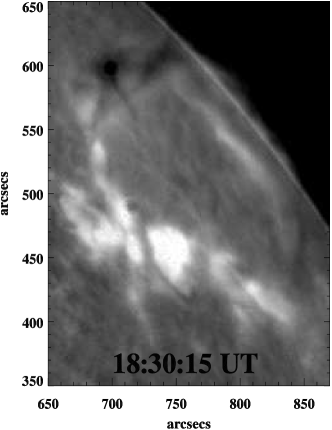
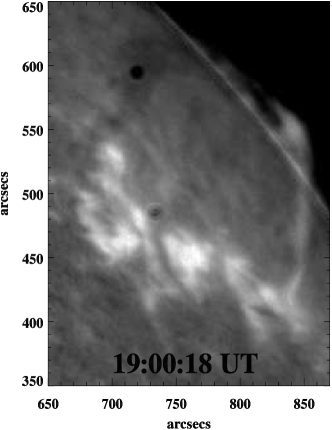
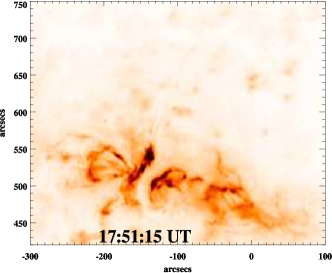
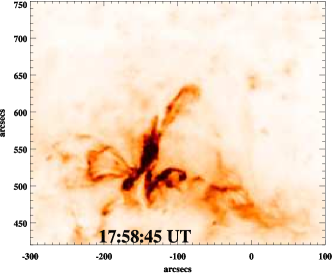
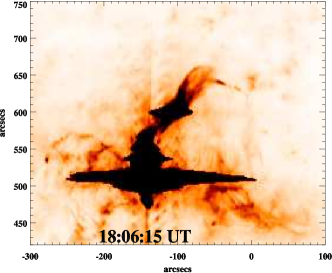
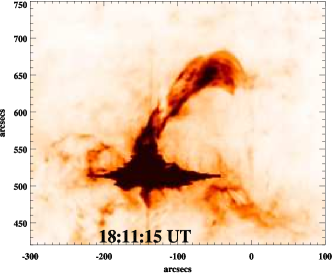
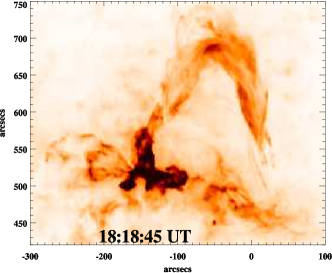
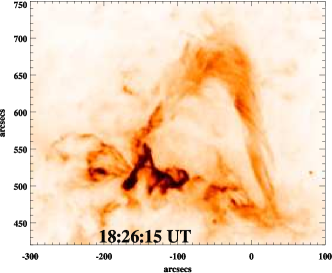
Figure \irefsecchi_304 is a selected but typical sequence of EUV (304 Å) STEREO-A /SECCHI images. This wavelength corresponds to the emission from ionized helium (He ii), which forms at temperatures above 80,000 K. The BBSO H images represent the plasma formed at 104 K temperature in the chromosphere, while the STEREO He ii 304 Å images also reveal the upper chromosphere and lower transition region at greater temperature. The NOAA AR 11045 was located near the center of the solar disc (in the eastern side) in the field of view of STEREO-A SECCHI. On the other hand, TRACE also observed NOAA AR 11045 near to the western limb. Therefore, the observations of the same active region from different angles provide the opportunity to view the structure from different view angles. These observations show a rising plasma structure maintained at coronal temperature as indicated by arrows. Initially, the structure was visible at 17:51 UT associated with a flare initiation (refer to the first image). Then, the plasma associated with the flux rope started to move up. The flare was triggered nearby the eastern footpoint of the structure as it moved away from the active region. The flare maximum took place at 18:07 UT. The leading edge of the twisted structure reached the maximum distance from the footpoint, at the projected height of 150 Mm (see the panel at 18:11 UT on Figure 3). The flare brightening started to reduce as the structure started to bend towards the western side of the active region. The leading edge of the flux rope moved up to the western part of the AR (see the panel at 18:26 UT on Figure 3). This snapshot shows the multiple twisted flux tubes in the flux rope structure.
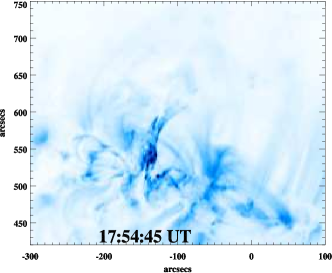
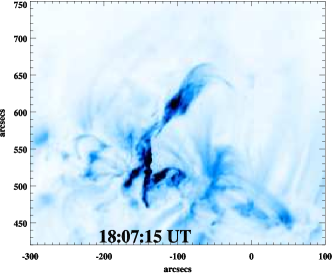
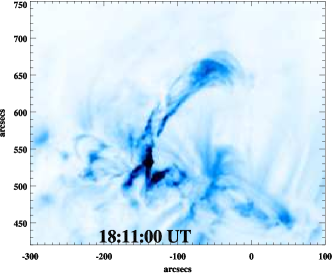
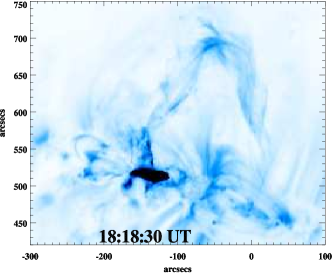
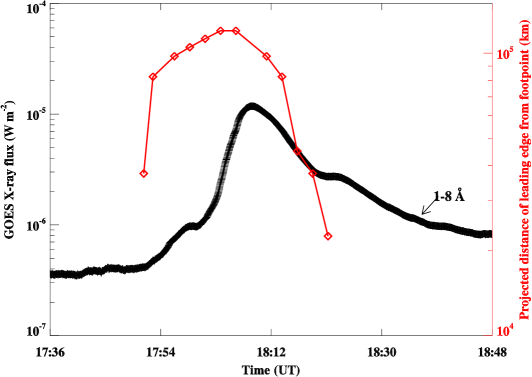
Figure \irefht (red curve) shows the projected distance vs. time profile of the leading edge of the flux rope derived from the STEREO A/SECCHI 304 Å image sequence. This is the lower bound to the estimated height, and the actual height may be much larger. This figure reveals that the rising motion of the flux rope shows good correlation with the soft X-ray flux enhancement. This may be the most likely signature of a magnetic reconnection between the flux rope and the surrounding lower loop-system. The reconnection process seems to progress with the rising motion of the flux rope and resulted in the slow rise in soft X-ray flux. The flux rope reached the maximum height of 1.2105 km and then its leading edge slowly moved down towards the active region as a hook shaped structure, which was connected to the western side of the AR. From the linear fit to the positions of the leading edge of the rising and bending flux rope, its ascending speed was estimated as 90 km s-1, while the bending speed was 115 km s-1. These are the lower-bound projected speeds derived from the linear fit of the motion of the leading edge of the flux rope plasma in the EUV image sequence. Both these lower bound speeds show a slower evolution followed by suppression of the flux rope during the total span of the flare activity.
Figure \irefsecchi_171 depicts the NOAA AR 11045 observed by SECCHI EUV in the 171 Å wavelength, which corresponds to the plasma temperature of 1.3 MK. In these data the same rising flux rope structure in coronal temperature can be clearly identified. Analysis of the data shows the magnetic topology of the active region connecting smaller and higher loop-systems. The small post-flare loop system near to the flare and flux rope activation site can be seen during the decay phase of the flare (refer to snapshots at 18:18 UT). These post-flare loop systems were formed after the flaring activity at the flux tube activation site near the polarity inversion line (PIL). The chromospheric BBSO H and STEREO/SECCHI He ii (304 Å) image sequences reveal the low-atmospheric scenario of the flux rope dynamics at its activation site near the PIL, its encounter with the remnant filament and subsequent suppression in the rising motion, and the brightening of flare ribbons as a signature of particle acceleration from the reconnection site. On the other hand, the STEREO/SECCHI 171 Å TRACE and XRT observations provide the clues of the rising flux rope in the coronal field and its reconnection with nearly closed loop systems that released the stored flare energy.
2.2 TRACE and Hinode/XRT Observations
TRACE (Transition Region and Coronal Explorer) provides the opportunity to observe the Sun from the chromosphere to the corona Handy et al. (1999). We have analysed TRACE 195 Å (Fe xii, T1.5 MK) and 1600 Å (4000-10000 K) time sequences. The field of view for each image is 10241024 with 0.5′′ pixel-1 resolution. The typical cadence for TRACE images is 20-60 s.
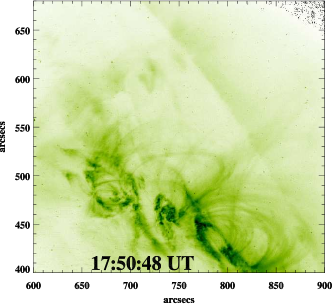
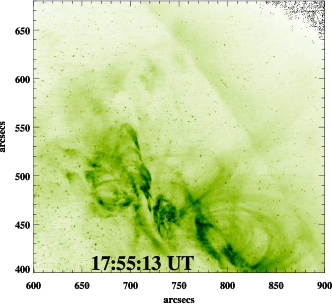
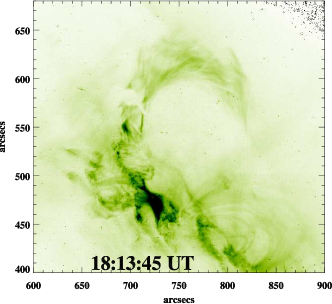
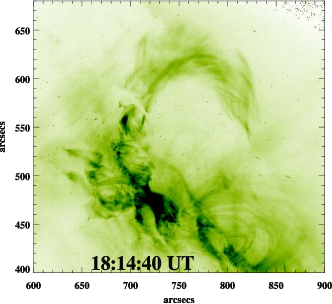
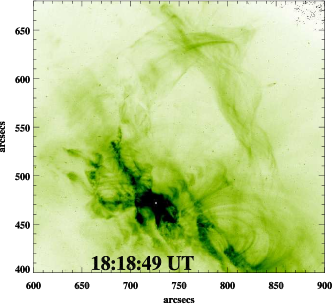
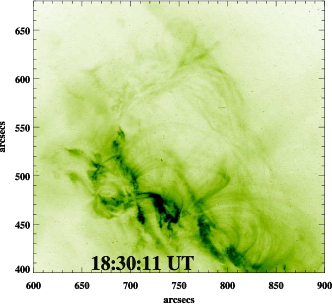
Figure \ireftr_195 displays selected TRACE 195 Å negative images during the flare activity. The TRACE data have been calibrated and analysed using standard IDL routines in the SolarSoft package. The top-left panel is best interpreted as the potential-field configuration of the active region, with field lines connecting in the form of higher and smaller loop systems. The snapshot at 17:55 UT shows the rising flux rope lying below the eastern small loop-system as indicated by an arrow. The flare was produced near one of the footpoints of the rising flux rope. The thickness of the flux rope in the corona is 40 Mm. The remnant filament can also be seen in these images (e.g., at 18:14:40 UT, indicated by the arrow and circle). This filament lay over the rising flux rope. The flux rope showed the twist structure with dips at 18:18:49 UT in the corona. A supplementary TRACE movie shows the suppression of motion in the flux rope, which was possibly associated with the overlying higher loop system in the active region. Then, the plasma filled in the flux rope moved towards the negative polarity where its another footpoint was anchored. The TRACE high resolution observations reveal fine structures of the rising flux tube (e.g., the bunch of thin flux tubes showing a kink structure as well as some of nearby loop systems), which were not visible in STEREO SECCHI 171 Å observations. It is only clear from analysing the TRACE images that the rest part of the rope has been repelled and suppressed by the overlying coronal field.
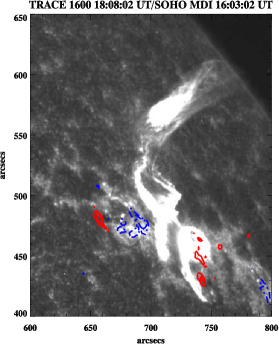
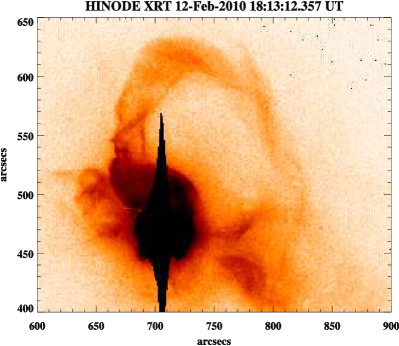
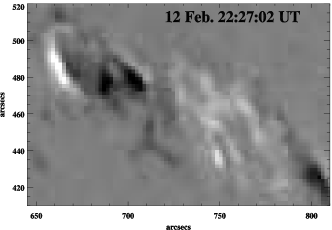
The left panel of Figure \irefxrt_tr1600 shows TRACE 1600 Å chromospheric data overlaid by SOHO/MDI magnetogram contours (red and blue show positive and negative polarity regions, respectively). The rising bright flux rope is highlighted by an arrow nearby the negative polarity spot. Two ribbons (indicated by R1 and R2) were formed as the flux rope moved along the PIL. TRACE 1600 Å high resolution observations reveal the two ribbon flare and the activation site of the flux rope near to it. This enables us to understand the spatial configuration of this very unique site where the flux rope activation, the M-class flare and related plasma processes took place. The right panel of Figure \irefxrt_tr1600 displays a Hinode/XRT Golub et al. (2007) image with the coronal part of the flux rope and the associated flare (indicated by arrows). The activation of magnetic twist is clearly visible in the magnetic–field-dominated soft X-ray corona. The multi-wavelength and simultaneous view of the rising flux rope indicates the multi-temperature plasma filled in it.
2.3 SOHO/MDI Magnetograms
In the above subsections we have analysed the rising flux rope from the chromosphere to corona, its suppression due to the remnant filament cavity, and its association with the M-class flare. In the present section, we use SOHO/MDI magnetograms to study the magnetic-field evolution before and during the flux rope rising/activation and its associated flare. The size of the field of view of each image is 10241024 (2′′ pixel resolution) with a cadence of 96 min Scherrer et al. (1995). We use the standard SolarSoft library to correct for the differential rotation and analyse the magnetograms.
Figure \irefmdi displays the sequence of MDI images on 11 and 12 February 2010. The MDI time-sequence reveals some very interesting features of the flux emergence. The top-right image clearly shows the emergence of two opposite polarities (indicated inside the circles) on 12 February 2010. This newly emerged flux grew continuously later on. Next, a considerable change in the emerging polarities (indicated by arrow) is demonstrated. The negative polarity showed motion in the south-west direction, whereas the positive polarity migrated in the north-east direction. The flux rope structure rose in the western part of the growing negative polarity region. The flux rope was activated and moved up in the eastern side of a widely spread positive polarity magnetic flux concentrations near the PIL. The motion of the negative polarity towards the flare and flux rope activation site is also observed in the MDI time sequence.

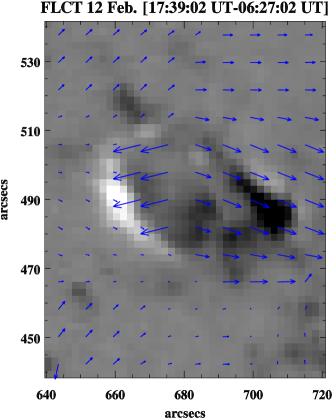
To confirm this motion that is very crucial to understand flare energy build-up, we measure the photospheric horizontal flow pattern in and around the emerging bipole in the active region. We use the Fourier Local Correlation Tracking Technique (FLCT) on SOHO/MDI data sequences for this purpose Welsch et al. (2007); Fisher and Welsch (2008). The main input parameters for this technique are two images, f1 and f2, the pixel separation (s), time separation (t), and a Gaussian window size (). This routine calculates the (two dimensional) velocity by maximizing the cross-correlation between the two images when weighted by a Gaussian window centered on each pixel location. In our study, we use the two SOHO/MDI frames at different times before the flare. After a careful investigation, a Gaussian window with was chosen. Figure \irefflct displays the photospheric velocity map obtained by the FLCT technique using SOHO/MDI magnetograms. The longest arrow corresponds to a velocity of 0.335 km s-1. It may be noted that the map shows the opposite flows in the emerging bipole. The negative polarity moved in the south-west direction where the flux rope activation and flare occurred, whereas the positive polarity move oppositely in the eastward direction. This motion may develop twist in the emerging bipole and store the magnetic energy for the event. As we have seen, the energy was finally released due to the flux rope activation and its reconnection with the pre-existing magnetic field.
3 Magnetic Configuration and Scenario of the Event
In Section 2, we described the multi-wavelength and magnetic field observations of the rising twisted flux rope and the associated M-class flare. In the present section, we elaborate the magnetic field configuration of the flaring region and related processes in the light of the multi-wavelength observational scenario.
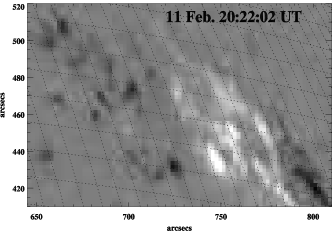
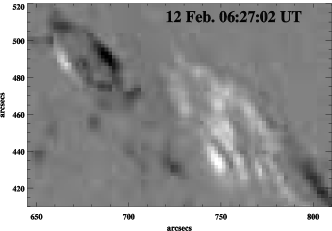
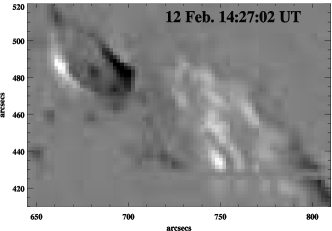
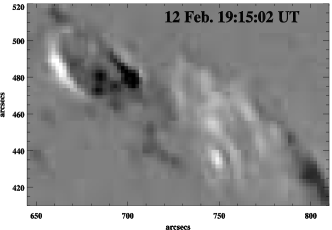
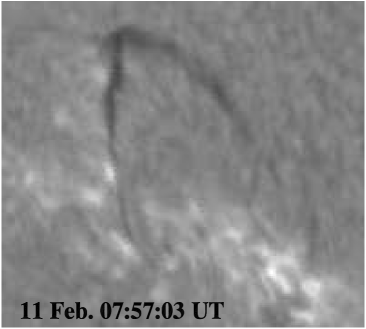
A semi-circular filament was observed on the northern border of the active region NOAA 11045 couple of days before the event (Figure \irefha). It had been located at the same place where the twisted EUV structure and the bright H arch were observed on 12 February 2010, and the shape was also the same. On the previous days the eastern side of the filament was clearly related to a positive polarity sunspot. Some connectivity is still visible in Figure \irefha, particularly on 11 February 2010. Comparison with the BBSO filtergrams on 12 February, before the event, shows that only the eastern part of the filament existed on 11 February 2010. However, propagation of brightening along a trajectory that coincided with the shape of the whole semi-circular filament suggests that the magnetic structure remained nearly the same during these two days despite the absence of visible plasma in the western part of the structure.
We may assume that a twisted magnetic flux rope existed in the northern area of the active region NOAA 11045 (see a cartoon outlined in Figure \irefcartoon). One end of the flux rope was rooted near the positive polarity sunspot, while the other end was rooted in the area of negative polarity westward of the area of positive polarity. The flux rope was aligned along the polarity inversion line and surrounding the positive polarity on the north. On 11 February, the whole length of the flux rope became filled with cold and dense plasma, which constituted the filament. On the next day, only the eastern part of the flux rope was filled with plasma and it looked as if a separate strand of the flux rope (marked as FR2 in Figure \irefcartoon) was rooted at some place to the north of the polarity inversion line near the middle of the flux rope.
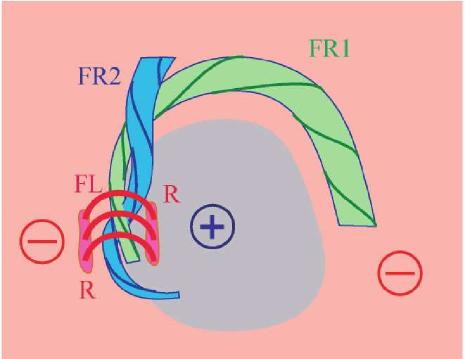
At 17:44 UT on 12 February, activation of the flux rope started near its eastern end, which manifested itself by motion and heating of the filament material. There is no clear evidence of rising motion of the whole body of this filament segment. Plasma heated to different temperatures spread along the field lines of the flux rope. The multi-temperature nature of the event allows one to see the process in different wavelengths from H to soft X-rays. The activation affected only those strands of the flux rope (marked as FR1 in the Figure \irefcartoon) that were connected to the area of negative polarity to the west of the positive polarity. Thus, we can assume that the two bunches of strand were individual flux ropes, FR1 and FR2, braided together. The northern section of FR2 passed over the FR1 and stayed undisturbed during the propagation of brightening along the FR1 below it. The plasma in FR2 plasma was seen as a dark filament in H and as a dark loop-like feature crossing bright FR1 threads in EUV images. Since the northern end of FR2 was rooted close to the place of crossing of the two ropes, possibly, this anchoring have prevented FR1 from rising up and erupting. At a late phase of the event, FR2 became also activated. It was slightly shifted up and became heated. This is the reason why this arch disappeared in H and EUV images in the middle of the event but appeared again after its ending.
The bright twisted threads in FR1, after coming out from under FR2, expanded into a wide structure that at first increases its height but then decended. Plasma flowed along helical flux tubes to the western end of the flux rope, while the flux tubes themselves showed complex untwisting and writhing motion.
After 18:00 UT, two short flare ribbons began to progress near the site of the initial filament activation. Soon bright flare loops, connecting the ribbons, appeared above the filament. This is not typical for two-ribbon solar flares. Usually flare loops appear below erupting filaments. However, there are other examples of such a behavior. For example, flare loops were seen above the stable part of an eruptive filament in the complex event on 20 September 1998 (see TRACE 171 Å movie 21 at the TRACE site http://trace.lmsal.com/POD/). The flux rope images of STEREO A/SECCHI in 171 Å and 304 Å (cf., last snapshots of Figures 3 and 5) validate the schematic diagram and magnetic field environment.
The process of the initial filament activation is of smaller spatial scale and its mechanism is yet unclear to us. However, we suggest that rapid changes in the magnetic field close to this place are the main factor that influences the initiation of the filament activation and the flare. Rapid emergence of new magnetic flux and fast motion of the negative polarity in the direction to the opposite polarity towards PIL squeezed significantly the flux rope and must have lead to some instability and energy release.
The event might be called a failed filament eruption but the absence of filament material in the significant portion of the flux rope before the activation makes this appellation ambiguous. It is better to refer to this event as a failed flux rope eruption. The ambient magnetic field may have been strong enough to prevent the flux rope from erupting. The flux rope was presumably in a stable equilibrium. The disturbance have led only to oscillations near the equilibrium position as well as untwisting and writhing motion.
4 Discussion and Conclusions
In the present paper, we showed a rare multi-wavelength observation of a rising twisted flux rope on 12 February 2010 from NOAA AR 11045. The flux rope was activated in the vicinity of a remnant filament structure and moved up in the corona as visible in H, EUV and soft X-ray observations. An M-class flare was triggered as the leading edge of the brightening moved away from the active region with a (projected) speed of 90 km s-1. A two-ribbon flare progressed well with the ascent of the flux rope. Most likely, the lower part of the flux rope structure reconnected with the surrounding low-lying loop system causing the flare. The flux rope reached to the maximum height and then it was suppressed by the overlying fields as the bending of the rope was observed in TRACE EUV observations. An analysis of associated MDI magnetograms show the emergence of a dipole 12 h prior to the flare and flux rope activation. The continuous growth and motion of two spots in the opposite direction (particularly the negative polarity spot), helped in building the magnetic energy necessary to initiate a flare in the vicinity of the negative spot, where the flux rope activation took place. The structure moved up near the polarity inversion line and its end was anchored to the negative polarity field region resulting failed eruption.
Using SOT (Solar Optical Telescope) onboard Hinode, vector magnetic field observations of NOAA AR 10953, \inlineciteokamoto2008 found the signature of an emerging helical flux rope beneath an active region prominence. They have found that a helical flux rope was emerging from below the photosphere into the corona along the PIL under the pre-existing prominence, and, suggested that the emergence of the helical magnetic flux rope was associated with the evolution and maintenance of the prominence as after the emergence of the flux rope prominence became more stable. In our case, we do not see any evidence of positive flux emergence near the flare and flux rope activation site. However, we have found such signature on the eastern side of PIL. Instead, a unique situation was created in the form of the activation of twisted flux rope that was going below the remnant filament channel and being failed finally. Further, the overlying filament had not changed much during the rise of the flux rope. The reconnection of this rope with the surrounding field probably led to the flare energy release at the activation site. The rise of the helical flux rope that underwent reconnection with lower coronal fields, had possibly carried material into the corona and remnant filament cavity as recently observed Okamoto et al. (2009); Okamoto, Tsuneta, and Berger (2010). The rising motion of the flux rope (90 km s-1) was possibly related to the outflow driven by the magnetic reconnection between the flux rope and the pre-existing coronal field in AR 11045 at the flare site.
In conclusion, we have presented here the first multi-wavelength observation of the unique event of a failed flux rope most likely due to the remnant filament in the beginning and then by an overlying coronal magnetic field. This interesting dynamics in the vicinity of rapidly emerging bipolar region and motion of its negative polarity towards the flux tube activation site may have provided the initial conditions for the flare energy build-up, and then its release due to the reconnection of the rising flux tube with the pre-existing field lines at the flare site. Further and more elaborative multi-wavelength campaign should be carried out using the latest space (e.g., Hinode, STEREO, SDO Graham et al. (2003); Lemen et al. (2011)) and ground-based (e.g., SST, ROSA Scharmer et al. (2003); Jess et al. (2010)) observatories to shed more light on such unique energy build up and release processes of solar flares associated with rapidly emerging active regions.
Acknowledgements
We thank the reviewer for his/her suggestions for our present research work. We acknowledge space missions, GOES, SOHO/MDI, Hinode/XRT, TRACE and STEREO for providing the data used in this study. SOHO is a project of international cooperation between ESA and NASA. Hinode is a Japanese mission developed and launched by ISAS/JAXA, collaborating with NAOJ as a domestic partner, NASA and STFC (UK) as international partners. We are thankful to BBSO and Catania Astrophysical Observatory for providing the H data used in this study. Global High Resolution H Network is operated by the Space Weather Research Lab, New Jersey Institute of Technology. This work was supported by the Department of Science and Technology, Ministry of Science and Technology of India, by the Russian foundation for Basic Research (grants 09-02-00080 and 09-02-92626, INT/RFBR/P-38). RE acknowledges M. Keráy for patient encouragement and is also grateful to NSF, Hungary (OTKA, Ref. No. 483133) for financial support received. AKS thanks SP2RC, School of Mathematics and Statistics, The Univesity of Sheffield, U.K. for the support of collaborative visits, where the part of present research work has been carried out.
References
- Alexander, Liu, and Gilbert (2006) Alexander, D., Liu, R., Gilbert, H.R.: 2006, Hard X-Ray production in a failed filament eruption. ApJ 653, 719 – 724. doi:10.1086/508137.
- Amari et al. (2000) Amari, T., Luciani, J.F., Mikic, Z., Linker, J.: 2000, A twisted flux rope model for coronal mass ejections and two-ribbon flares. Astrophys. J. Lett. 529, 49 – 52. doi:10.1086/312444.
- Archontis, Hood, and Brady (2007) Archontis, V., Hood, A.W., Brady, C.: 2007, Emergence and interaction of twisted flux tubes in the Sun. A&A 466, 367 – 376. doi:10.1051/0004-6361:20066508.
- Archontis et al. (2004) Archontis, V., Moreno-Insertis, F., Galsgaard, K., Hood, A., O’Shea, E.: 2004, Emergence of magnetic flux from the convection zone into the corona. A&A 426, 1047 – 1063. doi:10.1051/0004-6361:20035934.
- Archontis et al. (2005) Archontis, V., Moreno-Insertis, F., Galsgaard, K., Hood, A.W.: 2005, The three-dimensional interaction between emerging magnetic flux and a large-scale coronal field: reconnection, current Sheets, and jets. ApJ 635, 1299 – 1318. doi:10.1086/497533.
- Aschwanden (2004) Aschwanden, M.J.: 2004, Physics of the Solar Corona. An Introduction, Praxis Publishing Ltd, Springer, Berlin.
- Bonet et al. (2008) Bonet, J.A., Márquez, I., Sánchez Almeida, J., Cabello, I., Domingo, V.: 2008, Convectively driven vortex flows in the Sun. Astrophys. J. Lett. 687, 131 – 134. doi:10.1086/593329.
- Fan (2001) Fan, Y.: 2001, The emergence of a twisted -tube into the solar atmosphere. Astrophys. J. Lett. 554, 111 – 114. doi:10.1086/320935.
- Fan and Gibson (2003) Fan, Y., Gibson, S.E.: 2003, The emergence of a twisted magnetic flux tube into a preexisting coronal arcade. Astrophys. J. Lett. 589, 105 – 108. doi:10.1086/375834.
- Fan and Gibson (2004) Fan, Y., Gibson, S.E.: 2004, Numerical simulations of three-dimensional coronal magnetic fields resulting from the emergence of twisted magnetic flux tubes. ApJ 609, 1123 – 1133. doi:10.1086/421238.
- Fedun et al. (2011) Fedun, V., Shelyag, S., Verth, G., Mathioudakis, M., Erdélyi, R.: 2011, Brief anatomy of MHD waves generated by high-frequency photospheric swirly motions. Annales Geophysicae, submitted.
- Filippov and Den (2001) Filippov, B.P., Den, O.G.: 2001, A critical height of quiescent prominences before eruption. J. Geophys. Res. 106, 25177 – 25184. doi:10.1029/2000JA004002.
- Fisher and Welsch (2008) Fisher, G.H., Welsch, B.T.: 2008, FLCT: A fast, efficient method for performing local correlation tracking. In: R. Howe, R. W. Komm, K. S. Balasubramaniam, & G. J. D. Petrie (ed.) Subsurface and Atmospheric Influences on Solar Activity, Astronomical Society of the Pacific Conference Series 383, 373 – 380.
- Golub et al. (2007) Golub, L., Deluca, E., Austin, G., Bookbinder, J., Caldwell, D., Cheimets, P., Cirtain, J., Cosmo, M., Reid, P., Sette, A., Weber, M., Sakao, T., Kano, R., Shibasaki, K., Hara, H., Tsuneta, S., Kumagai, K., Tamura, T., Shimojo, M., McCracken, J., Carpenter, J., Haight, H., Siler, R., Wright, E., Tucker, J., Rutledge, H., Barbera, M., Peres, G., Varisco, S.: 2007, The X-Ray telescope (XRT) for the Hinode mission. Sol. Phys. 243, 63 – 86. doi:10.1007/s11207-007-0182-1.
- Graham et al. (2003) Graham, J.D., Norton, A., López Ariste, A., Lites, B., Socas-Navarro, H., Tomczyk, S.: 2003, The Helioseismic and Magnetic Imager (HMI) on SDO: Full vector magnetography with a filtergraph polarimeter. In: J. Trujillo-Bueno & J. Sanchez Almeida (ed.) Astronomical Society of the Pacific Conference Series, Astronomical Society of the Pacific Conference Series 307, 131 – 136.
- Handy et al. (1999) Handy, B.N., Acton, L.W., Kankelborg, C.C., Wolfson, C.J., Akin, D.J., Bruner, M.E., Caravalho, R., Catura, R.C., Chevalier, R., Duncan, D.W., Edwards, C.G., Feinstein, C.N., Freeland, S.L., Friedlaender, F.M., Hoffmann, C.H., Hurlburt, N.E., Jurcevich, B.K., Katz, N.L., Kelly, G.A., Lemen, J.R., Levay, M., Lindgren, R.W., Mathur, D.P., Meyer, S.B., Morrison, S.J., Morrison, M.D., Nightingale, R.W., Pope, T.P., Rehse, R.A., Schrijver, C.J., Shine, R.A., Shing, L., Strong, K.T., Tarbell, T.D., Title, A.M., Torgerson, D.D., Golub, L., Bookbinder, J.A., Caldwell, D., Cheimets, P.N., Davis, W.N., Deluca, E.E., McMullen, R.A., Warren, H.P., Amato, D., Fisher, R., Maldonado, H., Parkinson, C.: 1999, The transition region and coronal explorer. Sol. Phys. 187, 229 – 260. doi:10.1023/A:1005166902804.
- Heyvaerts, Priest, and Rust (1977) Heyvaerts, J., Priest, E.R., Rust, D.M.: 1977, An emerging flux model for the solar flare phenomenon. ApJ 216, 123 – 137. doi:10.1086/155453.
- Jess et al. (2010) Jess, D.B., Mathioudakis, M., Christian, D.J., Keenan, F.P., Ryans, R.S.I., Crockett, P.J.: 2010, ROSA: A high-cadence, synchronized multi-camera solar imaging system. Sol. Phys. 261, 363 – 373. doi:10.1007/s11207-009-9500-0.
- Ji et al. (2003) Ji, H., Wang, H., Schmahl, E.J., Moon, Y., Jiang, Y.: 2003, Observations of the failed eruption of a filament. Astrophys. J. Lett. 595, 135 – 138. doi:10.1086/378178.
- Karpen and Boris (1986) Karpen, J.T., Boris, J.P.: 1986, Response of an emerging flux tube to a current-driven instability. ApJ 307, 826 – 837. doi:10.1086/164469.
- Kumar, Manoharan, and Uddin (2010a) Kumar, P., Manoharan, P.K., Uddin, W.: 2010a, Evolution of solar magnetic field and associated multiwavelength phenomena: flare events on 2003 November 20. ApJ 710, 1195 – 1204. doi:10.1088/0004-637X/710/2/1195.
- Kumar et al. (2010b) Kumar, P., Srivastava, A.K., Somov, B.V., Manoharan, P.K., Erdélyi, R., Uddin, W.: 2010b, Evidence of solar flare triggering due to loop-loop interaction caused by footpoint shear motion. ApJ 723, 1651 – 1664. doi:10.1088/0004-637X/723/2/1651.
- Kumar et al. (2010c) Kumar, P., Srivastava, A.K., Filippov, B., Uddin, W.: 2010c, Multiwavelength Study of the M8.9/3B Solar Flare from AR NOAA 10960. Sol. Phys. 266, 39 – 58. doi:10.1007/s11207-010-9586-4.
- Lemen et al. (2011) Lemen, J.R., Title, A.M., Akin, D.J., Boerner, P.F., Chou, C., Drake, J.F., Duncan, D.W., Edwards, C.G., Friedlaender, F.M., Heyman, G.F., Hurlburt, N.E., Katz, N.L., Kushner, G.D., Levay, M., Lindgren, R.W., Mathur, D.P., McFeaters, E.L., Mitchell, S., Rehse, R.A., Schrijver, C.J., Springer, L.A., Stern, R.A., Tarbell, T.D., Wuelser, J.P., Wolfson, C.J., Yanari, C., Bookbinder, J.A., Cheimets, P.N., Caldwell, D., Deluca, E.E., Gates, R., Golub, L., Park, S., Podgorski, W.A., Bush, R.I., Scherrer, P.H., Gummin, M.A., Smith, P., Auker, G., Jerram, P., Pool, P., Soufli, R., Windt, D.L., Beardsley, S., Clapp, M., Lang, J., Waltham, N.: 2011, The Atmospheric Imaging Assembly (AIA) on the Solar Dynamics Observatory (SDO). Sol. Phys., in press. doi:10.1007/s11207-011-9776-8.
- Liu et al. (2009) Liu, Y., Su, J., Xu, Z., Lin, H., Shibata, K., Kurokawa, H.: 2009, New Observation of failed filament eruptions: The influence of asymmetric coronal background fields on solar eruptions. Astrophys. J. Lett. 696, 70 – 73. doi:10.1088/0004-637X/696/1/L70.
- Martin et al. (1984) Martin, S.F., Bentley, R.D., Schadee, A., Antalova, A., Kucera, A., Dezso, L., Gesztelyi, L., Harvey, K.L., Jones, H., Livi, S.H.B.: 1984, Relationships of a growing magnetic flux region to flares. Adv. Space Res. 4, 61 – 70. doi:10.1016/0273-1177(84)90161-3.
- Okamoto, Tsuneta, and Berger (2010) Okamoto, T.J., Tsuneta, S., Berger, T.E.: 2010, A rising cool column as a signature of helical flux emergence and formation of prominence and coronal cavity. ApJ 719, 583 – 590. doi:10.1088/0004-637X/719/1/583.
- Okamoto et al. (2008) Okamoto, T.J., Tsuneta, S., Lites, B.W., Kubo, M., Yokoyama, T., Berger, T.E., Ichimoto, K., Katsukawa, Y., Nagata, S., Shibata, K., Shimizu, T., Shine, R.A., Suematsu, Y., Tarbell, T.D., Title, A.M.: 2008, Emergence of a helical flux rope under an active region prominence. Astrophys. J. Lett. 673, 215 – 218. doi:10.1086/528792.
- Okamoto et al. (2009) Okamoto, T.J., Tsuneta, S., Lites, B.W., Kubo, M., Yokoyama, T., Berger, T.E., Ichimoto, K., Katsukawa, Y., Nagata, S., Shibata, K., Shimizu, T., Shine, R.A., Suematsu, Y., Tarbell, T.D., Title, A.M.: 2009, Prominence formation associated with an emerging helical flux rope. ApJ 697, 913 – 922. doi:10.1088/0004-637X/697/1/913.
- Roussev et al. (2001a) Roussev, I., Galsgaard, K., Erdélyi, R., Doyle, J.G.: 2001a, Modelling of explosive events in the solar transition region in a 2D environment. I. General reconnection jet dynamics. A&A 370, 298 – 310. doi:10.1051/0004-6361:20010207.
- Roussev et al. (2001b) Roussev, I., Galsgaard, K., Erdélyi, R., Doyle, J.G.: 2001b, Modelling of explosive events in the solar transition region in a 2D environment. II. Various MHD experiments. A&A 375, 228 – 242. doi:10.1051/0004-6361:20010765.
- Roussev et al. (2001c) Roussev, I., Doyle, J.G., Galsgaard, K., Erdélyi, R.: 2001c, Modelling of solar explosive events in 2D environments. III. Observable consequences. A&A 380, 719 – 726. doi:10.1051/0004-6361:20011497.
- Scharmer et al. (2003) Scharmer, G.B., Bjelksjo, K., Korhonen, T.K., Lindberg, B., Petterson, B.: 2003, The 1-meter Swedish solar telescope. In: S. L. Keil & S. V. Avakyan (ed.) Society of Photo-Optical Instrumentation Engineers (SPIE) Conference Series, Society of Photo-Optical Instrumentation Engineers (SPIE) Conference Series 4853, 341 – 350. doi:10.1117/12.460377.
- Scherrer et al. (1995) Scherrer, P.H., Bogart, R.S., Bush, R.I., Hoeksema, J.T., Kosovichev, A.G., Schou, J., Rosenberg, W., Springer, L., Tarbell, T.D., Title, A., Wolfson, C.J., Zayer, I., MDI Engineering Team: 1995, The Solar oscillations investigation - Michelson doppler imager. Sol. Phys. 162, 129 – 188. doi:10.1007/BF00733429.
- Schrijver and Title (1999) Schrijver, C.J., Title, A.M.: 1999, Active regions losing their moorings by subsurface reconnection. Sol. Phys. 188, 331 – 344. doi:10.1023/A:1005281526160.
- Shelyag et al. (2011) Shelyag, S., Fedun, V., Keenan, F.P., Erdélyi, R., Mathioudakis, M.: 2011, Photospheric magnetic vortex structures. Annales Geophysicae 29, 883 – 887. doi:10.5194/angeo-29-883-2011.
- Shelyag et al. (2011) Shelyag, S., Keys, P., Mathioudakis, M., Keenan, F.P.: 2011, Vorticity in the solar photosphere. A&A 526, A5. doi:10.1051/0004-6361/201015645.
- Shen, Liu, and Liu (2011) Shen, Y.D., Liu, Y., Liu, R.: 2011, A time series of filament eruptions observed by three eyes from space: from failed to successful eruptions. Res. Astron. Astrophys. 11, 594 – 606. doi:10.1088/1674-4527/11/5/009.
- Shibata et al. (1990) Shibata, K., Nozawa, S., Matsumoto, R., Sterling, A.C., Tajima, T.: 1990, Emergence of solar magnetic flux from the convection zone into the photosphere and chromosphere. Astrophys. J. Lett. 351, 25 – 28. doi:10.1086/185671.
- Simon and Weiss (1997) Simon, G.W., Weiss, N.O.: 1997, Kinematic modeling of vortices in the solar photosphere. ApJ 489, 960. doi:10.1086/304800.
- Srivastava et al. (2010) Srivastava, A.K., Zaqarashvili, T.V., Kumar, P., Khodachenko, M.L.: 2010, Observation of kink instability during small B5.0 solar flare on 2007 June 4. ApJ 715, 292 – 299. doi:10.1088/0004-637X/715/1/292.
- Török and Kliem (2003) Török, T., Kliem, B.: 2003, The evolution of twisting coronal magnetic flux tubes. A&A 406, 1043 – 1059. doi:10.1051/0004-6361:20030692.
- Török and Kliem (2005) Török, T., Kliem, B.: 2005, Confined and ejective eruptions of kink-unstable flux ropes. Astrophys. J. Lett. 630, 97 – 100. doi:10.1086/462412.
- Wedemeyer-Böhm and Rouppe van der Voort (2009) Wedemeyer-Böhm, S., Rouppe van der Voort, L.: 2009, Small-scale swirl events in the quiet Sun chromosphere. Astron. Astrophys. Lett. 507, 9 – 12. doi:10.1051/0004-6361/200913380.
- Welsch et al. (2007) Welsch, B.T., Abbett, W.P., De Rosa, M.L., Fisher, G.H., Georgoulis, M.K., Kusano, K., Longcope, D.W., Ravindra, B., Schuck, P.W.: 2007, Tests and comparisons of velocity-inversion techniques. ApJ 670, 1434 – 1452. doi:10.1086/522422.
- Xu et al. (2010) Xu, Y., Liu, R., Jing, J., Wang, H.: 2010, Partial eruption and shrinkage of filaments during solar flares in new solar cycle. In: American Astronomical Society Meeting Abstracts #216, Bull. Am. Astron. Soc. 41, 901.