Star formation in the extended gaseous disk of the isolated galaxy CIG 96
Abstract
We study the Kennicutt-Schmidt star formation law and efficiency in the gaseous disk of the isolated galaxy CIG 96 (NGC 864; Tully 1988), with special emphasis on its unusually large atomic gas (H I) disk (rHI/r25 = 3.5, r25 = 185). We present deep GALEX near and far ultraviolet observations, used as a recent star formation tracer, and we compare them with new, high resolution (16″, or 1.6 kpc) VLA H I observations. The UV and H I maps show good spatial correlation outside the inner 1′, where the H I phase dominates over H2. Star-forming regions in the extended gaseous disk are mainly located along the enhanced H I emission within two (relatively) symmetric giant gaseous spiral arm-like features, which emulate a H I pseudo-ring at a 3′. Inside such structure, two smaller gaseous spiral arms extend from the NE and SW of the optical disk and connect to the previously mentioned H I pseudo-ring. Interestingly, we find that the (atomic) Kennicutt-Schmidt power law index systematically decreases with radius, from N 3.0 0.3 in the inner disk (08 – 17) to N = 1.6 0.5 in the outskirts of the gaseous disk (33 – 42). Although the star formation efficiency (SFE), the star formation rate per unit of gas, decreases with radius where the H I component dominates as is common in galaxies, we find that there is a break of the correlation at 1.5 . At radii 1.5 3.5 , mostly within the H I pseudo-ring structure, there exist regions whose SFE remains nearly constant, SFE 10-11 yr-1. We discuss about possible mechanisms that might be triggering the star formation in the outskirts of this galaxy, and we suggest that the constant SFE for such large radii 2 and at such low surface densities might be a common characteristic in extended UV disk galaxies.
Subject headings:
galaxies: spirals — galaxies: individual (NGC 864) — galaxies: structure — galaxies: ISM – stars: formation1. Introduction
For three decades it has been known that about one third of galaxies show unusually extended atomic gas (H I) distributions (e.g., Bosma, 1981; Huchtmeier & Richter, 1982). It was not until recently, with the advent of the Galaxy Evolution Explorer (GALEX) (Martin et al., 2005), that we could observe easily star formation (SF) far beyond the optical radius of galaxies (Thilker et al., 2005, 2007, 2009; Gil de Paz et al., 2005, 2007; Boissier et al., 2007). The star-forming regions generally show a good spatial correlation with the H I component (the main phase of neutral gas at large radii) in such extended H I disks (e.g. Bigiel et al., 2010a).
These extended Ultraviolet (XUV) disks are characterized by very blue UV-optical colors, they can reach up to four times the optical radius (as given by the =25 mag/arcsec2 major axis isophote), and are mainly composed of low mass stellar clusters of 103 – 106 M⊙. Recent studies have shown the presence of moderate amounts of dust and oxygen abundances of Z⊙/10 (Gil de Paz et al., 2007; Dong et al., 2008; Bresolin et al., 2009). Thilker et al. (2007) recently classified the XUV disks into Type 1 (patchy UV emission beyond the canonical SF threshold; Toomre 1964; Martin & Kennicutt 2001) and Type 2 (blue, large compared with the size of the galaxy in the near-infrared disks inside the SF threshold) and found XUV disks to be relatively frequent, 20% and 10% of the overall disk-galaxy population, for respectively Types 1 and 2.
Comparing UV and H I in such extended disks allows the study of the Kennicutt-Schmidt (KS) law, or star formation rate (SFR) versus gas surface densities vs (Schmidt, 1959; Kennicutt, 1998), in the extreme low-density and often low-metallicity environments of the outskirts of galaxy disks, which can elucidate the limiting conditions for gas cloud and star formation (Toomre, 1964; Martin & Kennicutt, 2001). In addition, it is essential to study the relation between the availability of H I in the outer disk and the depletion time scales due to SF. Such an H I reservoir should play a role in the replenishment of the molecular gas content to enable future SF. This process can thus contribute to sustain SF over cosmological times (e.g. Kennicutt et al., 1994; Bauermeister et al., 2010).
Another key question to be addressed is what are the mechanisms for triggering SF in these low-density gaseous environments. Several mechanisms have been proposed, both of external and internal origin, including gravitational instabilities induced by galaxy interactions (e.g. Gil de Paz et al. 2005) or the impact of dark matter subhalos or extragalactic clouds (Tenorio-Tagle, 1981; Bekki & Chiba, 2006), turbulence compression, supernovae, or gaseous spiral arms (Elmegreen & Hunter, 2006). In this regard, Thilker et al. (2007) found that 75% of the Type-1 XUV-disk objects show some kind of optical morphology peculiarity or H I evidence for interaction/merger or a minor external perturbation, such as primordial clouds (Thilker et al., 2009). For instance, NGC 4262, a member of the Virgo cluster, exhibits an extended H I and UV ring-like feature probably formed as a result of a past major interaction episode (bettoni10).
Thilker et al. (2007) noted that isolated galaxies might also host a Type-1 XUV-disk. Although studying such isolated systems can provide provide information about other mechanisms producing extended disks, still no detailed study has been performed so far. An excellent target sample is the Catalog of Isolated Galaxies (CIG, Karachentseva, 1973). The isolation of the galaxies in the catalog has been revised within the AMIGA project (Analysis of the interstellar Medium of Isolated GAlaxies, http://amiga.iaa.es, Verdes-Montenegro et al. 2005; Verley et al. 2007a, b). The imposed isolation criterion assures that the galaxies have not suffered any major interactions in a time scale of the order of 3 Gyr (Verdes-Montenegro et al., 2005). We searched the GALEX Nearby Galaxy Survey (NGS, Gil de Paz et al. 2007), Deep (DIS), Medium (MIS), and All Sky Surveys (AIS) for galaxies in the AMIGA sample. Out of the 24 galaxies in the AMIGA sample having MIS, DIS and/or NGS data, none showed evidence of XUV emission. We found a total of 126 objects in AIS. Out of these, we identified seven XUV-disk galaxies, four of them of Type 1 (CIG 96, CIG 103, CIG 712 and CIG 812).
In this paper we examine the properties of the extended disk in the SAB(rs)c (de Vaucouleurs et al., 1991) galaxy CIG 96 (NGC 864). CIG 96 has a strong and slightly curved bar, with a bar length estimated by Fourier analysis in H-band of 26″ (Eskridge et al., 2002; Speltincx et al., 2008). It is located nearby at a distance of 17.3 Mpc ( = 1561.6 km s-1, Espada et al. 2005, using a H0=75 km s-1 Mpc-1), which yields a linear scale 1″ 100 pc. We adopted for CIG 96 the major and minor axis optical diameters D25 = 37 and d25 = 26 at the isophotal level 25 mag/arcsec2 in the B-band (homogenized value from LEDA, Paturel et al. 2003). Note that the diameters in NED (NASA/IPAC Extragalactic Database) are larger, D25 = 47 and d25 =35, as in the Uppsala General Catalogue of Galaxies (Nilson, 1973). However the homogenized diameters given by LEDA are consistent with recent values found in the literature, such as Paturel et al. (2000). We assume throughout the paper a position angle P.A. = 23° 3° and an inclination = 43° 2°, values derived from modelling of the H I data cube in Espada et al. (2005). These are also consistent to the homogenized values presented in LEDA, P.A. = 24.0° and = 46.7°.
VLA H I maps with resolutions of about 45″ revealed an unusually extended H I disk (Espada et al., 2005). Besides the optical revision of the isolation (Verley et al., 2007a), CIG 96 is also found to be isolated from any relatively H I-rich galaxy within the VLA primary beam (30′). Only a diminutive galaxy with an H I mass 5 106 M⊙ located at 80 kpc from CIG 96 is its nearest companion. No tidal tails or other signs of interaction were found to the reached sensitivity. Largest H I column densities were found within a ring feature with major and minor axis of 15 10. More interestingly, Espada et al. (2005) found a pseudo-ring feature with an approximate size of 82 46. The galaxy H I disk has a kinematic asymmetry. The rotation curves in the approaching and receding sides differ, mostly as a result of a kinematically detached clump which is evident as a secondary peak in the position velocity cut at a radii 65 to the SW (Espada et al., 2005).
The main goal of this paper is to shed light into the local KS laws and Star Formation Efficiency (SFE), the Star Formation Rate (SFR) per unit of gas, of the extended gaseous component in this isolated object, using new deep GALEX observations and high resolution ( 15″) VLA H I observations (§ 2). In § 3 we describe our H I and UV maps, compare the spatial location of UV relative to H I, and study the KS law locally for different radius ranges, as well as the local SFE as a function of radius. In § 4 we compare the observed and rotation curve with that obtained from a model fitting using optical, UV and IR photometric radial profiles. Finally we provide a discussion on the main findings and our conclusions in § 5.
2. Observations and data reduction
2.1. VLA H I Data
H I observations were carried out with the NRAO VLA111The National Radio Astronomy Observatory is a facility of the National Science Foundation operated under cooperative agreement by Associated Universities, Inc. in its C configuration on July 23 2005, and were combined to the D configuration data published by Espada et al. (2005). We used the same correlator setting as for the D configuration data, which provided a velocity resolution of 48.8 kHz (10.4 km s-1) for the 64 individual channels after Hanning smoothing. The editing and calibration of the data were done with AIPS222http://www.aips.nrao.edu/cook.html. The data were imaged using IMAGR by combining both datasets. For the cleaning process we applied a compromise between natural and uniform weighting (weighting parameter ROBUST = 0). The average of the line-free channels has been subtracted from all the individual channels.
The final rms noise level achieved after 4 (D-configuration) plus 7 hours (C-configuration) per channel is = 0.4 mJy beam-1, with a synthesized beam of 156 (or 1.7 1.6 kpc), and a position angle P.A. = -30.10°. We obtained the integrated intensity (moment 0) map from the 27 channels with H I emission, to which we applied a primary beam correction (HPBW for the VLA antennas). The moment 0 was masked using a 3 (=1.2 mJy beam-1) clipping for each single channel. The 1 noise level of the moment 0 map is Jy beam-1 km s-1, calculated as the addition in quadrature of the channel’s 1 levels.
The excellent agreement between the single-dish total flux, S = 102.96 Jy km s-1 using Green Bank 43m telescope (HPBW = 22′) (Haynes et al., 1998), and that obtained with the VLA C+D configuration data, S = 100.3 Jy km s-1, implies that we recover most of the flux. Thus an extended gas component is not expected to be missing in our maps.
2.2. GALEX NUV and FUV Data
The GALEX observatory provides both a near UV (NUV, = 1771 – 2831 Å) and a far UV (FUV, = 1344 –1786 Å) broadband filter, with angular resolutions (FWHM) of 53 and 42, respectively. The field of view of the instrument is about 1.25°, much larger than the VLA primary beam. CIG 96 was observed in NUV for 6.385 ks and FUV for 1.648 ks in our GALEX Guest Investigator program 065 in Cycle 5. We also combined these data with previous observations from the archive.
Foreground stars are prominent in the NUV images and we identified and flagged them easily via their UV colors (see Gil de Paz et al. 2007). We computed and subtracted the background from both the FUV and NUV maps. We corrected fluxes by adopting Galactic extinction as given by Schlegel et al. (1998), namely E(B-V) = 0.048.
Besides correcting for the foreground galactic extinction, we must also account for radial variations in the internal extinction. The total IR (TIR) to UV ratio, TIR/UV, is a robust tracer of internal extinction, depending weakly on the dust-to-stars geometry or the extinction law (see, e.g. Witt & Gordon, 2000; Buat et al., 2005, and references therein). In order to compute the TIR radial profiles, Spitzer images at 24, 70 and 160 would be required, but they are not available for this galaxy. Therefore, we resorted to the FUV-NUV colour (i.e., the UV slope) as an indirect tracer of dust extinction. Instead of using the classical calibrations derived for starburst galaxies (Calzetti et al., 1994; Heckman et al., 1995; Meurer et al., 1999), here we made use of the recipes of Muñoz-Mateos et al. (2009), which were calibrated on a sample of normal, nearby galaxies. From the FUV-NUV colour profile we infer the TIR/FUV and TIR/NUV ratios at each radius. These ratios are then converted into extinction radial profiles in the FUV and NUV bands independently. This was done by means of the prescriptions of Cortese et al. (2008), which take into account the varying contribution of young and old stars to the dust heating. The error in the extinction is dominated by the scatter of ratios when we calibrate TIR/FUV and TIR/NUV as a function of colour FUV-NUV, and is estimated to be of the order of 0.4 mag.
3. Results
3.1. H I Component
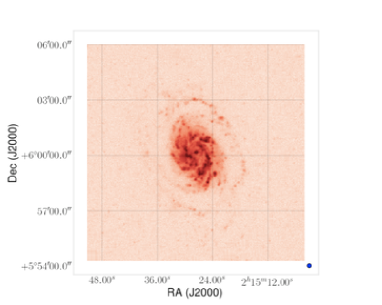
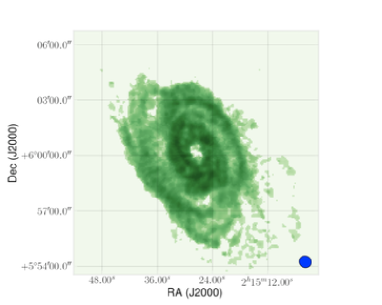
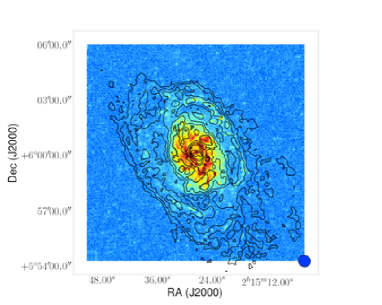
We present in Fig. 1 (lower left panel, green) the H I integrated density distribution. The H I extent is DHI = 129 at a level 0.7 M⊙ pc-2 (1 noise level, § 2.1), which results in an unusually large H I to optical extent ratio of DHI/D25 3.5. A similar ratio is that of M83, whose XUV disk properties have been previously studied in detail (Thilker et al., 2005, 2007; Bigiel et al., 2010b).
The VLA C+D configuration H I map reveals a large variety of structures that could not be clearly distinguished in the VLA D-configuration map due to the lower angular resolution. The inner ring, with projected diameters of 15 10, exhibits enhanced H I emission along the stellar spiral arms. The outer pseudo-ring, with an extent of 82 46, seems to be connected to the inner ring to the NE and SW of the inner disk. Overall the shape of the outer pseudo-ring resembles two giant spiral arms surrounding the optical disk.
Although the shape of the brighter features is quite symmetric, there is also a faint diffuse H I emission that is asymmetric. The kinematically detached component in the SW that was reported in Espada et al. (2005) at about a radius 6′ is seen here as a clumpy and extended component. A more detailed analysis of the whole H I data-cube will be presented in a forthcoming paper.
3.2. FUV and NUV Emission
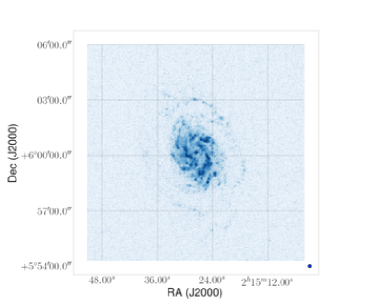
We present in Fig. 1 the NUV map (upper left panel, red) and FUV map (upper right panel, blue) with the same field of view than that of the H I map. Both NUV and FUV maps show an almost identical distribution. However, while the radially averaged FUV–NUV color 0.5 in the internal parts of the disk (in units of AB magnitudes per square arcsec), it reaches FUV–NUV = 0.1 – 0.2 in the most external regions.
First, there are two nearly symmetric arms, one starting at the E of the bar and extending towards the N, and another one starting at the W of the bar and extending toward the south. The SW arm’s appearance in both NUV and FUV emission is clumpy. This is similar appearance to that observed by Eskridge et al. (2002) in the optical and NIR. Eskridge et al. claim that the spiral pattern is flocculent in the outer parts of the inner optical/NIR disk ( 15). These flocculent regions are related to the connections between the outer H I pseudo-ring and the inner H I ring to the NE and SW at the P.A. of the inner disk. A central concentration is found unresolved, which is likely connected to a nuclear starburst (Martini et al., 2003).
Second, a more diffuse and extended component of UV emission is seen in the UV maps. Two symmetric spiral arms are apparent, extending from the NE and SW of the optical disk. These spiral arms join an outer pseudo-ring structure to the E and W starting at about = 2′. The pseudo-ring structure is the same as that seen in the H I outer disk, although the star-forming regions seem to be more confined to regions with high H I surface density. Other filamentary and more chaotic structures are seen out to almost = 6′, especially to the SW and to a minor extent in the NE.
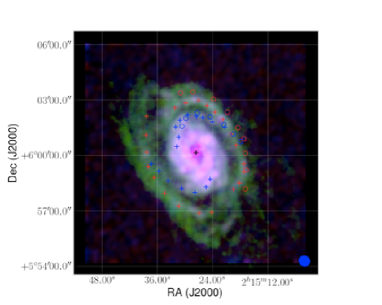
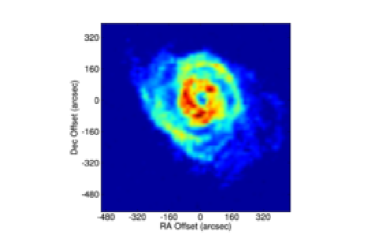
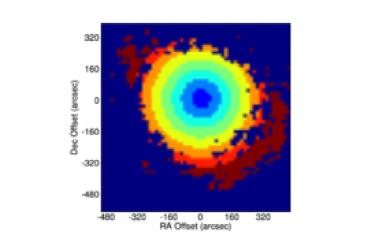
A composite image of the H I and NUV, FUV maps convolved to the resolution of the former is presented in Fig. 1 (lower right panel). An scheme (over the composite image) of main features in the outskirts of CIG 96 is shown in the upper panel of Fig. 2: spiral arms (blue cross signs) extending from the N to the W and from the S to the E, connecting the pseudo-ring structure (red cross signs). The circle signs indicate the SE spiral arm and pseudo-ring (SE side too) rotated by 180o, which shows that these features are nearly symmetrical.
The lower panel of Fig. 2 shows that the NUV (colour pixel map) and H I maps (contour map) have a high degree of correlation. This tight spatial correlation of H I and UV emission remains far into the outer pseudo-ring, and a diffuse component all over the H I envelope, as it can be seen in the last plotted contour.
3.3. Star Formation Law
We obtained the KS law (Schmidt, 1959; Kennicutt, 1998) pixel-by-pixel by comparing the gas surface density () map obtained from our H I data (§ 2.1) and the SFR surface density () from the extinction-corrected (radially) NUV data (§ 2.2). We converted the pixel size of both maps to 16″(as the H I beam size).
In the outskirts of disks the gaseous component is usually dominated by H I rather than by molecular gas, so the H I content is a good estimate of the total gas content, , especially below the saturation limit between atomic and molecular gas at 12 M⊙ pc-2 (Martin & Kennicutt, 2001; Wong & Blitz, 2002; Bigiel et al., 2008; Verley et al., 2009, 2010).
In order to calculate the we took into account the inclination of the galaxy and we multiplied by 1.36 to include the Helium contribution (Walter et al., 2008; Leroy et al., 2008):
where is the flux density for each channel and is the channel velocity width. The 1 noise level for = 0.7 M⊙ pc-2, using the sensitivity limit reached in our H I moment 0 map (§ 2.1).
As for the map we used the corrected NUV data (§ 2.2). In the literature, FUV is more widely used in order to derive SFR as it involves emission from young stars born in the last 100 Myr, more similar to the H ( 10 Myr) than to the NUV emission ( 300 Myr) (Verley et al., 2009). However, by using NUV, we achieve a gain in sensitivity and NUV emission is not essentially different to FUV to our resolution. This approach can also be useful for other sources with more sensitive NUV data than FUV. As for the ’hidden star formation’, i.e. the SF that we cannot correct from the UV color because it is completely obscured by dust in both bands, is expected to be negligible in the outer parts of disks, since Prescott & Kennicutt (2008) showed that there are no such regions at radii 0.6 for SINGS galaxies (Kennicutt et al., 2003).
We convolved the NUV map to match the resolution of the H I map. Following Kennicutt (1998), the was calculated as:
assuming solar metallicity, a Salpeter (1955) initial mass function (IMF) and that the SFR has remained constant over the last few 108 yr, which is the typical lifetime of stars dominating the UV emission. In this equation is the surface brightness (in AB magnitude units) of NUV emission. To convert to the SFR derived using Kroupa (2001)’s IMF one should multiply our SFR by a factor 0.83. The 1 sensitivity limit is = 9.2 10-6 M⊙ yr-1 kpc-2. In order to avoid projection effects, we have also deprojected both the and the maps.
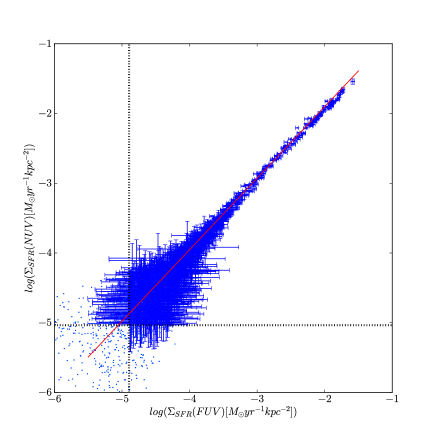
Fig. 3 shows the correlation between the derived from both the NUV and FUV maps pixels (16″size) within the inner 400″. The obtained from the FUV map has been calculated in a similar manner as the from the NUV map. The error bars presented in Fig. 3 represent the formal uncertainties obtained from the sensitivity limit as well as from the uncertainties associated to the extinction correction. A bisector fit to all the data points yields a slope equal to unity and an intercept close to 0 (1.02 0.03 and 0.15 0.01, respectively). We estimated the uncertainties using different random representations of the data taking into account the uncertainties (bootstrapping). We obtained similar uncertainties for the formal slope and intercept, 0.01 and 0.02, respectively. Finally, note that calculations of using alternate SFR tracers give differences of the order of 50% (Bigiel et al., 2010a; Leroy et al., 2008; Verley et al., 2009). We do not consider this uncertainty in our error estimation.
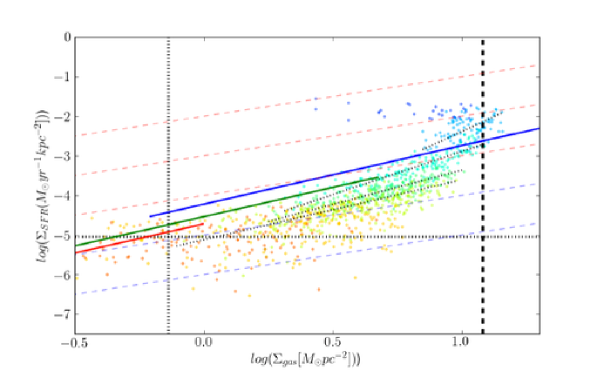
In Fig. 4 we show the vs plot for CIG 96. From the figure we can discern the saturation limit between atomic and molecular gas found for other galaxies at 12 M⊙ pc-2.
In order to inspect whether the local KS star formation law changes as a function of radius, we calculated a linear fit for different annuli centered at (2000) = 02h 15m 2764, (2000) = 06∘ 00′ 091 (Leon & Verdes-Montenegro, 2003). Each colour in the data points of the versus plot in the lower panel of Fig. 4 represents a different annulus zone over the deprojected H I map, as depicted in the upper panel of Fig. 4.
First, in the innermost region (r 08, or 4.8 kpc; in dark blue in the left upper panel of Fig.4), the correlation between versus is biased since at such radii the contribution of gas in molecular phase is presumably larger than that in atomic phase. For instance, MH2 = 2 108 M⊙ using CO(1–0) observation at the Swedish-ESO 15m Submillimeter Telescope (SEST), which is characterized by a HPBW = 42″ (radius 2 kpc) (Elfhag et al., 1996; Lisenfeld et al., 2011). If the molecular gas is distributed within a uniform distribution then the corresponding molecular gas surface density would be 11.5 M⊙ pc-2. The is likely larger since enhanced emission is expected toward the nucleus, inner spiral arms and along the bar. Should we include the molecular gas contribution, the correlation – would likely continue above 12 M⊙ pc-2 in a standard manner, with a slope N 1 – 1.4 as it is observed in other galaxies (e.g. Bigiel et al., 2008).
We find that the power index (bisector fit) of the KS law systematically changes with radius from N = 3.0 0.3 in the inner disk (08 – 17, or 4.8 – 10.2 kpc) to N = 1.6 0.5 in the pseudo-ring feature (33 – 42, or 19.8 – 25.2 kpc). Further out the correlations are biased since a considerably large amount of data points fall below the sensitivity limit. We detailed in Table 1 the parameters for the fit with as independent variable (OLS(Y—X)) as well as the least square bisector fit, and for annuli from 08 – 42 in bins of 08 (4.8 – 25.2 kpc in bins of 4.8 kpc). The estimated errors of the fit parameters have been calculated via bootstrapping, in the same manner as in the comparison from NUV and FUV. Note that in general these parameters are not strongly affected due to spatial resolution. Bigiel et al. (2008) shows that the power law parameters vary only weakly with changing spatial resolution.
Besides the uncertainty that results from the assumption , note that there is another source of uncertainty regarding a possible metallicity gradient that might affect the calculated (in the sense that metallicity is lower in the outskirts). Assuming a constant calibration for a given metallicity, it can be inferred that regions with a lower metallicity would have a lower for a fixed UV surface brightness (Leitherer et al., 1999).
3.4. Star Formation Efficiency
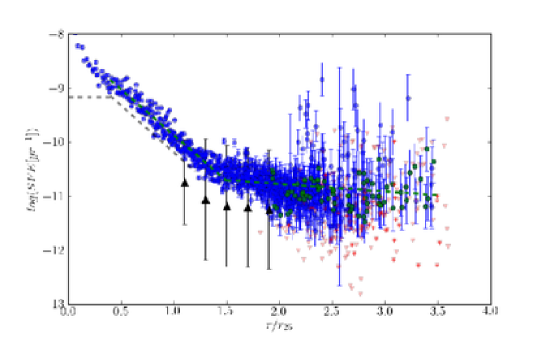
The SFE, the SF per unit gas mass, decreases with radius from values of 10-10 yr-1 in the inner ring to 10-11 yr-1 in the outskirts. In Fig. 5 we show the SFE as a function of radius (normalized to =/2). An increase in the observed scatter is present as a function of radius, from 0.2 dex to 1 dex.
For comparison we have plotted in Fig. 5 the derived fit for the SFE as a function of radius from Leroy et al. (2008):
Note that their calibration is valid up to 1.2 (Leroy et al., 2008).
The agreement between this fit from Leroy et al. (2008) and our SFE radial profile is reasonably good at 0.4 r25 1.5 r25. Although our fit is slightly offset towards higher values, the slope is essentially the same in this radius range. The fit to our data and that of Leroy et al. (2008) are shown in Fig. 5 as dashed lines.
From 1.5 r25 the fit by Leroy et al. (2008) would start to deviate considerably from our data, in the same manner as pointed out in other spiral galaxies by Bigiel et al. (2010a). It seems to be more constant, at least for those regions where and are above the noise level (blue data points). For such regions the SFE 10-11. The fit to our data is shown in Fig. 5 as a green dashed line. It fits relatively well (rms 0.5 dex) over a radius range 1.5 r25 3.5 r25. Note that the scatter is large enough to consider the fit parameters just as estimates. This region corresponds to the pseudo-ring feature. Many of the detected regions in the radius range 1.7 r25 3.5 r25 are within the kinematically detached clump located to the SW (Espada et al., 2005) (green circles).
Red triangle signs in Fig. 5 correspond to upper limits in , although detected in , and thus upper limits in SFE. These data points would probably increase the scatter of SFE at large radii.
4. Model of the Multi-wavelength Light Distribution of CIG 96
We inspect in this section whether the photometric properties, including the XUV emission, is common of a spiral galaxy disk (with a given spin and mass), or whether on the contrary it is a peculiar object not only for its photometric properties but also for its SF history.
4.1. Model
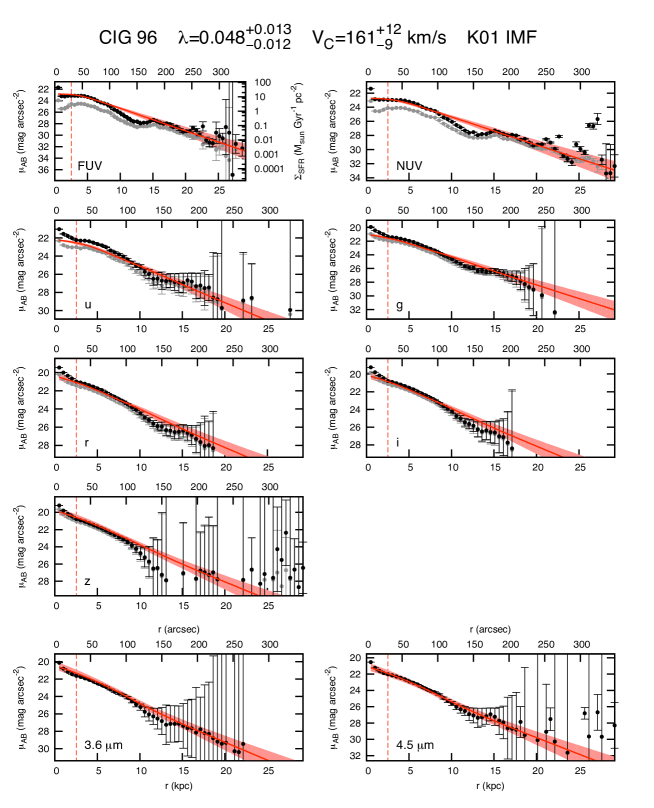
We derived photometric radial profiles for CIG 96 not only in the GALEX FUV and NUV bands, but also in the Sloan Digital Sky Survey (SDSS) ugriz bands and the Spitzer (Werner et al., 2004) IRAC 3.6 and 4.5 bands (Fazio et al., 2004) 333We used the Basic Calibrated Data publicy available in the Spitzer archive. These images were obtained as part of the Spitzer Survey of Stellar Structure in Galaxies (P.I. K. Sheth)..
These multi-wavelength radial profiles were fitted with the models of Boissier & Prantzos (1999, 2000) with the IMF from Kroupa (2001), which are able to predict the radial variation of several galactic properties as a funcion of two parameters: the spin (non-dimensional specific angular momentum) and the asymptotic velocity of the rotation curve . Galaxies are modeled as a set of independently evolving rings, with the gas infall time-scale depending on both the total galaxy mass and the local mass surface density. Gas is then converted into stars following a Kennicutt-Schmidt law, modulated by a dynamical term that mimics the periodic passage of spiral arms (see also Boissier et al. 2003a). Newly-born stars follow a user-specified IMF (here we rely on that of Kroupa 2001). Stars of different masses die at different rates, enriching the ISM with metals that are incorporated in subsequent generations of stars. The lifetimes, yields, evolutionary paths and spectra of stars at different radii are computed as a function of the local metallicity. An initial model was first calibrated to reproduce observables in the Milky Way (Boissier & Prantzos, 1999). This model was then generalized to other galaxies (Boissier & Prantzos, 2000), using the scaling laws derived from the -Cold Dark Matter scenario (Mo et al., 1998).
The GALEX, SDSS and Spitzer photometric profiles were simultaneously fitted with these disk evolution models. The internal extinction profiles in the optical and near-IR bands were derived from the UV ones using a MW extinction law and a sandwich dust-to-stars geometry (further details on the fitting procedure can be found in Muñoz-Mateos et al. 2011). By minimizing the between the observed and predicted photometric profiles, the best-fitting values were found to be and km s-1. Using other models characterized by an IMF with less massive stars (i.e. Kroupa et al. 1993) or excluding the XUV disk further out than 150″ does not successfully reproduce both photometric profiles and the observed H I rotation curve as the ones used here do (Espada et al., 2005).
We plot in each panel of Fig. 6 the de-projected surface density profile for each band considered, as well as the fits from the model. The agreement is good for all components. For UV bands, the azimuthally averaged AB magnitudes seem to be slightly underestimated in the = 10″– 15″region, although in general they agree well.
The KS law was expressed in § 3.3 in the form , with varying for different annuli. On the other hand, the SFR in the model is expressed as . To check the consistency between both definitions, in Fig. 4 (bottom) we plot the temporal evolution from (0 to 13.5 Gyr) of and using the model, and for different radii, 5.5 (blue), 10.9 (green) and 20 kpc (red). No obvious offset is found, which indicates that this galaxy is in general following the SF law implemented in the models, which relies on average main properties of galaxies.
Note that the models used here are not necessarily good at reproducing the properties of galaxy disks out to these large radii. The model itself does not include an imposed threshold, and although it is an extrapolation, it should work reasonably well for low density regions and outskirts as long as there is no strong threshold effects and the mode of star formation does not change. In fact these models have been tested against observations of Low Surface Brightness galaxies in Boissier et al. 2003b.
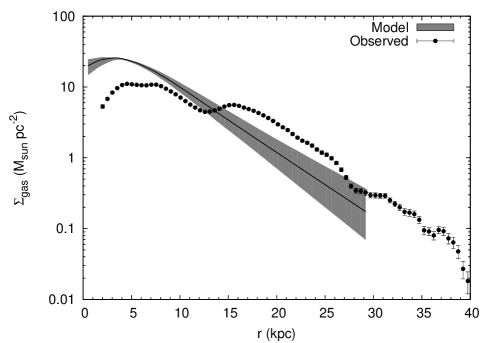
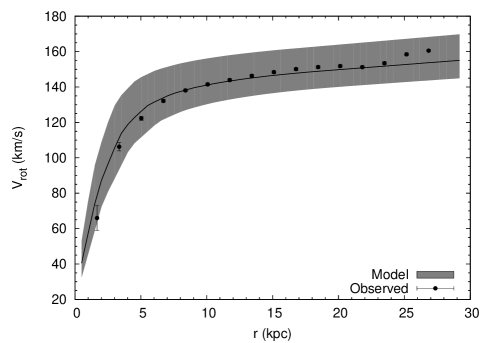
4.2. Predicted Rotation Curve and Gas Surface Density
The model provides an estimation of the rotation curve and as a function of radius. We compare the observed gas surface density with that predicted by the model in the upper panel of Fig. 7. A small deviation is found at low radii, where most of the gaseous component is in molecular phase, and at large radii from 15 kpc ( 3′) where the model underestimates the observed surface density as a result of the external pseudo-ring and the extended UV emission in general.
The latter can be probably explained as a result of a past recent event that re-distributed part of the gas on time scale shorter than that probed by the different bands, because they average over the lifetime of the galaxy. UV emission, which as H I should be sensitive to any perturbation, agrees relatively well to the model. This suggests that a recent event could have occurred, such as accretion, in order for the H I to show this deviation with respect to the model.
5. Discussion and Conclusions
The outer regions of disk galaxies are essential as testing sites for models of disk assembly and evolution. XUV-disk galaxies are ideal laboratories to study low SFR and low gas surface densities conditions. SF in the extreme (low-density, low-metallicity) environment of the outskirts of galaxy disks can elucidate the limiting conditions for gas cloud formation and subsequent SF.
CIG 96 is a unique object because it resides in isolation ( 3 Gyr since last major interaction) and has an extended star forming disk, even though XUV disks are usually ascribed to major interaction events. The observed gas surface density from 25 to 47 (15 kpc to 28 kpc) is larger than that expected from our model, even though the kinematics is in average well reproduced. This suggests that this extra gas and SF could be an anomaly in a (until-recently) well-behaved disk with a (non-dimensional) specific angular momentum =0.048 and an asymptotic velocity of the rotation curve = 161 km s-1.
Our sensitive and high resolution data allowed us to derive the power law index of the KS law locally for different annuli, even at large radii. We find that the slope decreases with radius, being N 3.0 0.3 in the inner disk (08 – 17) and decreasing to N = 1.60 0.5 in the outskirts of the gaseous disk (33 – 42). The KS law index tends to unity as radius increases. This might reveal a privileged relation between H I and SF where the amount of molecular gas content traced by CO is small. H I could thus be a good tracer of star forming gas in this low density low metallicity conditions. More sensitive observations of both H I and UV are necessary to reveal what is the limit for the KS index in extended disks.
We found that up to the pseudo-ring feature the SFE radial profile is typical of other disk galaxies, with SFE decreasing with radius. Overall, the SFE spans typical values from 10-9 yr-1 to 10-12 yr-1. Interestingly, the outer part of the H I disk, the pseudo-ring feature, shows a break in the decreasing trend of the SFE presented for example by Leroy et al. (2008). The SFE for regions outside the inner disk ( 1.5 ) is SFE 10-11 yr-1 (§ 3.3). There are regions that share this constant value up to 3.5, especially the southern part which Espada et al. (2005) showed that it is actually a kinematically detached region to the rest of the disk. Regions with no relevant but above the noise level of suggest very low SFE, of the order of about 10-11 yr-1. The depletion time scales involved are quite large and thus the gas is very likely a reservoir for future SF. Even for the pseudo-ring feature that has a larger SFE for its radius, if 1% of the gas turns into stars in 108 yrs, the time scale for consuming all the gas would be large, of the order of 10 Gyr.
Are these deviations in SFE at large radii the rule more than the exception in other XUV disks? There are two pieces of evidence that seems to show that these deviations from normal values may be commonly present in other galaxies. In Fig. 1 of Leroy et al. (2008), where SFE is plotted vs galactocentric radius, the average of SFE for all the data points is larger than their fit for / 1.0. Unfortunately their calibration limit is / = 1.2. Probably the most relevant case to compare the SFE at large radii is that of M83. M83’s extended H I disk reaches, as in CIG 96, a radius 3.5 , and it has been widely studied in the UV and H I by Bigiel et al. (2010b). The SFE in both cases level off at 1.5 with a value of 10-11 yr-1. Note that for M83 this corresponds to the depletion time = 102 Gyr in Fig. 4 right panel of Bigiel et al. 2010b), also with a scatter 0.5 – 1 dex. These evidences suggest that we might have higher SFE in extended disks with respect to that extrapolated from inner radii. In order to check the generality of this result, deeper H I and UV observations of more XUV disks are needed.
Next question is what mechanism is enhancing the H I densities and triggering the SF in the outskirts of these galaxies? The isolation of CIG 96 since about 3 Gyr ago allow us to discard the major interaction event scenario. Thus, if gravitational instabilities induced by interactions (e.g. Gil de Paz et al. 2005) are producing the observed spiral arms and pseudo-ring feature, then we can reject the major interaction event. It must be due to minor companions (hypothesis explored by Espada et al. 2005), extragalactic clouds,or dark matter sub-halos (Tenorio-Tagle, 1981; Bekki & Chiba, 2006). Espada et al. (2005) suggested the possibility of an accretion of a HI-rich companion to be the responsible of the SW kinematically detached clump and the overall outer ring-like structure.
However, given the remarkable spiral symmetry found in the UV and H I maps (i.e. two symmetric spiral arms from the N and S of the optical disk, and connecting the outer pseudo-ring feature to the E and W, respectively), one may think that it is an intrinsic property of the galaxy rather than induced by the environment. The outer spiral arms could be due to an instability or could be driven, either by a non-axisymmetric halo (e.g. Machado & Athanassoula, 2010), or by a non-axisymmetric disk. We favor this last option, although it is difficult to prove, or disprove since the major axis of this oval would be more or less aligned with the kinematical major axis. But the global morphology makes this option quite plausible. In particular, the arms emanate symmetrically in the NW and SE, and then fall back at the other side. This is a pattern expected in the manifold theory (Romero-Gómez et al., 2006, 2007; Athanassoula et al., 2009a, b, 2010) if the disk is oval and the manifolds allow the orbits to make a 270o turn, while meeting the opposite arm.
References
- Athanassoula et al. (2009a) Athanassoula, E., Romero-Gómez, M., & Masdemont, J. J. 2009a, MNRAS, 394, 67
- Athanassoula et al. (2009b) Athanassoula, E., Romero-Gómez, M., Bosma, A., & Masdemont, J. J. 2009b, MNRAS, 400, 1706
- Athanassoula et al. (2010) Athanassoula, E., Romero-Gómez, M., Bosma, A., & Masdemont, J. J. 2010, MNRAS, 407, 1433
- Bauermeister et al. (2010) Bauermeister, A., Blitz, L., & Ma, C.-P. 2010, ApJ, 717, 323
- Bettoni et al. (2010) Bettoni, D., Buson, L. M., & Galletta, G. 2010, A&A, 519, A72
- Bekki & Chiba (2006) Bekki, K., & Chiba, M. 2006, ApJ, 637, L97
- Bigiel et al. (2008) Bigiel, F., Leroy, A., Walter, F., Brinks, E., de Blok, W. J. G., Madore, B., & Thornley, M. D. 2008, AJ, 136, 2846
- Bigiel et al. (2010a) Bigiel, F., Leroy, A., Walter, F., Blitz, L., Brinks, E., de Blok, W. J. G., & Madore, B. 2010a, AJ, 140, 1194
- Bigiel et al. (2010b) Bigiel, F., Leroy, A., Seibert, M., Walter, F., Blitz, L., Thilker, D., & Madore, B. 2010b, ApJ, 720, L31
- Bosma (1981) Bosma, A. 1981, AJ, 86, 1791
- Boissier & Prantzos (1999) Boissier, S., & Prantzos, N. 1999, MNRAS, 307, 857
- Boissier et al. (2007) Boissier, S., et al. 2007, ApJS, 173, 524
- Boissier & Prantzos (2000) Boissier, S., & Prantzos, N. 2000, MNRAS, 312, 398
- Boissier et al. (2003a) Boissier, S., Prantzos, N., Boselli, A., & Gavazzi, G. 2003, MNRAS, 346, 1215
- Boissier et al. (2003b) Boissier, S., Monnier Ragaigne, D., Prantzos, N., van Driel, W., Balkowski, C., & O’Neil, K. 2003, MNRAS, 343, 653
- Bresolin et al. (2009) Bresolin, F., Ryan-Weber, E., Kennicutt, R. C., & Goddard, Q. 2009, ApJ, 695, 580
- Buat et al. (2005) Buat, V., et al. 2005, ApJ, 619, L51
- Calzetti et al. (1994) Calzetti, D., Kinney, A. L., & Storchi-Bergmann, T. 1994, ApJ, 429, 582
- Cortese et al. (2008) Cortese, L., Boselli, A., Franzetti, P., Decarli, R., Gavazzi, G., Boissier, S., & Buat, V. 2008, MNRAS, 386, 1157
- de Vaucouleurs et al. (1991) de Vaucouleurs, G., de Vaucouleurs, A., Corwin, H. G., Jr., Buta, R. J., Paturel, G., & Fouque, P. 1991, Volume 1-3, XII, 2069 pp. 7 figs.. Springer-Verlag Berlin Heidelberg New York,
- Dong et al. (2008) Dong, H., Calzetti, D., Regan, M., Thilker, D., Bianchi, L., Meurer, G. R., & Walter, F. 2008, AJ, 136, 479
- Elfhag et al. (1996) Elfhag, T., Booth, R. S., Hoeglund, B., Johansson, L. E. B., & Sandqvist, A. 1996, A&AS, 115, 439
- Elmegreen & Hunter (2006) Elmegreen, B. G., & Hunter, D. A. 2006, ApJ, 636, 712
- Eskridge et al. (2002) Eskridge, P. B., et al. 2002, ApJS, 143, 73
- Espada et al. (2005) Espada, D., Bosma, A., Verdes-Montenegro, L., Athanassoula, E., Leon, S., Sulentic, J., & Yun, M. S. 2005, A&A, 442, 455
- Fazio et al. (2004) Fazio, G. G., et al. 2004, ApJS, 154, 10
- Gil de Paz et al. (2005) Gil de Paz, A., et al. 2005, ApJ, 627, L29
- Gil de Paz et al. (2007) Gil de Paz, A., et al. 2007, ApJS, 173, 185
- Haynes et al. (1998) Haynes, M. P., van Zee, L., Hogg, D. E., Roberts, M. S., & Maddalena, R. J. 1998, AJ, 115, 62
- Heckman et al. (1995) Heckman, T., et al. 1995, ApJ, 452, 549
- Huchtmeier & Richter (1982) Huchtmeier, W. K., & Richter, O.-G. 1982, A&A, 109, 331
- Karachentseva (1973) Karachentseva, V. E. 1973, Astrofizicheskie Issledovaniia Izvestiya Spetsial’noj Astrofizicheskoj Observatorii, 8, 3
- Kennicutt et al. (1994) Kennicutt, R. C., Jr., Tamblyn, P., & Congdon, C. E. 1994, ApJ, 435, 22
- Kennicutt (1998) Kennicutt, R. C., Jr. 1998, ApJ, 498, 541
- Kennicutt et al. (2003) Kennicutt, R. C., Jr., et al. 2003, PASP, 115, 928
- Kroupa et al. (1993) Kroupa, P., Tout, C. A., & Gilmore, G. 1993, MNRAS, 262, 545
- Kroupa (2001) Kroupa, P. 2001, MNRAS, 322, 231
- Leitherer et al. (1999) Leitherer, C., et al. 1999, ApJS, 123, 3
- Leon & Verdes-Montenegro (2003) Leon, S., & Verdes-Montenegro, L. 2003, A&A, 411, 391
- Leroy et al. (2008) Leroy, A. K., Walter, F., Brinks, E., Bigiel, F., de Blok, W. J. G., Madore, B., & Thornley, M. D. 2008, AJ, 136, 2782
- Lisenfeld et al. (2011) Lisenfeld, U. et al., 2011, A&A, submitted.
- Machado & Athanassoula (2010) Machado, R. E. G., & Athanassoula, E. 2010, MNRAS, 406, 2386
- Martin & Kennicutt (2001) Martin, C. L., & Kennicutt, R. C., Jr. 2001, ApJ, 555, 301
- Martin et al. (2005) Martin, D. C., et al. 2005, ApJ, 619, L1
- Martini et al. (2003) Martini, P., Regan, M. W., Mulchaey, J. S., & Pogge, R. W. 2003, ApJS, 146, 353
- Meurer et al. (1999) Meurer, G. R., Heckman, T. M., & Calzetti, D. 1999, ApJ, 521, 64
- Mo et al. (1998) Mo, H. J., Mao, S., & White, S. D. M. 1998, MNRAS, 295, 319
- Muñoz-Mateos et al. (2009) Muñoz-Mateos, J. C., et al. 2009, ApJ, 701, 1965
- Muñoz-Mateos et al. (2011) Muñoz-Mateos, J. C., Boissier, S., Gil de Paz, A., Zamorano, J., Kennicutt, R. C., Jr., Moustakas, J., Prantzos, N., & Gallego, J. 2011, ApJ, 731, 10
- Nilson (1973) Nilson, P. 1973, Nova Acta Regiae Soc. Sci. Upsaliensis Ser. V, 0
- Paturel et al. (2000) Paturel, G., Fang, Y., Petit, C., Garnier, R., & Rousseau, J. 2000, A&AS, 146, 19
- Paturel et al. (2003) Paturel, G., Theureau, G., Bottinelli, L., Gouguenheim, L., Coudreau-Durand, N., Hallet, N., & Petit, C. 2003, A&A, 412, 57
- Prescott & Kennicutt (2008) Prescott, M. K. M., & Kennicutt, R. C. 2008, Infrared Diagnostics of Galaxy Evolution, 381, 181
- Salpeter (1955) Salpeter, E. E. 1955, ApJ, 121, 161
- Romero-Gómez et al. (2006) Romero-Gómez, M., Masdemont, J. J., Athanassoula, E., & García-Gómez, C. 2006, A&A, 453, 39
- Romero-Gómez et al. (2007) Romero-Gómez, M., Athanassoula, E., Masdemont, J. J., & García-Gómez, C. 2007, A&A, 472, 63
- Schlegel et al. (1998) Schlegel, D. J., Finkbeiner, D. P., & Davis, M. 1998, ApJ, 500, 525
- Schmidt (1959) Schmidt, M. 1959, ApJ, 129, 243
- Speltincx et al. (2008) Speltincx, T., Laurikainen, E., & Salo, H. 2008, MNRAS, 383, 317
- Tenorio-Tagle (1981) Tenorio-Tagle, G. 1981, A&A, 94, 338
- Thilker et al. (2005) Thilker, D. A., et al. 2005, ApJ, 619, L79
- Thilker et al. (2007) Thilker, D. A., et al. 2007, ApJS, 173, 538
- Thilker et al. (2009) Thilker, D. A., et al. 2009, Nature, 457, 990
- Toomre (1964) Toomre, A. 1964, ApJ, 139, 1217
- Tully (1988) Tully, R. B. 1988, Cambridge and New York, Cambridge University Press, 1988, 221 p.,
- Verdes-Montenegro et al. (2005) Verdes-Montenegro, L., Sulentic, J., Lisenfeld, U., Leon, S., Espada, D., Garcia, E., Sabater, J., & Verley, S. 2005, A&A, 436, 443
- Verley et al. (2007a) Verley, S., et al. 2007a, A&A, 470, 505
- Verley et al. (2007b) Verley, S., et al. 2007b, A&A, 472, 121
- Verley et al. (2009) Verley, S., Corbelli, E., Giovanardi, C., & Hunt, L. K. 2009, A&A, 493, 453
- Verley et al. (2010) Verley, S., Corbelli, E., Giovanardi, C., & Hunt, L. K. 2010, A&A, 510, A64
- Walter et al. (2008) Walter, F., Brinks, E., de Blok, W. J. G., Bigiel, F., Kennicutt, R. C., Thornley, M. D., & Leroy, A. 2008, AJ, 136, 2563
- Werner et al. (2004) Werner, M. W., et al. 2004, ApJS, 154, 1
- Witt & Gordon (2000) Witt, A. N., & Gordon, K. D. 2000, ApJ, 528, 799
- Wong & Blitz (2002) Wong, T., & Blitz, L. 2002, ApJ, 569, 157

| OLS(Y—X) | Bisector | ||||
|---|---|---|---|---|---|
| Zone | Radius range (′) / (kpc) | Slope (N) | Intercept | Slope (N) | Intercept |
| 1 | 0.8 – 1.7 (4.8 – 10.2) | 1.7 0.3 | -4.0 0.3 | 3.0 0.3 | -5.4 0.3 |
| 2 | 1.7 – 2.5 (10.2 – 15.0) | 1.9 0.3 | -4.9 0.2 | 2.18 0.10 | -5.07 0.11 |
| 3 | 2.5 – 3.3 (15.0 – 19.8) | 1.4 0.2 | -4.85 0.14 | 1.7 0.2 | -5.1 0.3 |
| 4 | 3.3 – 4.2 (19.8 – 25.2) | 1.2 0.2 | -5.1 0.10 | 1.6 0.5 | -5.3 0.6 |